Low-metallicity stellar halo populations as tracers of dark matter haloes
Abstract
We analyse the density profiles of the stellar halo populations in eight Milky-Way mass galaxies, simulated within the -Cold Dark Matter scenario. We find that accreted stars can be well-fitted by an Einasto profile, as well as any subsample defined according to metallicity. We detect a clear correlation between the Einasto fitting parameters of the low-metallicity stellar populations and those of the dark matter haloes. The correlations for stars with [Fe/H] allow us to predict the shape of the dark matter profiles within residuals of per cent, in case the contribution from in situ stars remains small. Using Einasto parameters estimated for the stellar halo of the Milky Way and assuming the later formed with significant contributions from accreted low-mass satellite, our simulations predict and kpc for its dark matter profile. These values, combined with observed estimations of the local dark matter density, yield an enclosed dark matter mass at kpc in the range M⊙, in agreement with recent observational results. These findings suggest that low-metallicity stellar haloes could store relevant information on the DM haloes. Forthcoming observations would help us to further constrain our models and predictions.
keywords:
galaxies: haloes, galaxies: structure, cosmology: dark matter1 Introduction
The stellar halo populations are important components of galaxies which extend around them out to few hundreds of kiloparsecs. Observations show that they are complex structures where debris from stripped satellites, stars, and surviving satellites can be identified within diffuse stellar envelopes. Stellar halo populations have been detected out to several kiloparsecs from the galaxy centre in nearby galaxies, regardless of their morphology (e.g. Rejkuba et al., 2011; Sarajedini et al., 2012; Crnojević et al., 2013; Ibata et al., 2014). There are also evidences of stellar haloes in galaxies at (Trujillo & Bakos, 2013). The Milky Way (MW) is the best observed stellar halo where detailed kinematics and chemical abundances for individual stars are being obtained from different surveys, allowing the identification of chemical-dynamical patterns (e.g. Carollo et al., 2007; Nissen & Schuster, 2010; Deason et al., 2011a; Sheffield et al., 2012; Beers et al., 2012; Schönrich et al., 2014). Such a detailed analysis is now being extended to nearby galaxies as in the case of M31 and M32 (e.g. Sarajedini et al., 2012; Ibata et al., 2014). These observational results provide invaluable information to constrain cosmological models.
Simulations within a hierarchical clustering scenario show that most of the stars in the stellar haloes come from accreted satellites in wet or dry mergers (e.g. Bullock & Johnston, 2005; Purcell et al., 2009; Zolotov et al., 2009; Cooper et al., 2010; Font et al., 2011; Tissera et al., 2012; Tissera et al., 2013; Pillepich et al., 2014). Hydrodynamical simulations, including chemical evolution, produce stellar halo populations that are old and high -enriched in agreement with observations. Tissera et al. (2014) show how the metallicity distribution of stellar haloes vary with the radius depending on the accretion histories. Simulations also detect the existence of a fraction of stars formed in situ, which could explain the presence of stars with lower -enhancement and significant rotation velocities reported in observations of the MW (e.g. Sheffield et al., 2012).
Stellar haloes contain an important fraction of old and metal-poor stars, which are a window towards the first epoques of the formation of galaxies (e.g Placco et al., 2014, and references there in) and hence, might store information relevant to galaxy formation. Using cosmological simulations of MW mass galaxies, Tissera et al. (2014) reported the fraction of low-metallicity stars to increase with radius. They also found about per cent of these stars formed in accreted low-mass satellites ( M⊙). Low-metallicity stars populate the whole stellar haloes, mapping the potential well more uniformly out to the virial radius.
The stellar halo populations inhabit the potential well determined by the dark matter (DM) mass. As satellites fall in, they are disrupted, contributing with stars and gas to the haloes. Unlike the gas that experiences significant dissipation during infall, the stars are expected to store information for a longer time (Eggen et al., 1962). In particular, the low-metallicity stars might be the best tracers of the potential well, as they come in small mass satellites which are easily disrupted and are mainly subject to the gravitational potential well dominated by the DM.
The aim of this paper is to explore if the stellar halo populations, and particularly the low-metallicity stars, can trace the DM distributions. For this purpose, we use a suite of MW mass haloes from the Aquarius Project which were modified to include gas dynamics. The chemo-dynamical properties and history of assembly of the stellar halo populations of these haloes have been extensively studied by Tissera et al. (2012); Tissera et al. (2013, 2014). The DM profiles of six of them were analysed by Tissera et al. (2010).
This letter is organized as follow. Section 2 describes the numerical simulations and models. In Section 3 we analyse and discuss the density profiles of stellar halo populations and correlate them with those of their dark matter haloes. In the conclusions section, we summarize our main results.
2 The simulated haloes
We analysed the suite of eight MW mass-galaxy systems of the Aquarius Project reported by Scannapieco et al. (2009), which were modified to include baryons. The systems were selected from a cosmological volume of box, with only a mild isolation criterium imposed at and the requirement to have similar total mass to the MW (see Springel et al. (2008) for further details on the generation of the initial conditions). The simulations are consistent with a -CDM cosmogony with and with . The simulated haloes have million total particles within the virial radius and virial mass in the range . Dark matter particles have masses of the order while initially gas particles have . More details on the simulated galaxies can be found in Scannapieco et al. (2009) and Tissera et al. (2012). We used a version of GADGET-3 which includes stochastic star formation, a physically-motivated Supernova (SN) feedback model and chemical enrichment by Type II and Ia SNe. Details on the SN model can be found in Scannapieco et al. (2005, 2006). Scannapieco et al. (2009, 2010, 2011) studied the formation of the disc and the spheroidal components of these systems and their dynamical and photometric properties. The main galaxies have a variety of morphologies with different bulge-to-disc ratios.
We follow Tissera et al. (2012); Tissera et al. (2013, 2014) and apply a criterium based on angular momentum and binding energy to separate the different dynamical components. Stellar halo stars are a subset of the spheroid stars, those for which the binding energy is lower than the minimum one at the half-mass radii of the galaxies. Note that we do not consider in the stellar haloes particles belonging to friends-of-friends groups of more than 20 particles. Hence, our stellar haloes do not contain satellites, but they do include streams and small substructures from disrupted satellites.
Tissera et al. (2013) and Tissera et al. (2014) analysed the formation of the stellar haloes and in particular, how to use the chemical distributions to set constrains on the history of mass assembly. In our simulations the stellar diffuse haloes are mainly made by debris stars which formed in accreted satellites (outside or inside the virial radius) and disc-heated stars (so-called in situ). The latter are found to be more centrally concentrated. Tissera et al. (2014) showed that stellar haloes formed by the accretion of massive subgalactic systems have steeper metallicity gradients. They also reported that low-metallicity stars are mainly contributed by low-mass satellites and are more frequent in the outskirts of haloes.
3 The relation between the stellar and DM haloes
We construct the density profiles of the stellar halo populations by using spherical shells from kpc to the virial radius, centred at the galaxy centre. The density profiles are constructed for the in situ and accreted stellar components, separately. Within the accreted stars, we include debris (i.e. stars formed in satellites before coming into the virial radius of the main galaxy) and endo-debris (i.e. those stars formed in gas-rich satellites within the virial radius of the main galaxy). We define two population subsamples according to their metallicity: very metal-poor (VMP) and extremely metal-poor (EMP) by requiring them to satisfy: [Fe/H] and [Fe/H] , respectively.
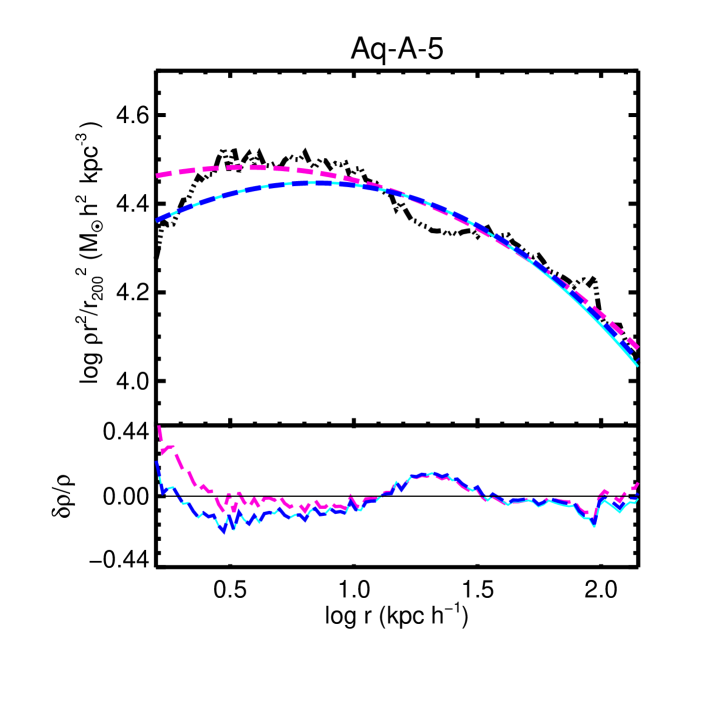
We estimate the density profiles for each metallicity subsample and for both types of stellar populations. The profiles for the in situ (green dotted lines) and accreted (solid green lines) stellar components, without metallicity segregation, are shown in Fig. 1. These distributions show how in situ stars are more concentrated in the central regions while accreted ones extend up to the virial radius. There are two haloes with larger relative in situ contributions: Aq-A-5 and Aq-H-5. In the case of Aq-B-5 and Aq-F-5, the contributions of in situ are very small.
The lower subsequent set of profiles included in Fig. 1 are those obtained for the VMP (red lines) and EMP (violet lines) subsamples. The contributions from in situ stars diminish systematically as the metallicity threshold gets more stringent, since these stars have a large probability to have been formed from recycled material, polluted by previous stellar generations. Disc-heated stars are younger than accreted stars and have larger -enhancements, on average (Tissera et al., 2012; Tissera et al., 2013). Hence, as we move to lower metallicity subsamples, the density profiles are mainly determined by accreted stars. As discussed by Tissera et al. (2014), accreted stars are mainly contributed by small galaxy satellites (few times M⊙) and have a frequency which increases outwards.
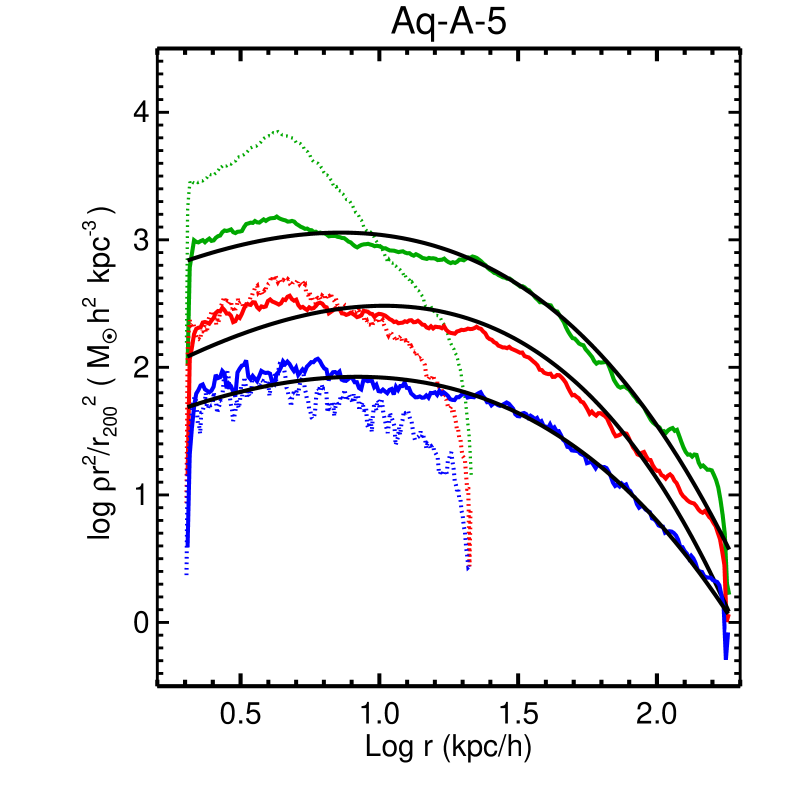
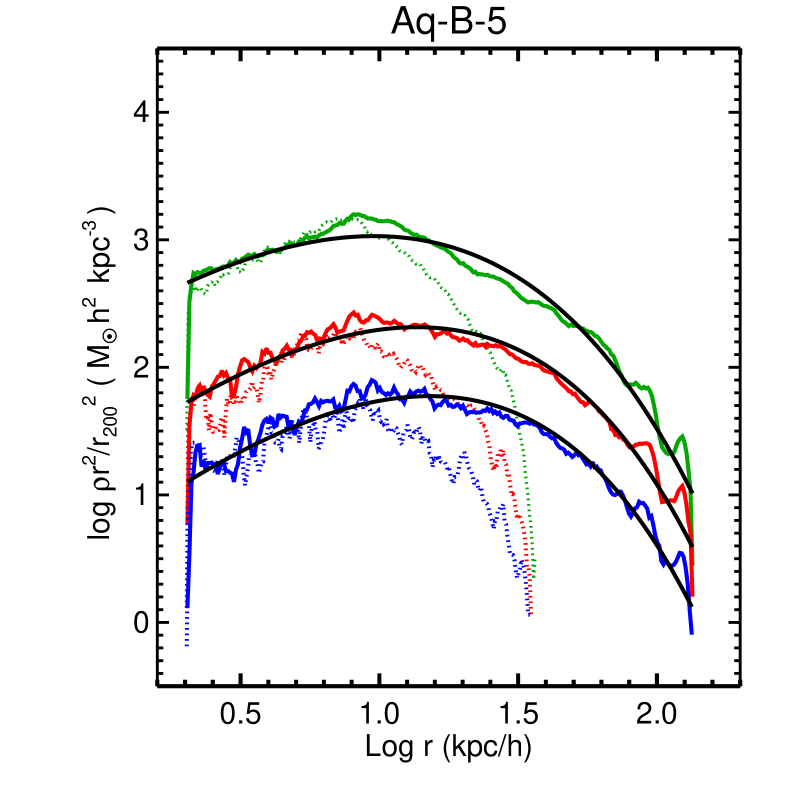
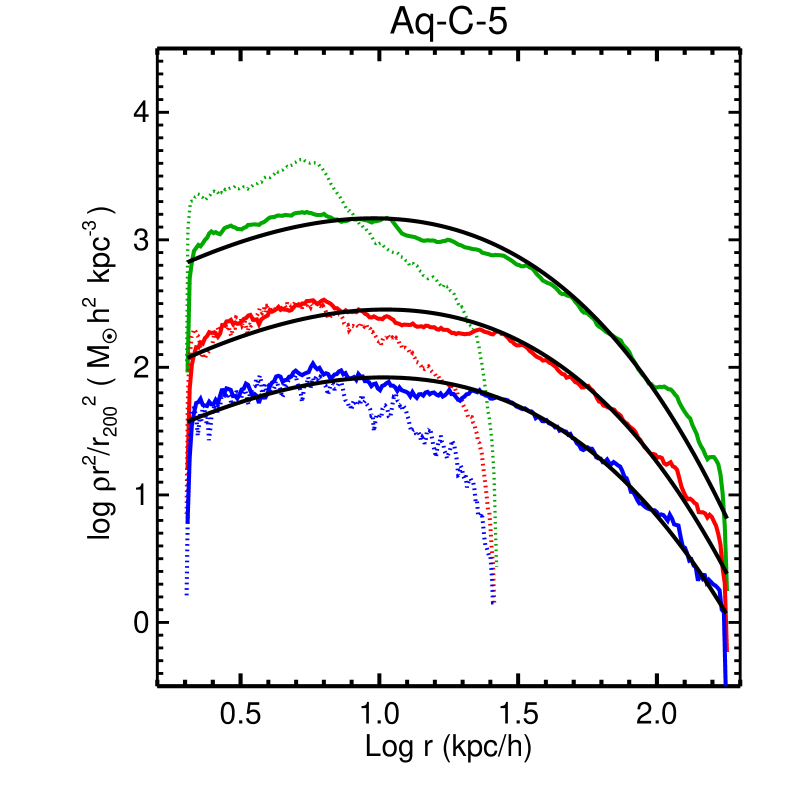
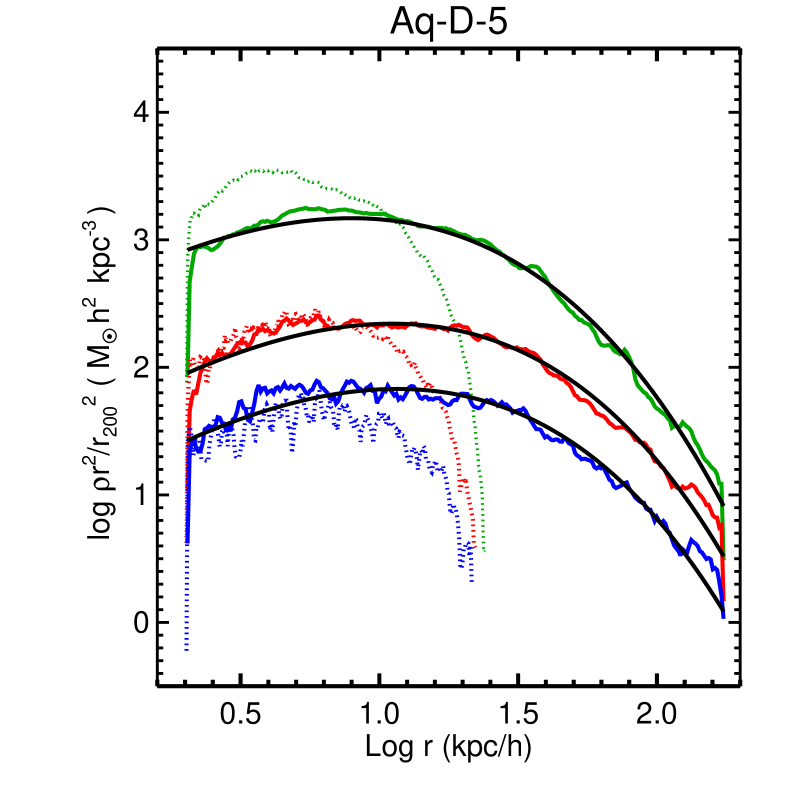
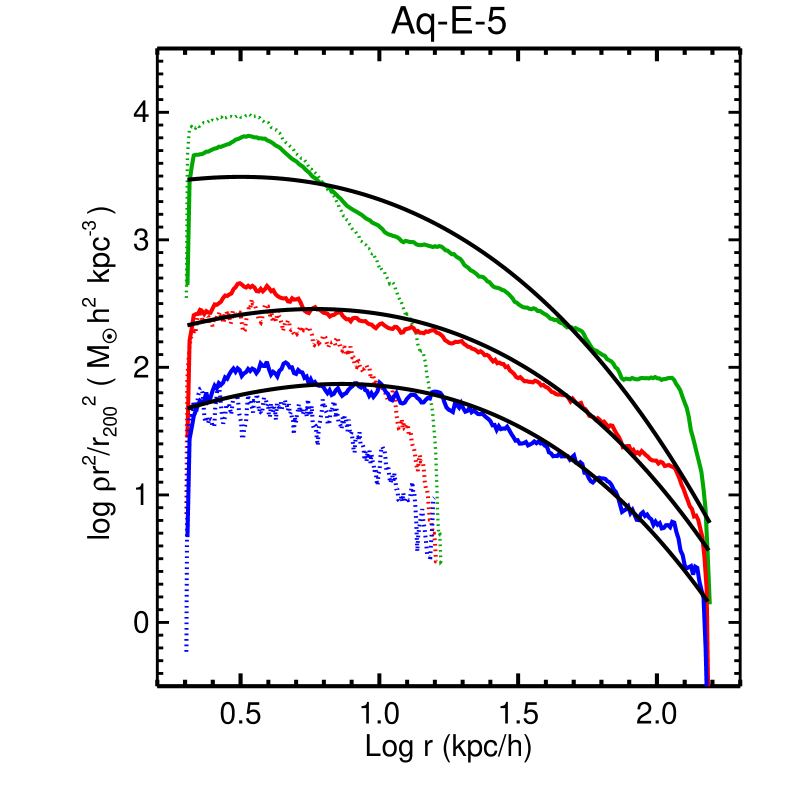
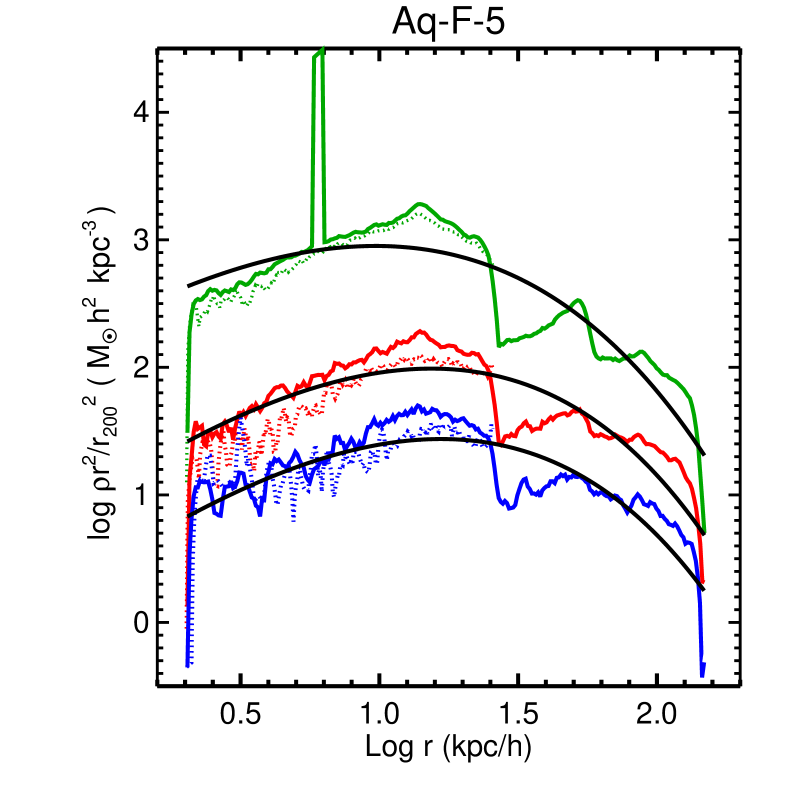
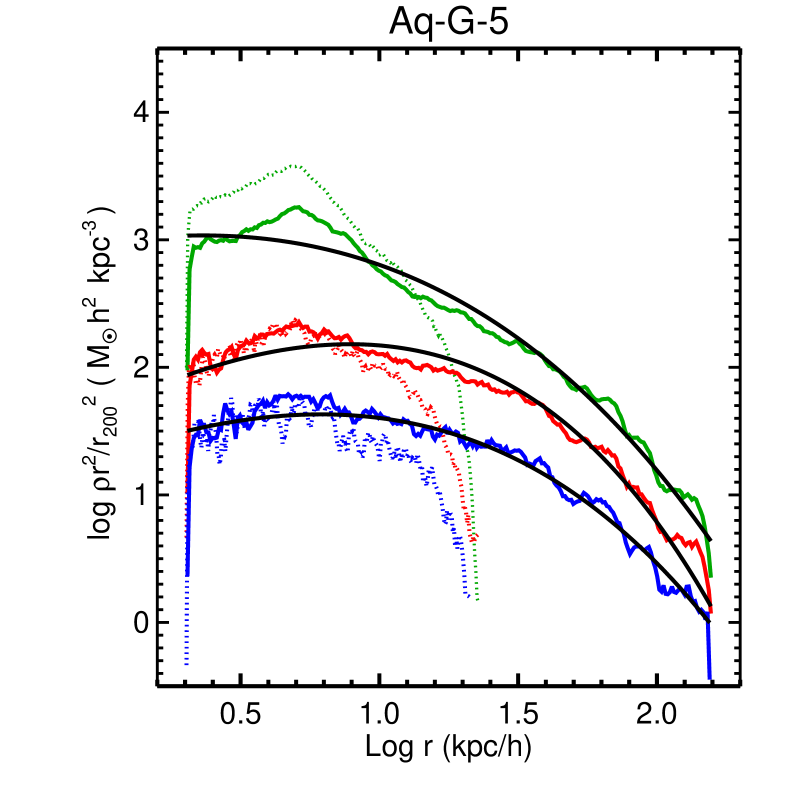
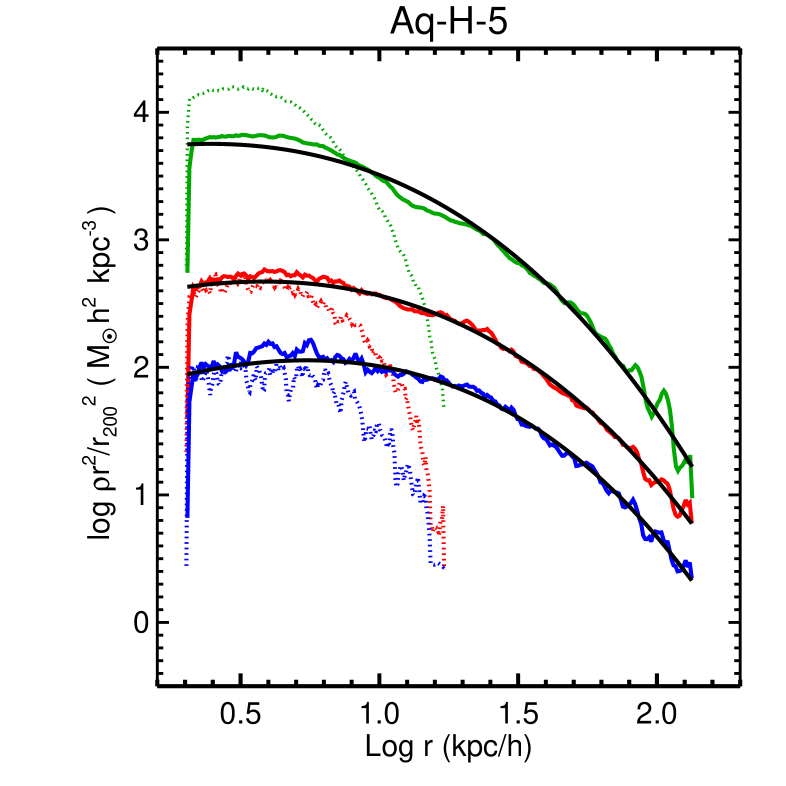
We fit Einasto profiles to the density distributions from kpc to the virial radius. The free parameters are , and which indicate the sharpness of the profiles and the radius and density where their logarithmic slope takes the isothermal value, respectively. The accreted stellar haloes are resolved with more than 100000 star particles while these numbers decrease as more stringent metallicity thresholds are imposed. The accreted EMPs are resolved by star particles.
In these simulated haloes, the density profiles determined by the accreted stars are well-fitted by the Einasto profile, regardless of the metallicity threshold adopted (Fig. 1; solid black lines). This is not the case for the whole stellar haloes because of the contribution of in situ stars which are more concentrated than accreted ones. However, the contribution of in situ stars to the EMPs is between per cent of the total EMP mass. And in fact, the Einasto profile also yields a good fit for the whole EMPs.
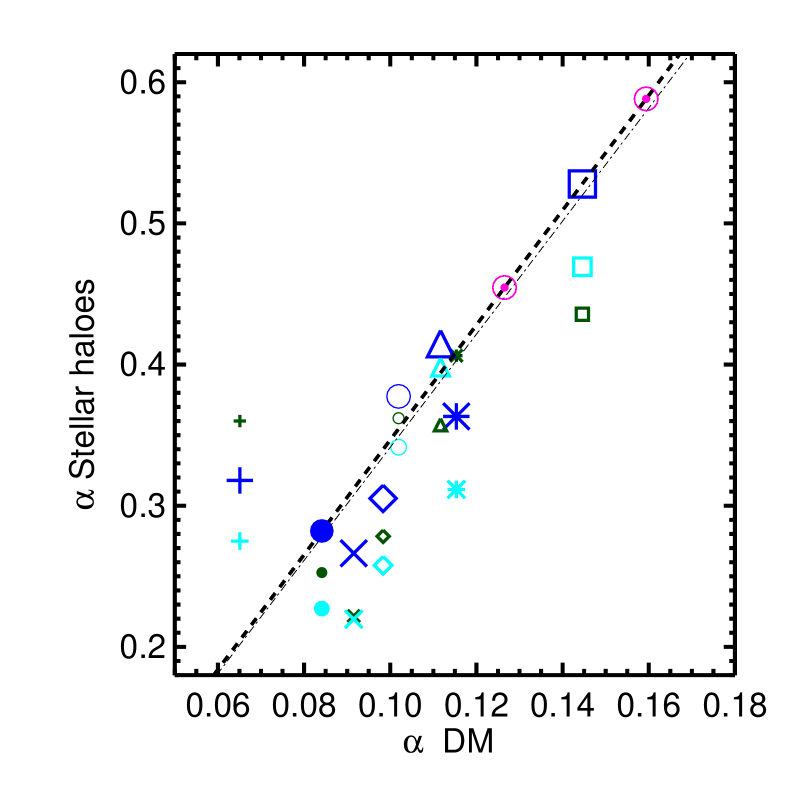
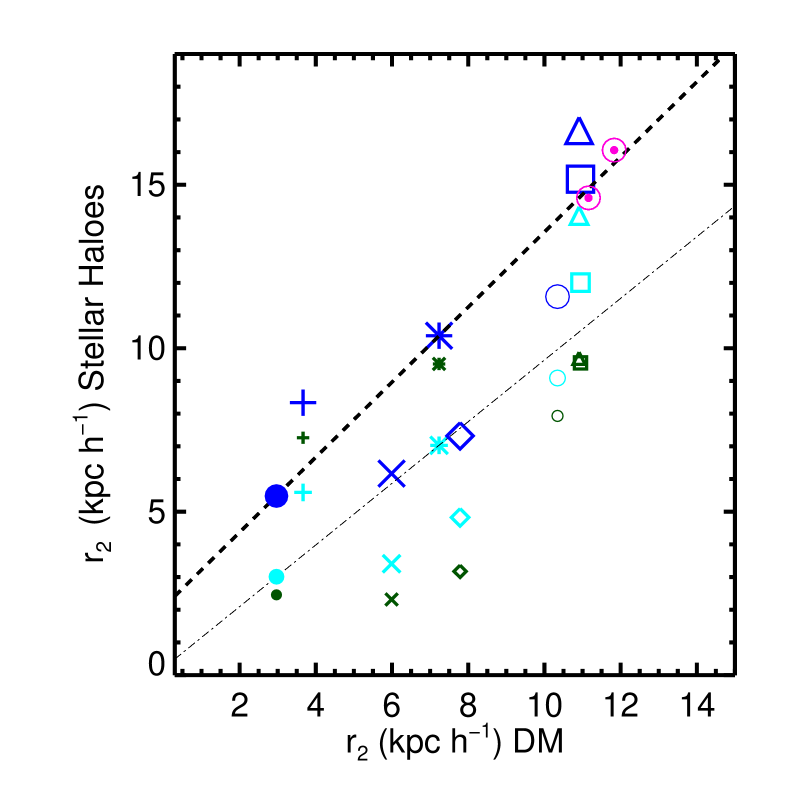
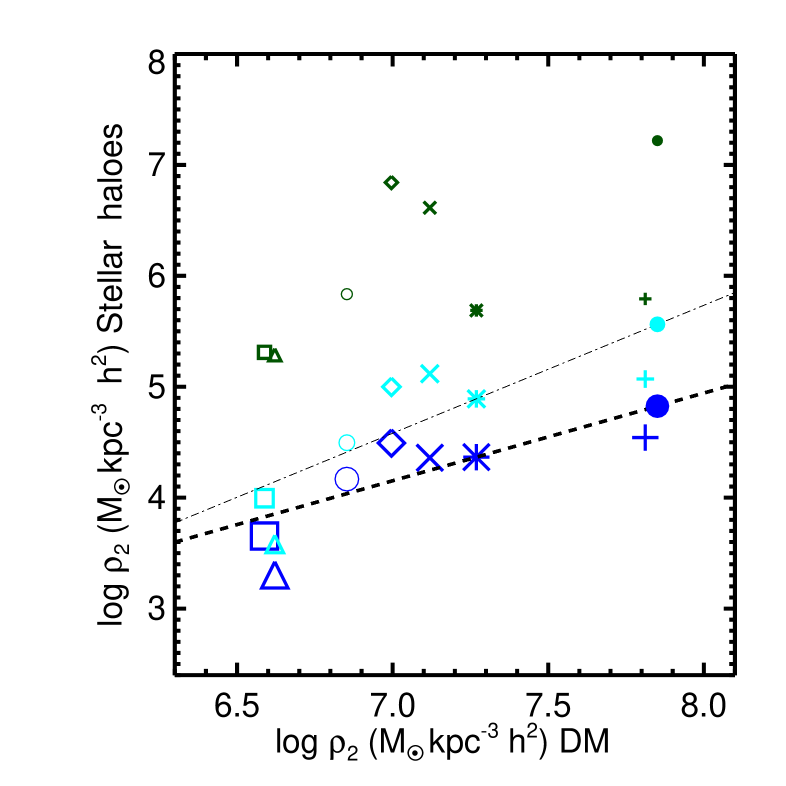
The DM profiles of these haloes were studied by Tissera et al. (2010), who found that they are well-fitted by Einasto profiles (in the same radial range). The final properties of the DM profiles are the outcome of the joint evolution with their main galaxy and consequently, they have been already modified by its formation. In order to explore at what extent the accreted stellar haloes can trace the DM ones, we correlate the Einasto fitting parameters for our metallicity-selected subsamples of accreted stars with those obtained for the corresponding DM profiles by Tissera et al. (2010). Statistically significant correlations for the , and parameters are measured, principally for the accreted and whole EMPs, which yield correlation factors within the range . These factors go down to for all accreted stars and VMPs. Hence, hereafter, we only analyse the EMPs. We fit linear regressions to the correlations defined by both EMP subsamples, by applying a Levenberg-Marquardt least-squares algorithm. In Fig. 2, we show the linear regressions determined by the accreted and whole EMPs. The found for the and linear fittings are smaller than but, for the characteristic scales, it is . For the whole EMP subsample, we also find an increase of a factor of four in the rms of .
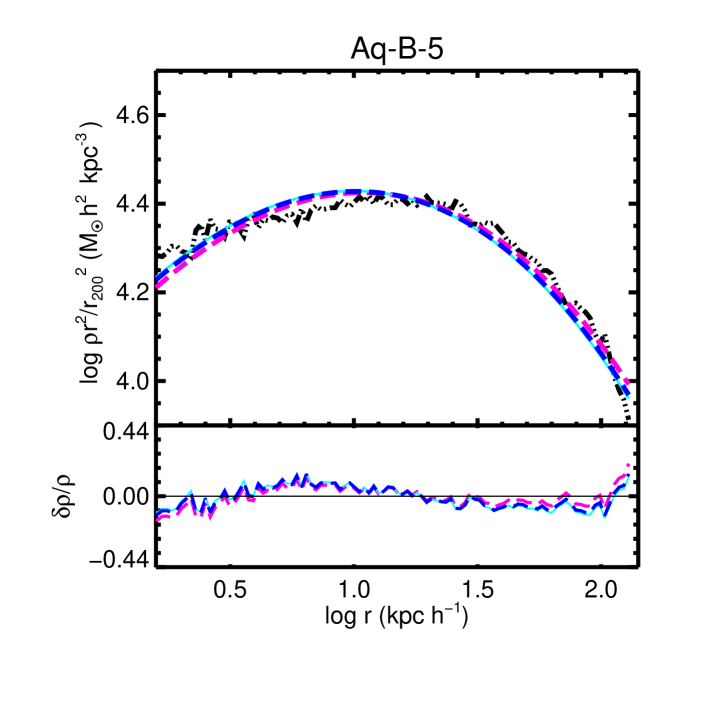
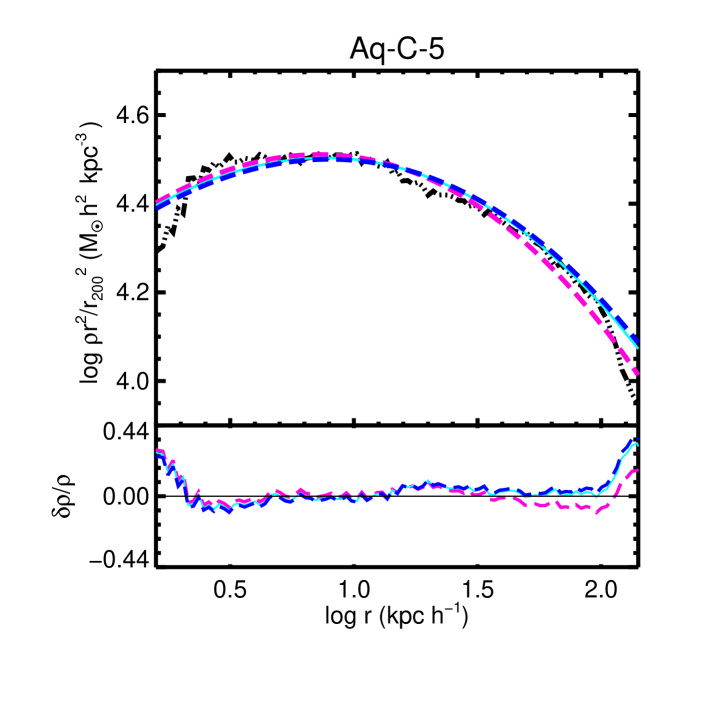
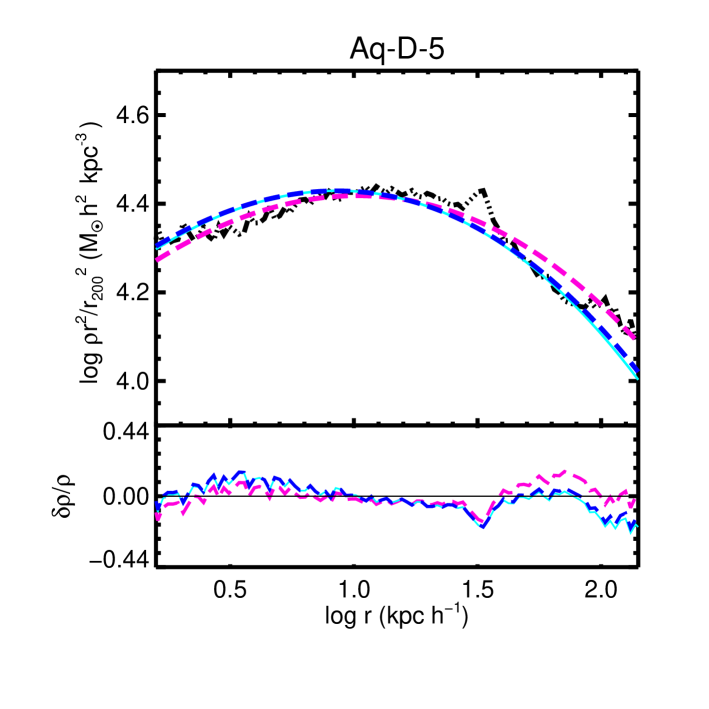
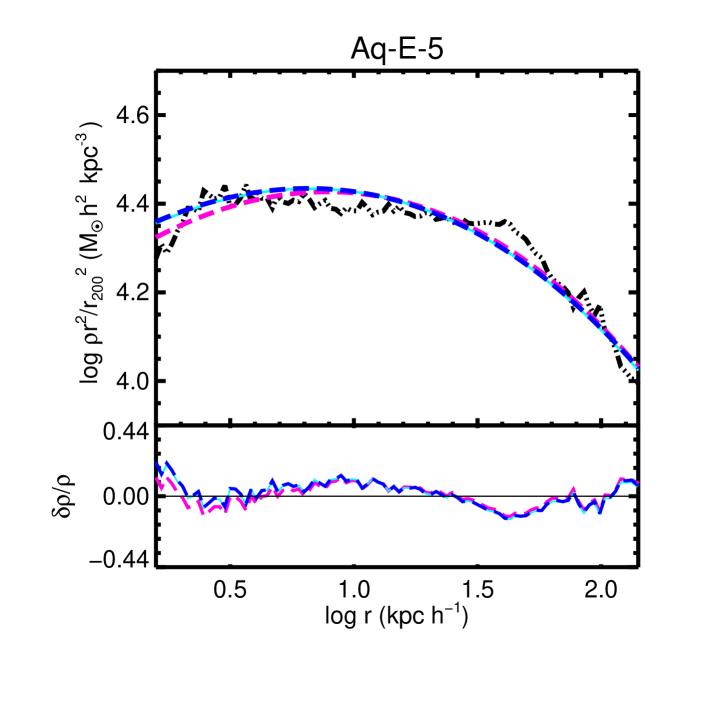
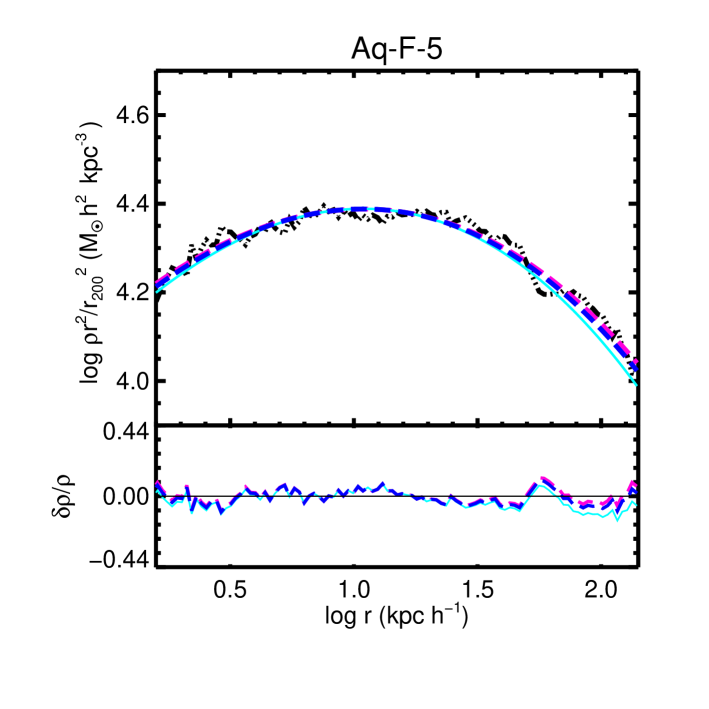
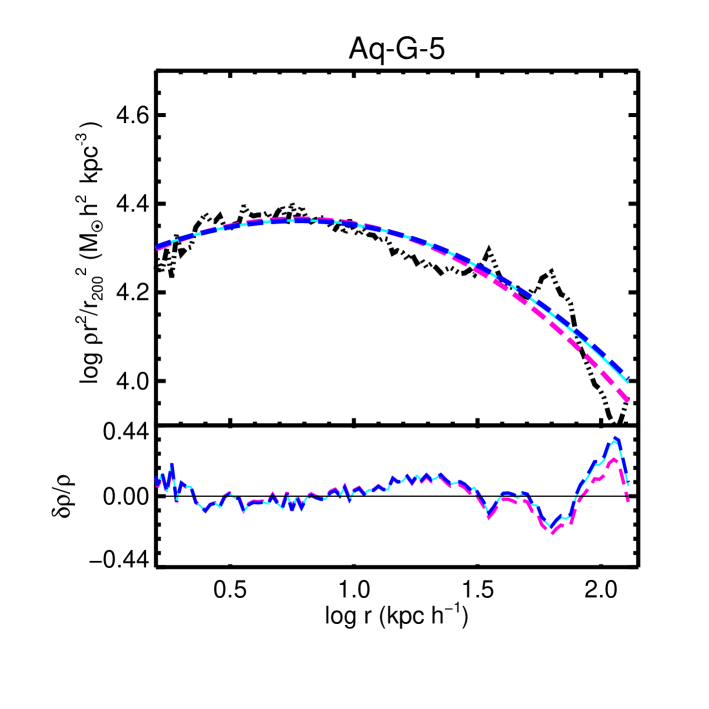
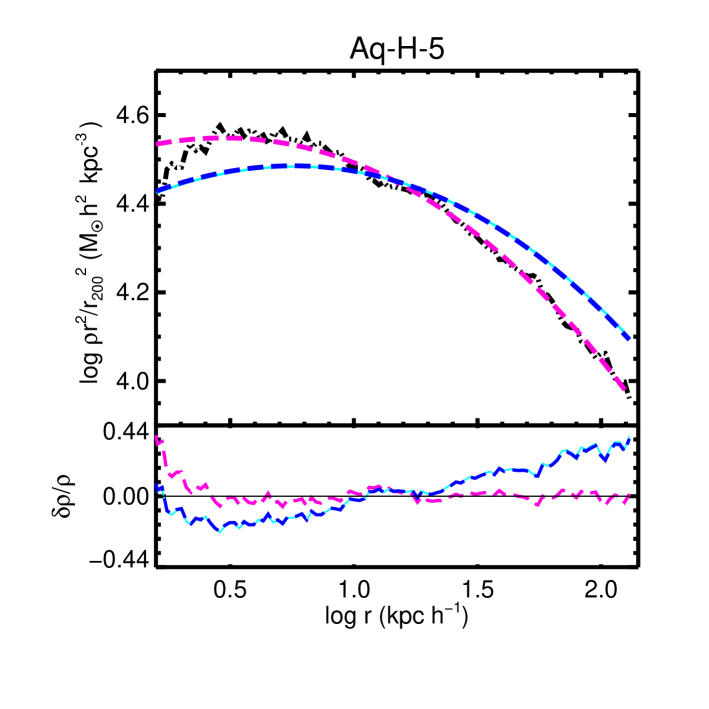
We use these correlations to estimate the DM density profiles by using the fitting parameters of the EMPs and the linear relations shown in Fig.2. Fig. 3 shows the predicted and simulated DM profiles, as well as the best-fitting Einasto DM profiles obtained directly from the simulated data. Although the shape of the DM profiles can be well estimated from those of the EMPs, the normalization is more difficult to predict without an independent estimation of, e.g., the total DM mass. For this reason, we renormalized the profiles so that the predicted and real DM profiles agree at . We could instead use our predicted DM profiles to infer the DM mass of the systems; in this case the DM mass is recovered with a dex dispersion. This large dispersion reflects the problem with the normalization of the predicted profiles, indicating the need to have an independent measure of the DM mass. The small panels of Fig.3 show the residuals of the DM profiles obtained by fitting the real data and those predicted by the EMPs to the simulated DM profiles. Except for Aq-A-5 and A-H-5, the galaxies with the largest in-situ fractions, the residuals are always smaller than ten per cent. These results show that the whole EMP subsample can also trace the shape of the dark matter profile. This is because it is dominated by accreted stars. We also tested the whole and accreted VMPs but in this case, there are larger dispersions and the predicted profiles are not always good.
The Einasto parameters obtained for the EMPs are in good agreement with those reported for the MW halo by Deason et al. (2011b) and Sesar et al. (2011): and kpc, respectively. Instead, the total accreted stellar haloes yield profiles slightly more concentrated (i.e. smaller ). This finding suggests that the MW halo might have been formed by a significant contribution of accreted stars from small satellites, with less than of in situ stellar mass. Under this assumption and using the reported observed values, our fitting relations predict the DM halo of the MW to have and kpc. Even more, from recent measures of the DM density in the solar neighborhood, we can normalize the simulated relation. The resulting MW predicted profile yields an enclosed DM mass at kpc of M⊙ or M⊙, if we assume M⊙ pc-3 (Read, 2014) or M⊙ pc-3 (Piffl et al., 2014), respectively. The agreement with the RAVE results by Piffl et al. (2014) are very encouraging. Detailed near future observations of the MW stellar halo will help us to further constrain our models and predictions.
4 Conclusions
We analysed the density profiles of the stellar populations in eight MW simulated galaxies and compared them with those of their dark matter haloes. We focused on low-metallicity stars since they map the whole potential well with a frequency increasing outwards. These stars tend to come in low-mass satellites and hence, did not experience dissipation within the host potential well.
The density profiles of accreted stars in the stellar haloes can be well-fitted by an Einasto profile. Similarly, the density profiles of accreted stars with systematically lower [Fe/H] abundances can all be well-fitted by Einasto profiles. This is not the case for the total stellar populations formed by in situ and accreted stars, since the former are much more concentrated, producing a total density profile which is best described by a broken power law.
The Einasto parameters obtained for the EMPs density profiles correlate well with the corresponing ones of the dark matter profiles (even if the in situ components are included, since they represent less than 20 per cent of the mass). The correlations get weaker as stars with higher metallicity are included. This can be understood since more metal-rich stars are contributed by more massive satellites and have more possibilities to have experienced dissipation and tend to be more centrally concentrated (Tissera et al., 2014). The obtained Einasto parameters for the EMPs are in good agreement with those reported for the MW stellar halo, suggesting that the later might have been formed principally by the accretion of low-mass satellites. If we adopt the observed values under this hypothesis, the simulated correlations for the EMPs predict and kpc for the DM profile of the MW. Assuming observed measures of the local DM density to normalize predicted DM profile at kpc yields an enclosed DM of M⊙, within this radius. These estimations are in agreement with results from the RAVE survey (Piffl et al., 2014), indicating the goodness of the predicted shape in this region.
Our findings suggest low-metallicity stellar haloes might store important information on the DM mass and the shape of DM profiles, helping to constrain the cosmological model and the details of galaxy formation models.
Acknowledgements
We thank the anonymous referee for his/her thoughtful comments. This work was partially funded by PIP 0305 (2009) and PICT Raices 959 (2011) of the Ministry of Science and Technology (Argentina) and ’Proyecto Interno’ from Universidad Andrés Bello. We acknowledge the support of Cosmocomp and Lacegal FP7 Marie Curie Networks.
References
- Beers et al. (2012) Beers T. C., Carollo D., Ivezić Ž., An D., Chiba M., Norris J. E., Freeman K. C., Lee Y. S., Munn J. A., Re Fiorentin P., Sivarani T., Wilhelm R., Yanny B., York D. G., 2012, ApJ, 746, 34
- Bullock & Johnston (2005) Bullock J. S., Johnston K. V., 2005, ApJ, 635, 931
- Carollo et al. (2007) Carollo D., Beers T. C., Lee Y. S., Chiba M., Norris J. E., Wilhelm R., Sivarani T., Marsteller B., Munn J. A., Bailer-Jones C. A. L., Fiorentin P. R., York D. G., 2007, Nature, 450, 1020
- Cooper et al. (2010) Cooper A. P., Cole S., Frenk C. S., White S. D. M., Helly J., Benson A. J., De Lucia G., Helmi A., Jenkins A., Navarro J. F., Springel V., Wang J., 2010, MNRAS, 406, 744
- Crnojević et al. (2013) Crnojević D., Ferguson A. M. N., Irwin M. J., Bernard E. J., Arimoto N., Jablonka P., Kobayashi C., 2013, MNRAS, 432, 832
- Deason et al. (2011a) Deason A. J., Belokurov V., Evans N. W., 2011a, MNRAS, 411, 1480
- Deason et al. (2011b) Deason A. J., Belokurov V., Evans N. W., 2011b, MNRAS, 416, 2903
- Eggen et al. (1962) Eggen O. J., Lynden-Bell D., Sandage A. R., 1962, ApJ, 136, 748
- Font et al. (2011) Font A. S., Benson A. J., Bower R. G., Frenk C. S., Cooper A., De Lucia G., Helly J. C., Helmi A., Li Y.-S., et al. 2011, MNRAS, 417, 1260
- Ibata et al. (2014) Ibata R. A., Lewis G. F., McConnachie A. W., Martin N. F., Irwin M. J., Ferguson A. M. N., Babul J., et al. 2014, ApJ, 780, 128
- Nissen & Schuster (2010) Nissen P. E., Schuster W. J., 2010, A&A, 511, L10
- Piffl et al. (2014) Piffl T., Binney J., McMillan P. J., Bienayme O., et al. 2014, ArXiv e-prints
- Pillepich et al. (2014) Pillepich A., Vogelsberger M., Deason A., Rodriguez-Gomez V., Genel S., Nelson D., Torrey P., Sales L. V., Marinacci F., et al. 2014, ArXiv e-prints
- Placco et al. (2014) Placco V. M., Frebel A., Beers T. C., Christlieb N., Lee Y. S., Kennedy C. R., Rossi S., Santucci R. M., 2014, ApJ, 781, 40
- Purcell et al. (2009) Purcell C. W., Kazantzidis S., Bullock J. S., 2009, ApJL, 694, L98
- Read (2014) Read J. I., 2014, Journal of Physics G Nuclear Physics, 41, 063101
- Rejkuba et al. (2011) Rejkuba M., Harris W. E., Greggio L., Harris G. L. H., 2011, A&A, 526, A123
- Sarajedini et al. (2012) Sarajedini A., Yang S.-C., Monachesi A., Lauer T. R., Trager S. C., 2012, MNRAS, 425, 1459
- Scannapieco et al. (2010) Scannapieco C., Gadotti D. A., Jonsson P., White S. D. M., 2010, ArXiv e-prints
- Scannapieco et al. (2005) Scannapieco C., Tissera P. B., White S. D. M., Springel V., 2005, MNRAS, 364, 552
- Scannapieco et al. (2006) Scannapieco C., Tissera P. B., White S. D. M., Springel V., 2006, MNRAS, 371, 1125
- Scannapieco et al. (2009) Scannapieco C., White S. D. M., Springel V., Tissera P. B., 2009, MNRAS, 396, 696
- Scannapieco et al. (2011) Scannapieco C., White S. D. M., Springel V., Tissera P. B., 2011, MNRAS, 417, 154
- Schönrich et al. (2014) Schönrich R., Asplund M., Casagrande L., 2014, ApJ, 786, 7
- Sesar et al. (2011) Sesar B., Jurić M., Ivezić Ž., 2011, ApJ, 731, 4
- Sheffield et al. (2012) Sheffield A. A., Majewski S. R., Johnston K. V., Cunha K., Smith V. V., Cheung A. M., Hampton C. M., David T. J., Wagner-Kaiser R., et al. 2012, ApJ, 761, 161
- Springel et al. (2008) Springel V., Wang J., Vogelsberger M., Ludlow A., Jenkins A., Helmi A., Navarro J. F., Frenk C. S., White S. D. M., 2008, MNRAS, 391, 1685
- Tissera et al. (2014) Tissera P. B., Beers T. C., Carollo D., Scannapieco C., 2014, MNRAS, 439, 3128
- Tissera et al. (2013) Tissera P. B., Scannapieco C., Beers T. C., Carollo D., 2013, MNRAS, 432, 3391
- Tissera et al. (2010) Tissera P. B., White S. D. M., Pedrosa S., Scannapieco C., 2010, MNRAS, 406, 922
- Tissera et al. (2012) Tissera P. B., White S. D. M., Scannapieco C., 2012, MNRAS, 420, 255
- Trujillo & Bakos (2013) Trujillo I., Bakos J., 2013, MNRAS, 431, 1121
- Zolotov et al. (2009) Zolotov A., Willman B., Brooks A. M., Governato F., Brook C. B., Hogg D. W., Quinn T., Stinson G., 2009, ApJ, 702, 1058