The bow shock, cold fronts and disintegrating cool core in the merging galaxy group RXJ0751.3+5012
Abstract
We present a new Chandra X-ray observation of the off-axis galaxy group merger RXJ0751.3+5012. The hot atmospheres of the two colliding groups appear highly distorted by the merger. The images reveal arc-like cold fronts around each group core, produced by the motion through the ambient medium, and the first detection of a group merger shock front. We detect a clear density and temperature jump associated with a bow shock of Mach number ahead of the northern group. Using galaxy redshifts and the shock velocity of , we estimate that the merger axis is only from the plane of the sky. From the projected group separation of , this corresponds to a time since closest approach of . The northern group hosts a dense, cool core with a ram pressure stripped tail of gas extending . The sheared sides of this tail appear distorted and broadened by Kelvin-Helmholtz instabilities. We use the presence of this substructure to place an upper limit on the magnetic field strength and, for Spitzer-like viscosity, show that the development of these structures is consistent with the critical perturbation length above which instabilities can grow in the intragroup medium. The northern group core also hosts a galaxy pair, UGC4052, with a surrounding IR and near-UV ring in diameter. The ring may have been produced by tidal stripping of a smaller galaxy by UGC4052 or it may be a collisional ring generated by a close encounter between the two large galaxies.
keywords:
X-rays: galaxies: clusters — galaxies: groups: RXJ0751.3+5012 — intergalactic medium1 Introduction
A large fraction of the baryons in the nearby Universe resides in galaxy groups with X-ray luminosities and temperatures (eg. Mulchaey et al. 1993; Ponman & Bertram 1993; Mulchaey 2000). Galaxy groups are much more representative hosts than rarer rich cluster systems (eg. Geller & Huchra 1983; Tully 1987) and important for understanding the gravitational and thermal evolution of most of the matter in the Universe. The effects of non-gravitational heating, such as supernova explosions, AGN feedback and merger shocks, are expected to be more pronounced in lower mass systems as the energy input from these sources is comparable to the binding energy of the group (eg. Ponman et al. 1996; Ponman et al. 1999; Helsdon & Ponman 2000). Major and minor group mergers, and their subsequent relaxation, govern the formation of the largest-scale structures and can have a substantial impact on their constituent galaxies. However, studies of galaxy group mergers have been limited due to their faint X-ray emission and low galaxy densities and richer cluster mergers have instead been the focus of attention (but see eg. Kraft et al. 2004, 2006; Machacek et al. 2010, 2011; Kraft et al. 2011).
Deep Chandra X-ray observations of the hot gas substructures generated by mergers have proved crucial to our understanding of the dynamics and thermal evolution. Narrow surface brightness edges are observed where the gas density drops across the discontinuity and the gas temperature increases so that the pressure is continuous (Markevitch et al. 2000; Vikhlinin et al. 2001a; Markevitch & Vikhlinin 2007). These ‘cold fronts’ mark the boundary of a cool, dense core of gas that is moving through the warmer ambient medium. The ram pressure experienced by the central gas peak in a major merger produces a sharp cold front along the leading interface of the dense core (eg. Vikhlinin et al. 2001a). Sloshing cold fronts can occur when a minor merger sets a dense core oscillating in the gravitational potential well (eg. Markevitch et al. 2001; Ascasibar & Markevitch 2006). Shock fronts are also expected in mergers but there are only a handful of detections in clusters with a clear density and temperature increase (eg. Markevitch et al. 2002, 2005; Russell et al. 2010; Macario et al. 2011). Shock front detections provide measurements of the gas bulk velocities in the plane of the sky and constrain the merger geometry. They are therefore key observational tools for studying the merger history (eg. Markevitch & Vikhlinin 2007). The detailed structure of cold fronts has also been used to study the relatively unknown transport processes in the hot atmospheres of groups. Observations of Kelvin-Helmholtz instabilities along cold fronts, or their absence, can provide a measure of the gas viscosity and magnetic field strength in the ICM (eg. Vikhlinin et al. 2001b; Roediger et al. 2011; ZuHone et al. 2011). The sharp temperature and density changes across cold fronts also suggests that thermal conduction and diffusion are strongly suppressed (eg. Ettori & Fabian 2000; Vikhlinin et al. 2001a).
X-ray observations with ROSAT and XMM-Newton of the nearby system RXJ0751.3+5012 (; Ebeling et al. 1998; Watson et al. 2009) revealed two large galaxy groups with disturbed morphologies, which are in the process of merging. The archival XMM-Newton observation showed surface brightness edges around the two groups, each across, and a long tail of stripped material extending behind the northern group core. The northern group core hosts luminous optical line emission, star formation and a striking IR bright ring of emission surrounding the two central group galaxies (Quillen et al. 2008; O’Dea et al. 2008). Here we present a new deep Chandra observation of the off-axis group merger RXJ0751.3+5012 studying cold front and shock front structure, ram pressure stripping and turbulent mixing in detail in the intragroup medium. In Section 2 we present the imaging and spectroscopic analysis of the Chandra data and identify several surface brightness edges associated with cold fronts and a bow shock. The structure of the bow shock is analysed in Section 3 and the Mach number is calculated. In Sections 4 and 5 we discuss the formation of turbulent instabilities around the NE group core and ram pressure stripped tail and determine an upper limit on the magnetic field strength. Finally, in Section 6 we show the detection of additional extended emission in the ACIS-I field of view likely corresponding to the galaxy cluster WHL J075052.4+500252 at .
We assume , and , translating to a scale of per arcsec at the redshift of RXJ0751.3+5012. All errors are unless otherwise noted.
2 Chandra data analysis
2.1 Data reduction
RXJ0751.3+5012 was observed with the Chandra ACIS-I detector for a single exposure on 14 May 2013 (ID 15170). There is also an archival ACIS-I observation of taken on 8 January 2011 (ID 12811) but this contributed few extended source counts and was therefore not included in the analysis. The new observation was reprocessed with CIAO 4.5 and CALDB 4.5.9 provided by the Chandra X-ray Center (CXC). The level 1 event file was reprocessed to apply the latest gain and charge transfer inefficiency correction and then filtered to remove any photons detected with bad grades. The observation was telemetred in VFAINT mode which provided improved background screening. A background light curve was extracted from a source free region on chip 0 and filtered with the lc_clean111See http://cxc.harvard.edu/contrib/maxim/acisbg/ script to identify periods in the observation affected by flares. There was a short flare towards the end of the observation reducing the final cleaned exposure to .
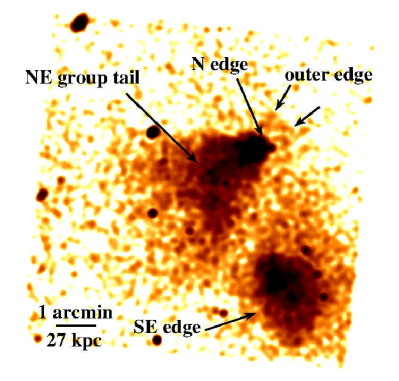
Fig. 1 (left) shows an exposure-corrected image of RXJ0751.3+5012 covering the energy band. The raw image was corrected for exposure variation by dividing by a spectrum-weighted exposure map. Point sources were identified with wavdetect (Freeman et al. 2002), confirmed visually and excluded from the analysis. The background was subtracted from images and spectra using the appropriate blank-sky background observations. Standard blank-sky backgrounds were processed identically to the events file, reprojected to the corresponding sky position and normalized to match the count rate in the energy range. The normalized blank-sky background spectrum for a source-free region of ACIS-S2 was compared to the observed background spectrum and found to be a close match over the whole energy range.
2.2 Imaging analysis
The Chandra observation of RXJ0751.3+5012 reveals an off-axis collision between two galaxy groups, where the north-eastern (NE) group has recently passed to the north of the primary, south-western (SW) group (Fig. 1 left). Ram pressure generated by the motion through the ambient medium is stripping material from the bright, dense core in the NE group. The tail of stripped material extends () and there is a trail of soft X-ray gas blobs behind the core that appears to curve towards the SW group. There is a sharp drop in surface brightness around the N edge of the NE group core and this is likely to be a cold front marking the leading edge of the core. There is potentially a second, outer surface brightness edge () ahead of the NE group core (shown by arrows). The SW group appears more diffuse with a longer () surface brightness drop around its SE and N edges. This edge has a ‘boxy’ morphology similar to that found in A496 (Dupke & White 2003; Dupke et al. 2007). This edge is likely disrupted by the passage of the NE group and interacting with the ram pressure stripped tail, which could explain the appearance of substructure around this interface.
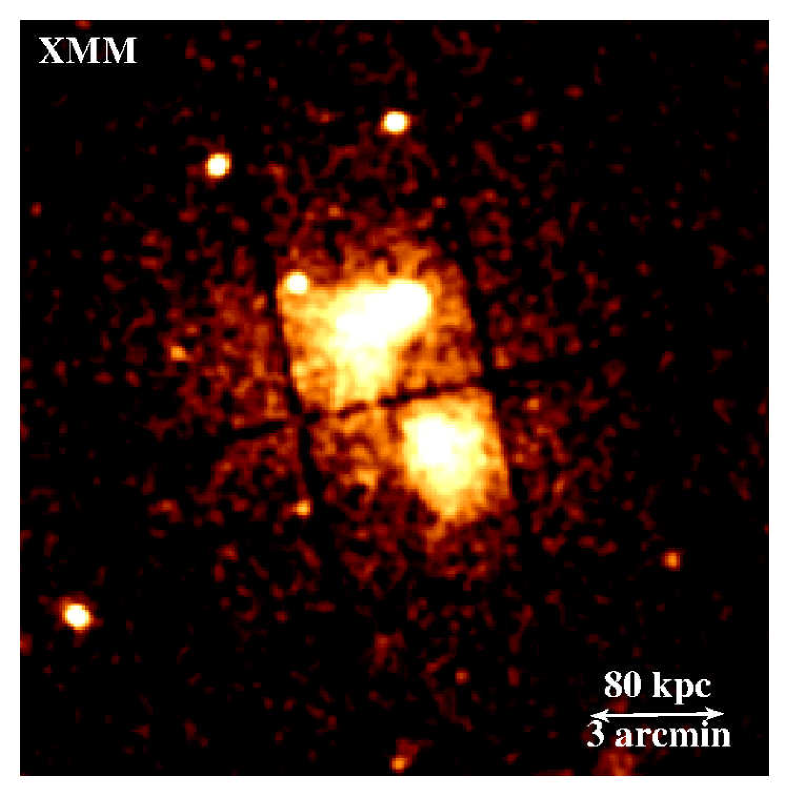
Fig. 2 shows the merged MOS and PN image from the archival XMM-Newton observation (obs. ID 0151270201). The broad structure is consistent with two clear surface brightness peaks associated with the two groups and surface brightness edges around each core. This image also reveals the larger scale hot atmosphere that the two group cores are moving through and clear diffuse emission ahead of the NE group. The ram pressure generated by the motion of the core through the hot ambient medium is sufficient to strip the outer gas layers from the NE group producing the observed long tail of debris. Similar structures have been observed behind dense, cool cores in major cluster mergers and in the Virgo cluster, where long plumes of gas extend behind infalling galaxies that are strongly interacting with the intracluster medium (eg. Forman et al. 1979; Nulsen 1982; Randall et al. 2008; Sun et al. 2010; Million et al. 2010; Kraft et al. 2011; Russell et al. 2012).
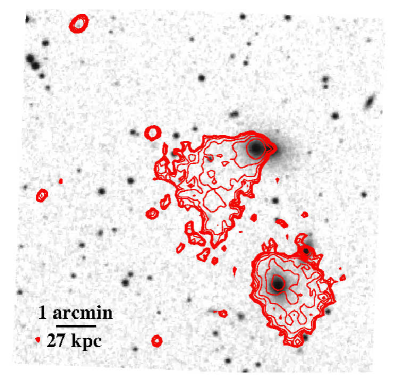
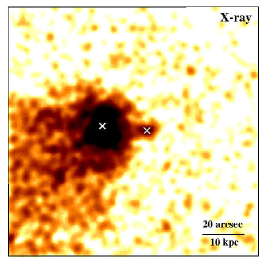
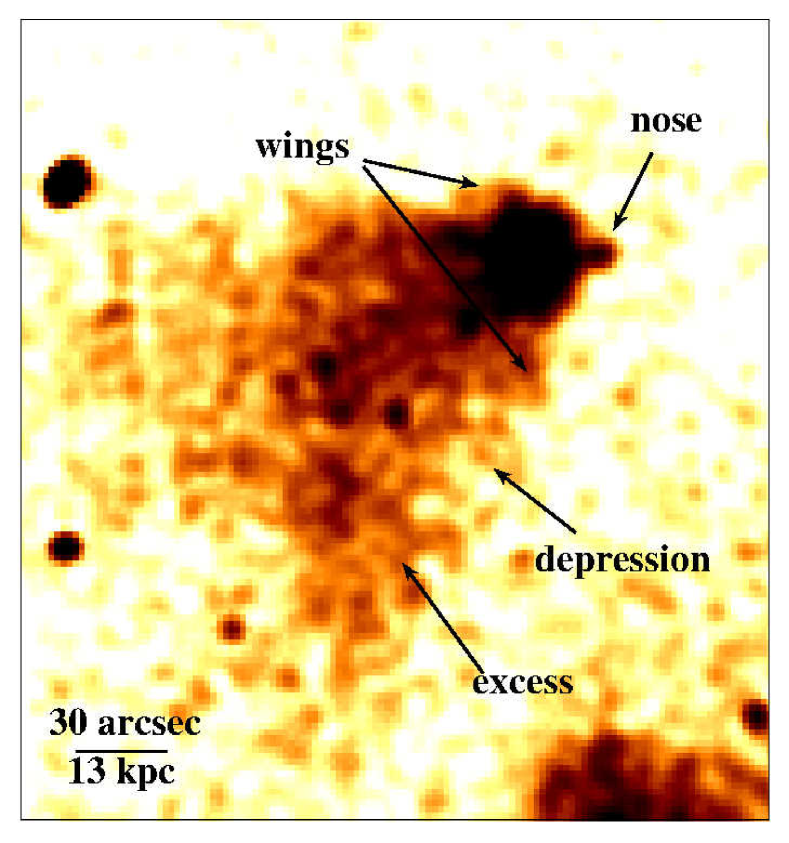
The DSS optical image (Fig. 1 right) shows the distribution of galaxies associated with the two groups. The NE group core hosts a pair of large elliptical galaxies (UGC4052) separated by a projected distance of only (Crawford et al. 1999). The eastern galaxy of the pair, UGC4052 E, is coincident with the X-ray surface brightness peak in the core and hosts luminous H line emission (, Crawford et al. 1999). UGC4052 W is located ahead of the NE group core and appears associated with a small spur of X-ray emission or ‘nose’ extending (; Fig. 3 upper left). Another large elliptical galaxy (UGC4051) is coincident with the X-ray surface brightness peak in the SW group. The redshifts for these three large ellipticals from Crawford et al. (1999) show that these galaxies are associated with the two merging groups and not a chance superposition along the line of sight. There is a hard X-ray point source spatially coincident with UGC4051 in the SW group, which could indicate an AGN. The VLA FIRST survey does not show a radio point source coincident with this source (Becker et al. 1995). There is a radio point source spatially coincident with UGC4052 E in the NE group. Although there does not appear to be a hard X-ray point source associated with the radio point source, this could be simply too faint to detect in the existing data.
The ram pressure stripped tail behind the NE group core shows irregular structures or ‘wings’ (Fig. 4; Machacek et al. 2006; Kraft et al. 2011; Roediger et al. 2012a, b). The northern wing contains counts and the southern wing contains counts, which corresponds to above the surrounding ambient level for each structure. Distortions in cold fronts can be generated by the shear flow around them, which produces Kelvin-Helmholtz instabilities. The shear flow is expected to be maximum along the sides of the NE group tail, which explains the contrast between the narrow N edge of the cold front and the distorted structure at larger angles to the direction of motion. Non-viscous hydrodynamical simulations of cold fronts in the intracluster medium commonly show the development of these instabilities (eg. Murray et al. 1993; Heinz et al. 2003; ZuHone et al. 2010; Roediger et al. 2011) and can reproduce the structure of distortions in observed cold fronts (eg. Roediger et al. 2012b, a). There is also an arc-like surface brightness excess and depression indicative of a hydrodynamical instability along the S side of the tail (see section 2.3, eg. Mazzotta et al. 2002; Roediger et al. 2013).
The ‘nose’ ahead of the NE group contains counts and is detected at more than above the ambient medium. This structure is more likely due to ram pressure stripping of an X-ray corona than a turbulent distortion of the cold front (Fig. 3 upper left; Sun et al. 2005; Sun et al. 2005). The N surface brightness edge appears very narrow and smooth on either side of this structure, rather than turbulent, and the ‘nose’ is spatially coincidence with a large elliptical galaxy, which is a likely host for an X-ray corona (Forman et al. 1985; Vikhlinin et al. 2001; Sun et al. 2007). We discuss these structures in more detail in Sections 4 and 5.
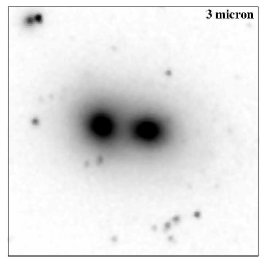
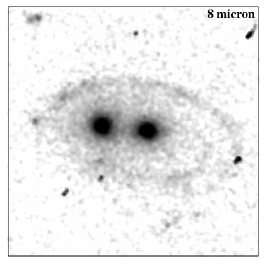
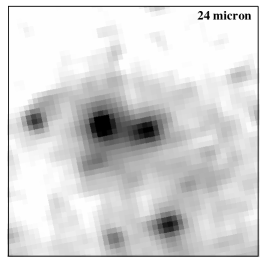
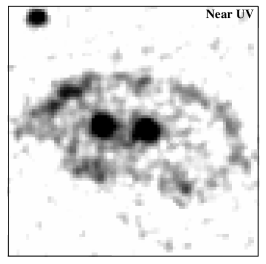
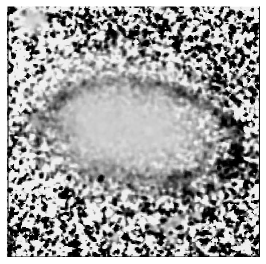
UGC4052 was included in the Quillen et al. (2008) Spitzer study of the mid-IR emission from the central galaxies in groups and clusters with optical emission lines. Quillen et al. (2008) found that UGC4052 E has excess IR emission above that expected for a quiescent elliptical galaxy, which is likely due to hot dust powered by star formation. O’Dea et al. (2008) estimated a star formation rate for this galaxy from the IR luminosity of . The Spitzer image (Fig. 3 upper right) shows a striking bright oval ring of emission surrounding both galaxies with a diameter of (). This feature is seen primarily at , which is likely due to a polycyclic aromatic hydrocarbon (PAH) emission feature at , but is also seen faintly at and in GALEX near-UV observations (Fig. 3 lower left and centre). The ring appears broken in places to the east and west and contains several knots of enhanced emission.
2.3 Radial profiles
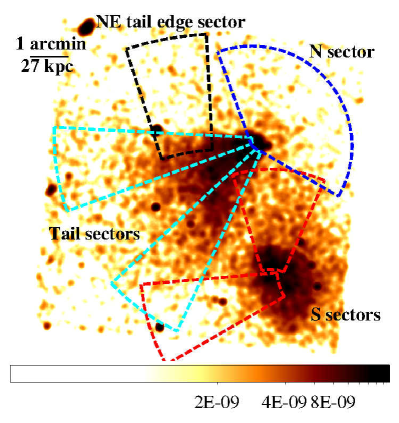
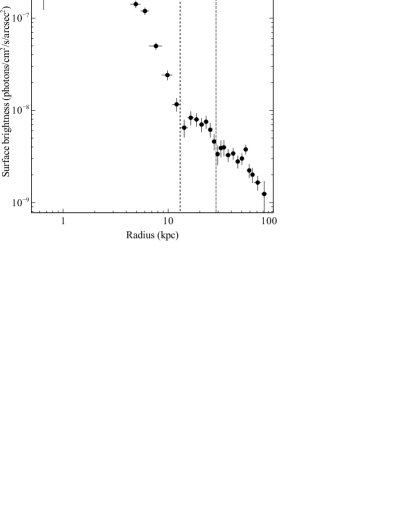
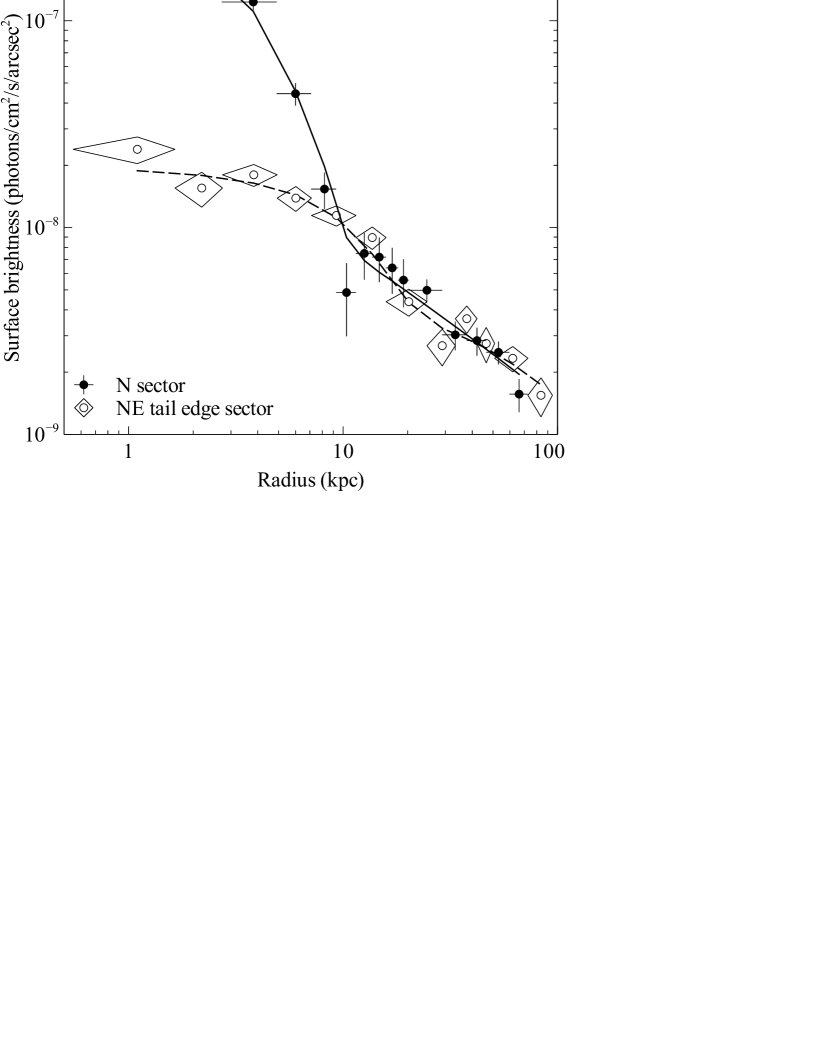
We extracted projected surface brightness profiles across the edges identified in Section 2.2 and through the ram pressure stripped NE group tail. Fig. 5 (upper left) shows the regions selected, where the centre of each sector was selected to coincide with the centre of curvature of the surface brightness edges. Radial bins were in width for the bright, core regions and increased in width at larger radii to ensure a minimum of 30 source counts per spatial bin. The surface brightness profile for the N sector (Fig. 5 upper right) shows the clear N edge at where the surface brightness drops by a factor of over a radial distance of across the leading edge of the NE group core. The N sector includes the ‘nose’ structure, which broadens the edge. The outer surface brightness edge tentatively identified in Fig. 1 is clearly detected as a drop by a factor of at a radius of . The location of this edge ahead of the NE group core suggests it could be a bow shock. In Section 2.4, we extract the temperature profiles across these edges to determine if there is a corresponding temperature jump.
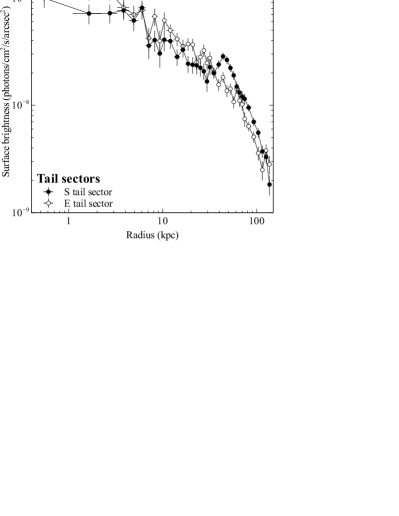
Fig. 5 (lower left) shows surface brightness profiles through the ram pressure stripped tail of the NE group. The S and E tail sectors show a similar decline in surface brightness with radius. However, there is a clear excess in the S tail sector from to radius, which corresponds to the excess surface brightness identified in Fig. 4. This surface brightness excess is preceded by a region of reduced surface brightness, by comparison with the E sector, from to radius. The profiles confirm that these are significant structures and could correspond to a dynamical instability resulting from the merger. The location of this feature appears similar to that of the large instability identified in the merging cluster A3667 (Mazzotta et al. 2002; see also Roediger et al. 2013) and we discuss this further in Section 5.
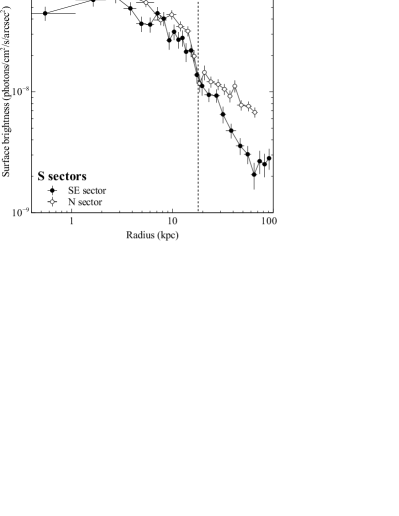
The surface brightness profiles across the edge around the SW group core are shown in Fig. 5 (lower right). The surface brightness drops by a factor of at a radius of in both of the sectors analysed and the edge appears consistently narrow for around the N and SE sides of the core. However, this analysis was limited due to the overlap with the ram pressure stripped material from the NE group core and the low number of counts did not allow us to place a strong upper limit on the width.
2.4 Spatially resolved spectroscopy
The total spectrum for each group was extracted from a circular region centred on each X-ray peak with a radius of , which contained the bulk of the emission and excluded point sources. A corresponding background spectrum was extracted from the normalized blank sky dataset and appropriate responses and ancillary responses were generated. Each spectrum was restricted to the energy range with a minimum of 20 counts per spectral channel. The spectra were fitted in xspec 12.8 (Arnaud 1996) with an absorbed single temperature apec model version 2.0.2 (Smith et al. 2001). The cluster redshift was fixed to (Ebeling et al. 1998; Crawford et al. 1999) and abundances were measured assuming the abundance ratios of Anders & Grevesse (1989). The temperature, metallicity and normalization parameters were left free.
The absorbing column density was determined using the spectrum extracted from the region covering the SW group, which excluded the cooler gas components in the NE group core and tail. The absorption parameter was left free and the best-fit value was . This is a little higher than the Galactic absorption found in HI surveys (Kalberla et al. 2005) but a similar analysis for the earlier Chandra observation also indicates absorption above the Galactic value. We therefore fixed the absorption parameter to this best-fit value for all other spectral fits.
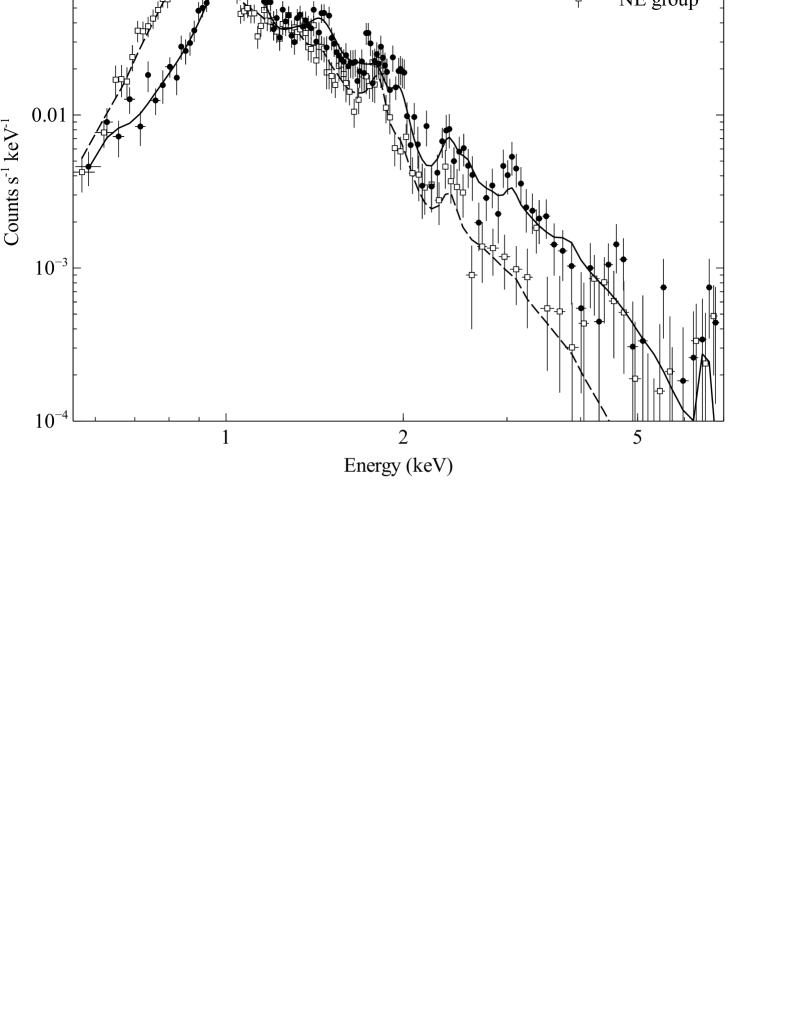
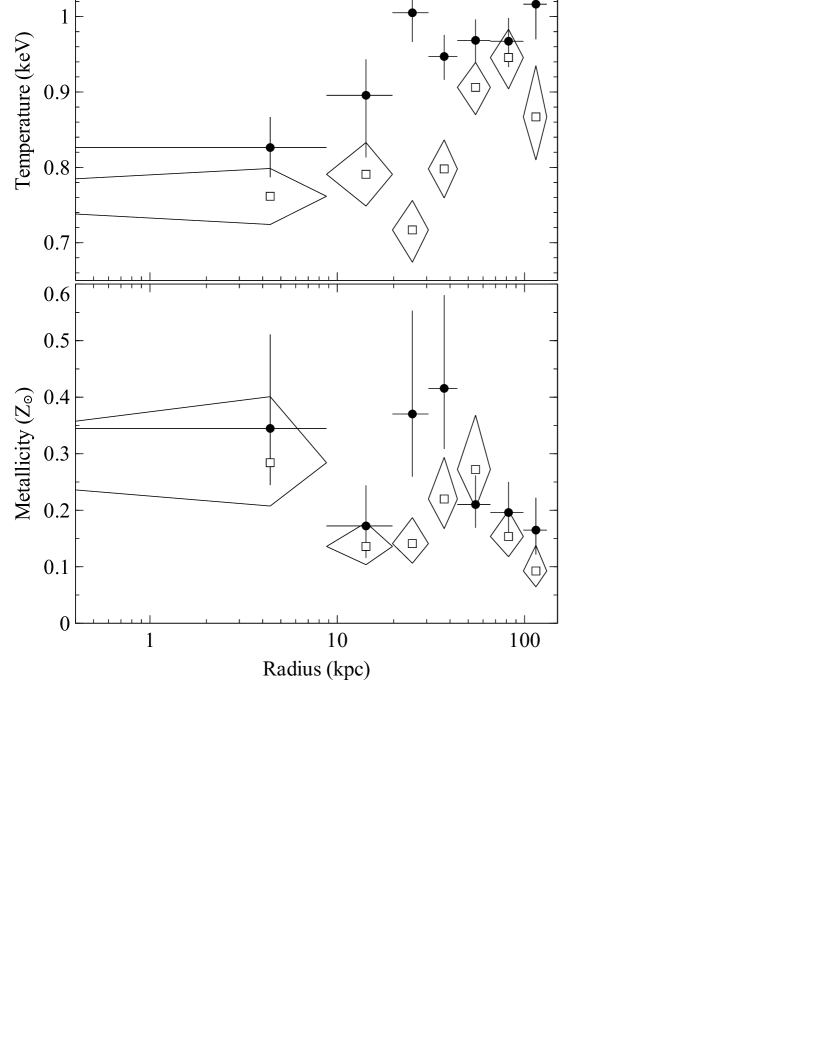
The total spectrum for each group is quite different (Fig. 6). The SW group has a global temperature of and a metallicity of . The NE group is much cooler and metal-poor with a temperature of and a metallicity of . We also used a two temperature spectral model to determine if the lower metallicity in the NE group was a result of the Fe bias at low temperatures (Buote 2000). However, the single temperature model was found to be a good fit to both total spectra and we did not find any significant additional temperature component in either galaxy group. This observed difference in metallicity follows the trend of higher metal abundances in the central regions of higher temperature groups (eg. Rasmussen & Ponman 2009). We repeated the single temperature spectral fits leaving the redshift parameter free and obtained values of and for the SW and the NE groups, respectively. Although this is not a significant difference, these results are consistent with the galaxy redshifts for UGC4051 in the SW group and and for UGC4052 E and W, respectively (Crawford et al. 1999). From the global temperature of each group and the mass-temperature relation (eg. Finoguenov et al. 2001; Sanderson et al. 2003; Vikhlinin et al. 2006), we estimate that the SW group is roughly three times more massive than the NE group. The global temperature of the NE group is likely to have been underestimated as ram pressure stripping has removed most of the warmer, lower density gas. However, adiabatic compression due to the ram pressure and static pressure of the larger group will counteract this to some extent. The mass ratio is therefore likely to be an upper limit.
Maps of the projected gas properties were produced using the Contour Binning algorithm (Sanders 2006), which generates spatial bins that closely follow the X-ray surface brightness. For the temperature, normalization and pressure maps, regions were selected to provide a signal-to-noise ratio of 22 ( counts). Larger regions with a signal-to-noise ratio of 32 were used for the metallicity map. The maps are covering the two groups. The length of the spatial regions was constrained to be at most twice their width. For each region, a spectrum was extracted from the Chandra dataset and restricted to the energy range . A corresponding background spectrum was extracted from the normalized blank sky dataset and appropriate responses and ancillary responses were generated. An absorbed single temperature apec model was fitted to each spectrum with the temperature and normalization parameters left free and minimising the C-statistic (Cash 1979). The metallicity was fixed to for the temperature, normalization and pressure maps that were produced with fewer counts per spatial region.
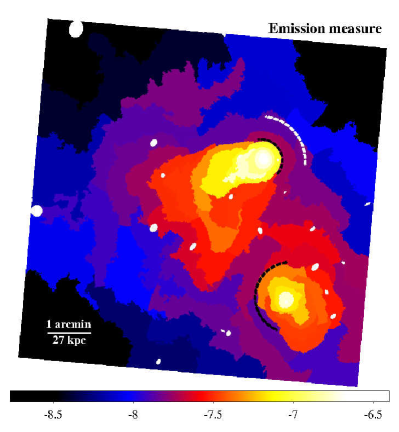
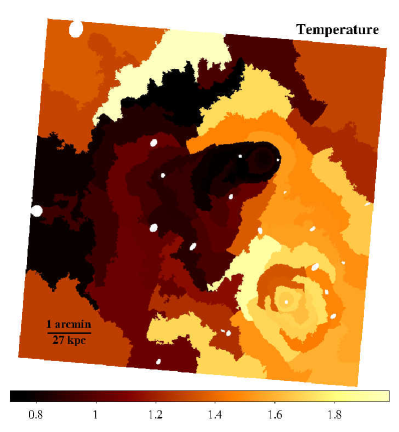
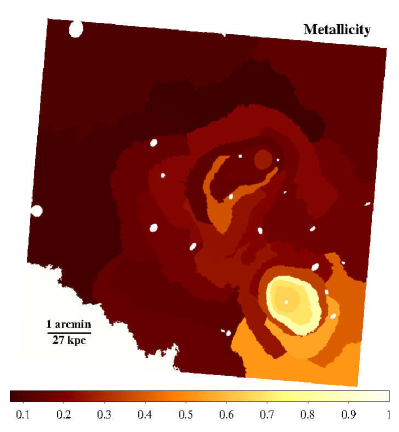
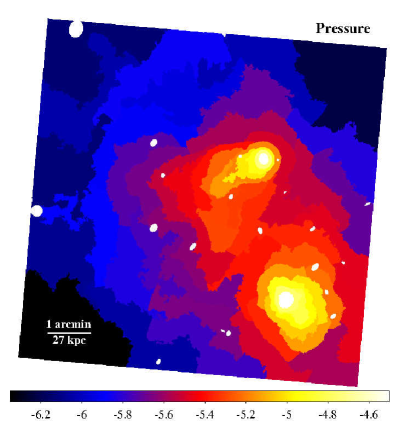
Fig. 7 shows detailed maps of the best-fit values for the projected emission measure per unit area, temperature and metallicity. The projected emission measure traces the square of the gas density in the group. The projected ‘pressure’ map was produced by multiplying the temperature map and the square root of the normalization per unit area map. The uncertainty in the normalization and temperature values at the centre of each group are and , respectively. The temperature is below here and Fe L line emission provides a good temperature diagnostic. At large radii, the uncertainty increases to for the temperature and for the normalization. The uncertainty in the metallicity values is .
There is a clear peak in the emission measure at the centre of each of the groups. The surface brightness drops to the NW of the NE group and along the SE edge of the SW group can be seen in the emission measure map. The emission measure declines smoothly through the tail of ram pressure stripped material behind the NE group core. The trail of densest gas in the tail appears to bend towards the S approximately () behind the core. At this point the tail also appears to flare out rapidly, increasing in width from () to at least (). There is a region of increased emission measure to the N of the SW group core suggesting there could be some ram pressure stripping. However, the SW group core does not appear strongly disrupted by the collision, which is on the borderline between a major and minor merger.
The temperature map shows that the temperature in the NE group drops below in the dense core. The S group is much hotter, peaking at and the temperature increases across the surface brightness edge from to , indicative of a cold front. The ‘boxy’ morphology of the cold front, similar to A496 (Dupke & White 2003; Dupke et al. 2007), and the lack of strong disruption to the SW group suggests that this is a young sloshing cold front. The merger has displaced the hot atmosphere in the gravitational potential minimum and it is now starting to oscillate, producing the observed cold fronts (eg. Markevitch & Vikhlinin 2007). Roediger et al. (2012b) found that the boxy structure in A496 arises due to the development of Kelvin-Helmholtz instabilities along cold fronts. The cold front appears strongest around the N edge of the SW group core where the outer hot atmospheres of each group are colliding. The entropy of the gas in this region appears comparable to that located to the SE of the SW group core suggesting that the gas has been compressed here by the collision between the two groups.
There is also a cold front around the leading edge of the NE group where the temperature increases much more steeply from to . The temperature increases through the ram pressure stripped tail with the gas along the S edge warmer than that along the NE edge. The NE edge of the tail appears much narrower, suggesting that there is much less mixing with the hotter, ambient medium, consistent with the more gradual increase in temperature. The outer surface brightness edge ahead of the NE group core appears coincident with a temperature drop from to . This could therefore be a bow shock and we analyse this structure in detail in Section 3.
The SW group has a strong, central metallicity peak of . The NE group appears metal-poor by comparison with a peak of only in the dense core. The metallicity is lowest at for () behind the NE group core and then shows a modest increase, particularly towards the S tail edge where there is likely to be mixing with metal-rich material stripped from the SW group. The projected ‘pressure’ map shows the extent of the shock heating between the trajectory of the two groups. There is also a decrease in pressure ahead of the NE group core consistent with a bow shock.
2.5 Hardness Ratio
Although there are too few counts to produce a spectrum for the NE group ‘nose’, we have produced a hardness ratio profile across this region to look for evidence of temperature variations. We have used the Bayesian method of calculating hardness ratios detailed by Park et al. (2006), which is particularly useful for the low counts regime. The hardness ratio was calculated as the fractional difference between the number of counts in the soft () and hard () energy bands,
| (1) |
The source counts in each energy band were extracted from a series of regions covering a narrow sector across the two galaxies. The blank sky background counts were also modelled as independent Poisson random variables.
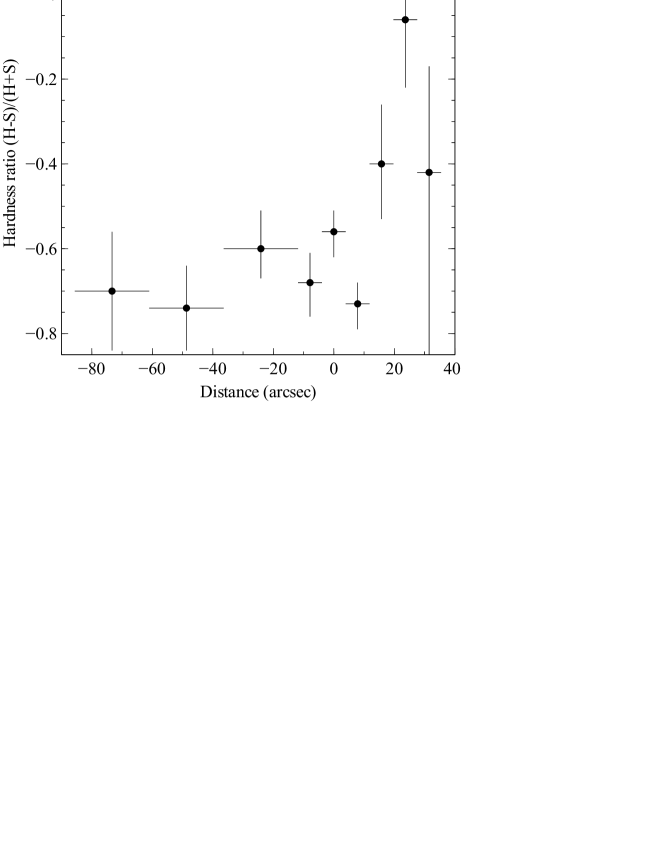
Fig. 8 shows that the hardness ratio is roughly constant at through the NE group cool core then appears to increase at the location of the ‘nose’ where the W galaxy is located. However, there are large uncertainties on the individual values. This could indicate a few keV temperature increase in the ‘nose’ caused by heating from the surrounding postshock gas. Alternatively, there could be a hard X-ray point source at the W galaxy centre consistent with an AGN. Although the FIRST survey does not show a radio point source coincident with the W galaxy (Becker et al. 1995), there also does not appear to be radio emission associated with the hard X-ray point source at the centre of the SW group. The increase in hardness ratio appears to extend over several neighbouring regions, which suggests a temperature increase rather than a compact point source.
3 Bow shock detection
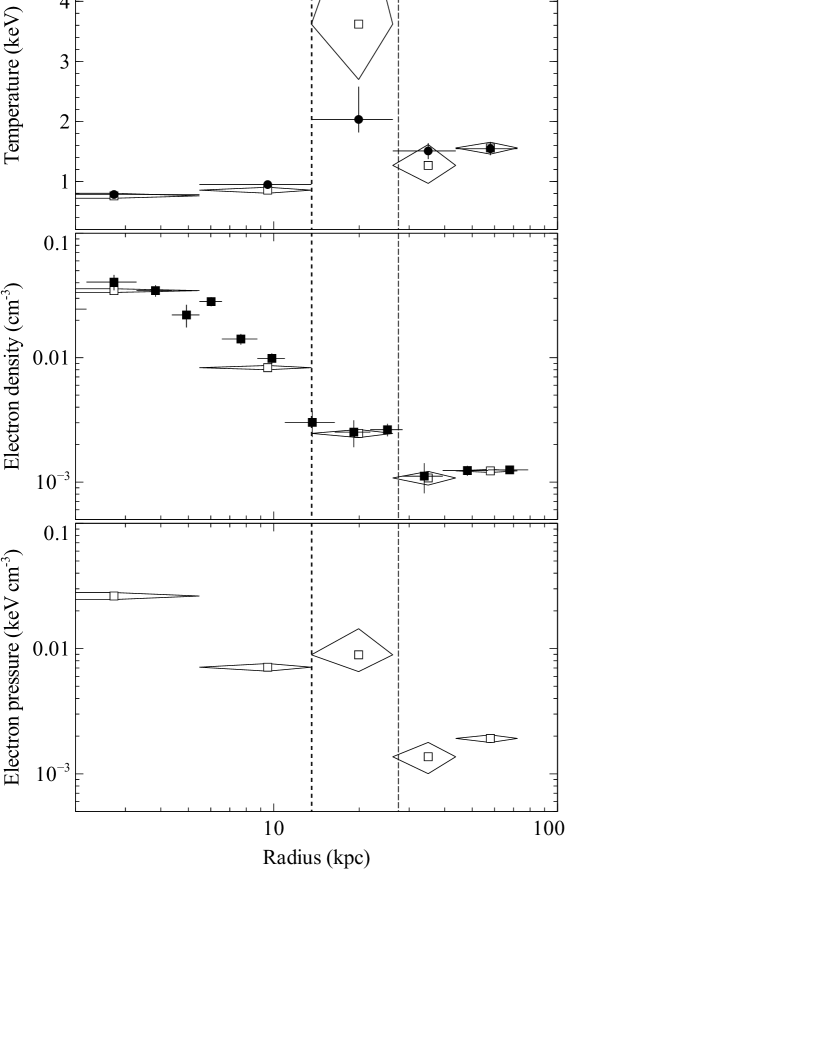
Fig. 5 (upper left) shows the N sector selected for the analysis of the possible bow shock ahead of the NE group. The sector was positioned to align with the curvature of this outer surface brightness edge and covers the angular range over which the edge is clearly defined. This sector was divided into 5 radial bins that were positioned to determine the gas properties on either side of the surface brightness edges with a minimum of 300 source counts per region. Spectra extracted from these regions were each fitted with an absorbed single temperature apec model, as detailed in Section 2.4. The metallicity was fixed to the average of found for the N sector (Fig. 7). The projected temperature profile for the N sector is shown in Fig. 9. The two central temperature bins at cover the NE group cool core. The temperature increases ahead of the core to and then drops to beyond the outer surface brightness edge at a radius of . The temperature and surface brightness, and therefore the gas density, decrease significantly with radius across this outer edge showing that it is a bow shock front ahead of the NE group core.
The xspec deprojection model projct was used to subtract the projected contributions from the outer cluster layers off the inner spectra and produce deprojected temperature and density profiles. Assuming spherical symmetry, projct simultaneously fits to all the projected spectra accounting for projected emission by adding suitably scaled model components from the outer annuli to the inner spectral fits. The X-ray emissivity depends strongly on the gas density () and only weakly on the temperature. Therefore it is possible to produce density profiles with higher spatial resolution by converting the surface brightness to electron density and using modest corrections for the temperature and exposure variation. Fig. 9 shows a finer resolution deprojected electron density profile overplotted on the projct result. The electron density drops by a factor of across the bow shock at a radius of . This coincides with a decrease in the temperature by a factor of . Applying the Rankine-Hugoniot shock jump conditions (eg. Landau & Lifshitz 1959), we can calculate the Mach number of the shock, , where is the preshock gas velocity with respect to the shock surface and is the speed of sound in the preshock gas. The Mach number can be calculated from the density jump,
| (2) |
where and are the electron densities upstream and downstream of the shock, respectively. An adiabatic index of , appropriate for a monatomic gas, is assumed. The Mach number for the bow shock is therefore . Although the uncertainty on the postshock temperature is large, the temperature jump appears broadly consistent with the density jump. The sound speed in the preshock gas is and therefore the shock velocity is .
We used the shock velocity to estimate the time since the closest passage between the two groups. The galaxy redshifts suggest a line of sight velocity difference of between the two groups (section 2.4). Therefore, we estimate that the merger axis is from the plane of the sky. The detection of a shock front is also consistent with a merger axis close to the plane of the sky because projection effects would otherwise obscure the surface brightness edge. From the projected separation between the two groups of , we estimate an age of .
The deprojected temperature and electron density were also multiplied together to produce the electron pressure profile (Fig. 9). This shows the expected sharp drop in pressure across the bow shock front. The pressure across the leading edge of the NE group core is continuous within the error showing that this is a merger cold front. The pressure then peaks at the centre of the NE group core.
4 NE group core structure
The N edge of the NE group core (Fig. 1 left) represents a sharp transition between the ambient gas and the cool core gas at only . Fig. 7 (upper right) shows that this steep temperature gradient is preserved over distance behind the core along the NE edge of the ram pressure stripped tail. However, the tail appears to broaden rapidly at a distance of behind the dense core. We compared a surface brightness profile across this edge with the surface brightness profile across the N edge (Fig. 5 upper right) to demonstrate this broadening (Fig. 10). The surface brightness profile for the leading edge excluded the ‘nose’. The profiles were divided into radial bins of width, increasing to at larger radii to ensure a minimum of 30 source counts per spatial bin. The energy range was restricted to to maximise the signal-to-noise ratio. The background was subtracted using the normalized blank-sky background dataset (see Section 2.1). Fig. 10 shows the final background-subtracted surface brightness profiles with the characteristic shape of a projected density discontinuity. The leading edge of the dense core is particularly narrow and appears broader in the sector along the NE edge of the subcluster’s tail.
The surface brightness edges were fit with a model for a projected spherical density discontinuity (eg. Markevitch et al. 2000, 2002; Owers et al. 2009). The radial density model consists of two power laws either side of a density jump, which is then projected under the assumption of spherical symmetry. The model is then convolved with a Gaussian function, to account for any intrinsic width, and fitted to the surface brightness profiles. The free parameters are the gradients and normalizations of the power law models, the radius of the density jump and the width of the density jump. The best-fit model for the leading edge and the NE tail edge are shown overlaid on the surface brightness profiles in Fig. 10. The leading edge of the NE group core has a best-fit width of . We note that this is an upper limit as any variations in the shape of the edge over the sector used will broaden the profile. The edge widens to in the sector across the NE edge of the subcluster’s tail, which coincides with the observed broadening of the temperature jump. This is likely caused by the development of turbulent instabilities along this sheared interface and will promote mixing of the cold ram pressure stripped gas into the ambient medium.
The ‘nose’ of the NE group core is likely to be a ram pressure stripped X-ray corona hosted by the large elliptical galaxy UGC4052 W. Following Nulsen (1982), the mass loss rate due to ram pressure is , where is the gas density in the ambient medium, is the cross-sectional radius of the corona and is the gas velocity. Assuming a cylindrical volume and a density comparable to the cool core, we estimate the total gas mass in the corona and therefore the survival time of the corona is (see also Sun et al. 2005; Sun et al. 2005). The corona may survive longer if there is significant mass injection from the stellar population or ICM cooling (eg. Acreman et al. 2003) or if the transport processes are suppressed by a magnetic field (Vikhlinin et al. 2001; Sun et al. 2005).
The striking IR and near-UV ring surrounding the galaxy pair UGC4052 is across and the major axis appears aligned with the central galaxies (Fig. 3). This alignment suggests that the formation of the ring could be linked to these galaxies. The group merger may have caused collisions between the constituent galaxies and the ring could correspond to the orbit of a smaller galaxy being stripped of its gas in the interaction. However, there is not a clear progenitor galaxy and the apparent spiralling of the orbit to the W complicates this interpretation (Fig. 3). The ring may have been produced by the stripping of multiple galaxies around UGC4052. An explosion origin appears less likely as the centre of the ring falls between the pair of galaxies but cannot be ruled out. Another possibility is that the ring was produced by a close encounter between the two central galaxies (eg. Lynds & Toomre 1976; Theys & Spiegel 1976; Appleton & Struck-Marcell 1987, 1996). The passage of the companion galaxy close to the centre of the parent galaxy produces an outwardly travelling density wave in the gas and stellar disks and triggers star formation in the expanding ring. However, the two galaxies are aligned along the major rather than the minor ring axis in contrast to other collisional ring galaxies, such as the Cartwheel ring galaxy (eg. Higdon 1995), Auriga’s Wheel (Conn et al. 2011) and AM1724-622 (Wallin & Struck-Marcell 1994). There is a velocity difference of along the line of sight between the two galaxies (Crawford et al. 1999) and, if this interaction was triggered by the group merger, there could be a greater velocity difference in the plane of the sky. UGC4052 E was targeted in the SDSS (Abazajian et al. 2009) and the spectrum shows a possible velocity offset between the gas emission lines and absorption lines in the stellar continuum. There could therefore also be a difference in the gas and stellar dynamics in this complex system.
Fig. 3 shows that at least part of the ring, depending on the projection, is located in the shock-heated ambient medium. PAHs, which produce the strong emission feature at , are easily destroyed by ionizing UV and X-rays and by shocks and therefore must be shielded somehow in this environment (eg. Voit 1992).
5 Ram pressure stripping of the NE group tail
Fig. 4 shows distortions around the sheared sides of the NE group’s ram pressure stripped tail and a potential large scale hydrodynamic instability (eg. Heinz et al. 2003; Iapichino et al. 2008). The shear flow around the NE group core will be greatest along the S edge where the two groups are moving past each other and the speed of the ambient medium is maximum (eg. Mazzotta et al. 2002). Fig. 7 shows that there is increased temperature and pressure in this region between the two groups. We compare the E and S sectors of the ram pressure stripped tail to determine if there is potentially mixing between the cool, dense core gas and the hot, ambient medium (Fig. 11). The temperature profiles increase through both sectors from to , with a higher temperature in the S sector out to . The temperature in the S sector increases significantly at a radius of to , which is comparable to the ambient gas. This corresponds to the surface brightness depression identified in Fig. 4 (see Section 2.3). The surface brightness excess in the neighbouring region at a radius of has a temperature consistent with the NE group tail. The excess is therefore a colder, denser structure extending into the ambient medium while the depression is a hotter, lower density filament penetrating from the ambient medium into the cool core. The temperature and surface brightness structure are therefore consistent with the shearing along this edge producing turbulent mixing of the gas between the two merging groups.
Turbulent mixing is the most natural explanation for this structure observed in a group merger and similar features have been found in other merging systems. The dense, cool cores in the cluster mergers in A3667 and A2146 show comparable ram pressure stripped structures and turbulent instabilities generated by the shear flow (Mazzotta et al. 2002; Russell et al. 2012). Observations of galaxies moving through the ICM also show long tails of stripped gas, which can be distorted by Kelvin-Helmholtz instabilities (Machacek et al. 2005, 2006; Randall et al. 2008; Sun et al. 2010; Kraft et al. 2011). The growth of these instabilities can be suppressed by the surface tension of a magnetic field and the viscosity of the gas, which may explain why some cold fronts appear smooth and undisrupted (eg. Machacek et al. 2005). Gravity is not expected to be important for suppressing Kelvin-Helmholtz instabilities in these systems (eg. Chandrasekhar 1961; Roediger et al. 2012a). The presence or absence of distortions to cold fronts can therefore be used to constrain the local ICM viscosity and magnetic field strength in the ICM.
Tangled magnetic fields may be amplified and stretched by the gas flow around cool cores in a merger (eg. Vikhlinin et al. 2001b; Dursi & Pfrommer 2008). Kelvin-Helmholz instabilities can be suppressed by this magnetic layer that is aligned with the interface and the flow direction. Therefore, observations of instabilities put an upper limit on the magnetic field strength at this location in RXJ0751.3+5012. Following Vikhlinin & Markevitch (2002), the criterion for a cold front stabilised by the magnetic pressure is
| (3) |
where and () are the magnetic field strengths in the cold and hot gas either side of the discontinuity, and are the corresponding gas temperatures, is the Mach number for the gas flow and is the ambient pressure. We assume the adiabatic index for a monatomic gas. Therefore, for a maximum postshock gas velocity with , gas temperatures either side of the discontinuity of and , and , the total magnetic field at this discontinuity is less than . This is consistent with observational constraints from Faraday rotation measurements for other galaxy groups (eg. Laing et al. 2008; Guidetti et al. 2010).
Roediger et al. (2012b) show that viscosity is not expected to significantly suppress the development of Kelvin-Helmholtz instabilities in galaxy groups. Following Roediger et al. (2013) and assuming Spitzer-like viscosity, we calculate the critical perturbation length scale below which viscosity will increase the growth time of perturbations
| (4) |
where is the shear velocity and is the ambient gas density. Therefore, for RXJ0751.3+5012, we estimate that full Spitzer viscosity will suppress the growth of Kelvin-Helmholtz instabilities on length scales below . This appears consistent with the observed distortions on scales of around the NE group core but there may be smaller scale instabilities that cannot be detected significantly in the existing observation.
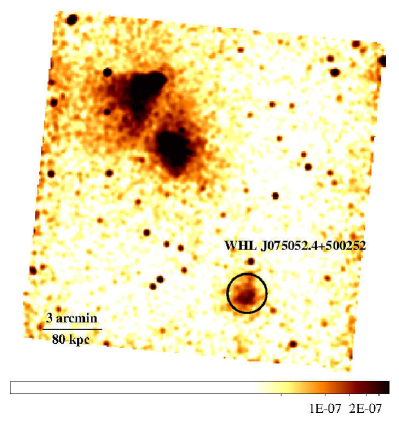
6 WHL J075052.4+500252
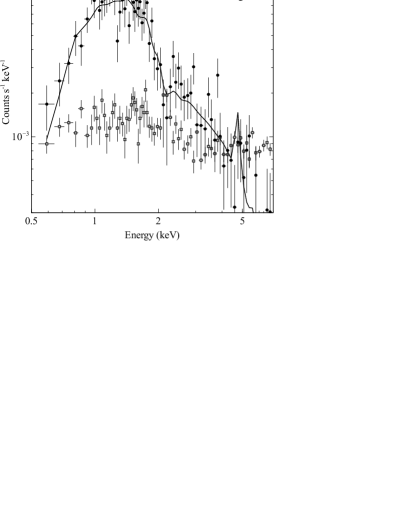
Fig. 12 (left) shows the full ACIS-I field of view. The two merging subgroups of RXJ0751.3+5012 are visible to the NE on ACIS-I3 but there is also extended emission clearly detected above the background to the SW on ACIS-I0. The X-ray emission peak for this additional extended source is located at RA 07h50m52.4s Dec +50d02m55s (J2000). This corresponds to the galaxy cluster WHL J075052.4+500252 at (Hao et al. 2010; Wen et al. 2012). Fig. 12 (right) shows the background subtracted X-ray spectrum for this source and the background spectrum. Using an absorbed single temperature apec model, we found a best-fit temperature of and total X-ray flux of (). The metallicity was fixed to and the redshift was fixed to . There was no clear detection of the Fe K line to confirm the redshift. The best-fit values of temperature and luminosity ( for ) place WHL J075052.4+500252 on the relation within the errors (Markevitch 1998; Arnaud & Evrard 1999; Pratt et al. 2009).
7 Conclusions
The new Chandra observation of RXJ0751.3+5012 has revealed an off-axis merger between two galaxy groups. The NE group hosts a dense, cool core that has been strongly disrupted by ram pressure in the collision and formed a -long tail of stripped gas. Sharp surface brightness edges are observed around each group core corresponding to cold fronts where the cooler, dense core gas moves through the warmer ambient medium. The boxy structure and lack of disruption to the SW group suggests the cold front around the core is due to gas sloshing recently triggered by the collision. We observe an additional surface brightness edge () ahead of the NE group core associated with a sharp drop in gas density, temperature and pressure. This is a bow shock front, the first detected in a group merger, with a Mach number . From the shock velocity of and constituent galaxy redshifts, we estimate that the merger axis lies close to the plane of the sky at an angle of . Together with the projected distance between the groups of , we determine that closest approach occurred ago. From the global temperature of each group, we estimated that the SW group is three times more massive than the NE group and therefore the collision is on the borderline between a major and minor merger.
Although the leading edge of the NE group core is narrow, the sheared sides of the core and stripped tail are broader and appear distorted by Kelvin-Helmholtz instabilities. The gas temperature through the ram pressure stripped tail increases more rapidly along the S edge where the two groups are moving past each other and the shear flow is strongest. In addition, we observe an arc-like surface brightness excess and depression consistent with the development of a large scale hydrodynamical instability along the S edge of the tail. The growth of these turbulent eddies can be suppressed by magnetic fields and viscosity. Therefore, we show that, for Spitzer-like viscosity, the presence of these instabilities is consistent with the critical perturbation length above which instabilities can grow and place an upper limit on the magnetic field strength in the intragroup medium.
The NE group hosts two large elliptical galaxies (UGC4052) separated by a projected distance of and surrounded by an IR and near-UV ring with a diameter of . The E galaxy is coincident with the X-ray peak and luminous H line emission located at the centre of the group’s cool core. The W galaxy is positioned ahead of the group core and hosts a ram pressure stripped X-ray corona. The surrounding ring could have been produced by material stripped from a smaller galaxy orbiting around UGC4052 or it may be a collisional ring generated by a close encounter between the two large galaxies.
Acknowledgements
We thank the reviewer for helpful and constructive comments. HRR and BRM acknowledge generous financial support from the Canadian Space Agency Space Science Enhancement Program. HRR also acknowledges support from a COFUND Junior Research Fellowship at the Durham University Institute of Advanced Study. HRR and ACF acknowledge support from ERC Advanced Grant Feedback. PEJN was supported by NASA contract NAS8-03060. BRM acknowledges generous support from the Natural Sciences and Engineering Research Council of Canada. ACE acknowledges support from STFC grant ST/I001573/1. MD acknowledges partial support from NASA Chandra award GO1-12155B. HRR thanks Trevor Ponman, Graham Smith, Lindsay King and Rebecca Canning for helpful discussions.
Funding for the SDSS and SDSS-II has been provided by the Alfred P. Sloan Foundation, the Participating Institutions, the National Science Foundation, the U.S. Department of Energy, the National Aeronautics and Space Administration, the Japanese Monbukagakusho, the Max Planck Society, and the Higher Education Funding Council for England. The SDSS Web Site is http://www.sdss.org/. The SDSS is managed by the Astrophysical Research Consortium for the Participating Institutions. The Participating Institutions are the American Museum of Natural History, Astrophysical Institute Potsdam, University of Basel, University of Cambridge, Case Western Reserve University, University of Chicago, Drexel University, Fermilab, the Institute for Advanced Study, the Japan Participation Group, Johns Hopkins University, the Joint Institute for Nuclear Astrophysics, the Kavli Institute for Particle Astrophysics and Cosmology, the Korean Scientist Group, the Chinese Academy of Sciences (LAMOST), Los Alamos National Laboratory, the Max-Planck-Institute for Astronomy (MPIA), the Max-Planck-Institute for Astrophysics (MPA), New Mexico State University, Ohio State University, University of Pittsburgh, University of Portsmouth, Princeton University, the United States Naval Observatory, and the University of Washington.
References
- Abazajian et al. (2009) Abazajian K. N. et al., 2009, ApJS, 182, 543
- Acreman et al. (2003) Acreman D. M., Stevens I. R., Ponman T. J., Sakelliou I., 2003, MNRAS, 341, 1333
- Anders & Grevesse (1989) Anders E., Grevesse N., 1989, Geochim. Cosmochim. Acta, 53, 197
- Appleton & Struck-Marcell (1987) Appleton P. N., Struck-Marcell C., 1987, ApJ, 318, 103
- Appleton & Struck-Marcell (1996) Appleton P. N., Struck-Marcell C., 1996, FCP, 16, 111
- Arnaud (1996) Arnaud K. A., 1996, in Astronomical Society of the Pacific Conference Series, Vol. 101, Jacoby G. H., Barnes J., ed, Astronomical Data Analysis Software and Systems V, p. 17
- Arnaud & Evrard (1999) Arnaud M., Evrard A. E., 1999, MNRAS, 305, 631
- Ascasibar & Markevitch (2006) Ascasibar Y., Markevitch M., 2006, ApJ, 650, 102
- Becker et al. (1995) Becker R. H., White R. L., Helfand D. J., 1995, ApJ, 450, 559
- Buote (2000) Buote D. A., 2000, MNRAS, 311, 176
- Cash (1979) Cash W., 1979, ApJ, 228, 939
- Chandrasekhar (1961) Chandrasekhar S., 1961, Hydrodynamic and hydromagnetic stability
- Conn et al. (2011) Conn B. C., Pasquali A., Pompei E., Lane R. R., Chené A.-N., Smith R., Lewis G. F., 2011, ApJ, 741, 80
- Crawford et al. (1999) Crawford C. S., Allen S. W., Ebeling H., Edge A. C., Fabian A. C., 1999, MNRAS, 306, 857
- Dupke & White (2003) Dupke R., White R. E., III, 2003, ApJ, 583, L13
- Dupke et al. (2007) Dupke R., White R. E., III, Bregman J. N., 2007, ApJ, 671, 181
- Dursi & Pfrommer (2008) Dursi L. J., Pfrommer C., 2008, ApJ, 677, 993
- Ebeling et al. (1998) Ebeling H., Edge A. C., Bohringer H., Allen S. W., Crawford C. S., Fabian A. C., Voges W., Huchra J. P., 1998, MNRAS, 301, 881
- Ettori & Fabian (2000) Ettori S., Fabian A. C., 2000, MNRAS, 317, L57
- Finoguenov et al. (2001) Finoguenov A., Reiprich T. H., Böhringer H., 2001, A&A, 368, 749
- Forman et al. (1985) Forman W., Jones C., Tucker W., 1985, ApJ, 293, 102
- Forman et al. (1979) Forman W., Schwarz J., Jones C., Liller W., Fabian A. C., 1979, ApJ, 234, L27
- Freeman et al. (2002) Freeman P. E., Kashyap V., Rosner R., Lamb D. Q., 2002, ApJS, 138, 185
- Geller & Huchra (1983) Geller M. J., Huchra J. P., 1983, ApJS, 52, 61
- Guidetti et al. (2010) Guidetti D., Laing R. A., Murgia M., Govoni F., Gregorini L., Parma P., 2010, A&A, 514, A50
- Hao et al. (2010) Hao J. et al., 2010, ApJS, 191, 254
- Heinz et al. (2003) Heinz S., Churazov E., Forman W., Jones C., Briel U. G., 2003, MNRAS, 346, 13
- Helsdon & Ponman (2000) Helsdon S. F., Ponman T. J., 2000, MNRAS, 315, 356
- Higdon (1995) Higdon J. L., 1995, ApJ, 455, 524
- Iapichino et al. (2008) Iapichino L., Adamek J., Schmidt W., Niemeyer J. C., 2008, MNRAS, 388, 1079
- Kalberla et al. (2005) Kalberla P. M. W., Burton W. B., Hartmann D., Arnal E. M., Bajaja E., Morras R., Pöppel W. G. L., 2005, A&A, 440, 775
- Kraft et al. (2004) Kraft R. P., Forman W. R., Churazov E., Laslo N., Jones C., Markevitch M., Murray S. S., Vikhlinin A., 2004, ApJ, 601, 221
- Kraft et al. (2011) Kraft R. P. et al., 2011, ApJ, 727, 41
- Kraft et al. (2006) Kraft R. P., Jones C., Nulsen P. E. J., Hardcastle M. J., 2006, ApJ, 640, 762
- Laing et al. (2008) Laing R. A., Bridle A. H., Parma P., Murgia M., 2008, MNRAS, 391, 521
- Landau & Lifshitz (1959) Landau L. D., Lifshitz E. M., 1959, Fluid mechanics. Oxford, Pergamon Press
- Lynds & Toomre (1976) Lynds R., Toomre A., 1976, ApJ, 209, 382
- Macario et al. (2011) Macario G., Markevitch M., Giacintucci S., Brunetti G., Venturi T., Murray S. S., 2011, ApJ, 728, 82
- Machacek et al. (2005) Machacek M., Dosaj A., Forman W., Jones C., Markevitch M., Vikhlinin A., Warmflash A., Kraft R., 2005, ApJ, 621, 663
- Machacek et al. (2006) Machacek M., Jones C., Forman W. R., Nulsen P., 2006, ApJ, 644, 155
- Machacek et al. (2011) Machacek M. E., Jerius D., Kraft R., Forman W. R., Jones C., Randall S., Giacintucci S., Sun M., 2011, ApJ, 743, 15
- Machacek et al. (2010) Machacek M. E., O’Sullivan E., Randall S. W., Jones C., Forman W. R., 2010, ApJ, 711, 1316
- Markevitch (1998) Markevitch M., 1998, ApJ, 504, 27
- Markevitch et al. (2002) Markevitch M., Gonzalez A. H., David L., Vikhlinin A., Murray S., Forman W., Jones C., Tucker W., 2002, ApJ, 567, L27
- Markevitch et al. (2005) Markevitch M., Govoni F., Brunetti G., Jerius D., 2005, ApJ, 627, 733
- Markevitch et al. (2000) Markevitch M. et al., 2000, ApJ, 541, 542
- Markevitch & Vikhlinin (2007) Markevitch M., Vikhlinin A., 2007, Phys. Rep., 443, 1
- Markevitch et al. (2001) Markevitch M., Vikhlinin A., Mazzotta P., 2001, ApJ, 562, L153
- Mazzotta et al. (2002) Mazzotta P., Fusco-Femiano R., Vikhlinin A., 2002, ApJ, 569, L31
- Million et al. (2010) Million E. T., Allen S. W., Werner N., Taylor G. B., 2010, MNRAS, 405, 1624
- Mulchaey (2000) Mulchaey J. S., 2000, ARA&A, 38, 289
- Mulchaey et al. (1993) Mulchaey J. S., Davis D. S., Mushotzky R. F., Burstein D., 1993, ApJ, 404, L9
- Murray et al. (1993) Murray S. D., White S. D. M., Blondin J. M., Lin D. N. C., 1993, ApJ, 407, 588
- Nulsen (1982) Nulsen P. E. J., 1982, MNRAS, 198, 1007
- O’Dea et al. (2008) O’Dea C. P. et al., 2008, ApJ, 681, 1035
- Owers et al. (2009) Owers M. S., Nulsen P. E. J., Couch W. J., Markevitch M., 2009, ApJ, 704, 1349
- Park et al. (2006) Park T., Kashyap V. L., Siemiginowska A., van Dyk D. A., Zezas A., Heinke C., Wargelin B. J., 2006, ApJ, 652, 610
- Ponman & Bertram (1993) Ponman T. J., Bertram D., 1993, Nat, 363, 51
- Ponman et al. (1996) Ponman T. J., Bourner P. D. J., Ebeling H., Böhringer H., 1996, MNRAS, 283, 690
- Ponman et al. (1999) Ponman T. J., Cannon D. B., Navarro J. F., 1999, Nat, 397, 135
- Pratt et al. (2009) Pratt G. W., Croston J. H., Arnaud M., Böhringer H., 2009, A&A, 498, 361
- Quillen et al. (2008) Quillen A. C. et al., 2008, ApJS, 176, 39
- Randall et al. (2008) Randall S., Nulsen P., Forman W. R., Jones C., Machacek M., Murray S. S., Maughan B., 2008, ApJ, 688, 208
- Rasmussen & Ponman (2009) Rasmussen J., Ponman T. J., 2009, MNRAS, 399, 239
- Roediger et al. (2011) Roediger E., Brüggen M., Simionescu A., Böhringer H., Churazov E., Forman W. R., 2011, MNRAS, 413, 2057
- Roediger et al. (2012a) Roediger E., Kraft R. P., Machacek M. E., Forman W. R., Nulsen P. E. J., Jones C., Murray S. S., 2012a, ApJ, 754, 147
- Roediger et al. (2013) Roediger E., Kraft R. P., Nulsen P., Churazov E., Forman W., Brüggen M., Kokotanekova R., 2013, MNRAS, 436, 1721
- Roediger et al. (2012b) Roediger E., Lovisari L., Dupke R., Ghizzardi S., Brüggen M., Kraft R. P., Machacek M. E., 2012b, MNRAS, 420, 3632
- Russell et al. (2012) Russell H. R. et al., 2012, MNRAS, 423, 236
- Russell et al. (2010) Russell H. R., Sanders J. S., Fabian A. C., Baum S. A., Donahue M., Edge A. C., McNamara B. R., O’Dea C. P., 2010, MNRAS, 406, 1721
- Sanders (2006) Sanders J. S., 2006, MNRAS, 371, 829
- Sanderson et al. (2003) Sanderson A. J. R., Ponman T. J., Finoguenov A., Lloyd-Davies E. J., Markevitch M., 2003, MNRAS, 340, 989
- Smith et al. (2001) Smith R. K., Brickhouse N. S., Liedahl D. A., Raymond J. C., 2001, ApJ, 556, L91
- Sun et al. (2010) Sun M., Donahue M., Roediger E., Nulsen P. E. J., Voit G. M., Sarazin C., Forman W., Jones C., 2010, ApJ, 708, 946
- Sun et al. (2005) Sun M., Jerius D., Jones C., 2005, ApJ, 633, 165
- Sun et al. (2007) Sun M., Jones C., Forman W., Vikhlinin A., Donahue M., Voit M., 2007, ApJ, 657, 197
- Sun et al. (2005) Sun M., Vikhlinin A., Forman W., Jones C., Murray S. S., 2005, ApJ, 619, 169
- Theys & Spiegel (1976) Theys J. C., Spiegel E. A., 1976, ApJ, 208, 650
- Tully (1987) Tully R. B., 1987, ApJ, 321, 280
- Vikhlinin et al. (2006) Vikhlinin A., Kravtsov A., Forman W., Jones C., Markevitch M., Murray S. S., Van Speybroeck L., 2006, ApJ, 640, 691
- Vikhlinin et al. (2001) Vikhlinin A., Markevitch M., Forman W., Jones C., 2001, ApJ, 555, L87
- Vikhlinin et al. (2001a) Vikhlinin A., Markevitch M., Murray S. S., 2001a, ApJ, 551, 160
- Vikhlinin et al. (2001b) Vikhlinin A., Markevitch M., Murray S. S., 2001b, ApJ, 549, L47
- Vikhlinin & Markevitch (2002) Vikhlinin A. A., Markevitch M. L., 2002, Astronomy Letters, 28, 495
- Voit (1992) Voit G. M., 1992, MNRAS, 258, 841
- Wallin & Struck-Marcell (1994) Wallin J. F., Struck-Marcell C., 1994, ApJ, 433, 631
- Watson et al. (2009) Watson M. G. et al., 2009, A&A, 493, 339
- Wen et al. (2012) Wen Z. L., Han J. L., Liu F. S., 2012, ApJS, 199, 34
- ZuHone et al. (2010) ZuHone J. A., Markevitch M., Johnson R. E., 2010, ApJ, 717, 908
- ZuHone et al. (2011) ZuHone J. A., Markevitch M., Lee D., 2011, ApJ, 743, 16