High Resolution Échelle Spectroscopy of Two High Proper Motion Stars: HD 102870 and BD+20 3603
Abstract
A chemical abundance analysis is made of two F type high proper motion stars selected from the ELODIE library. We use high resolution (R=42 000) and high signal to noise ratio (S/N=103, 36 perpixel) échelle spectra from the ELODIE library of HD 102870 and BD +20 3603, as two representative F type high proper motion stars, to determine fundamental parameters and photospheric abundances of 16 chemical elements including slow (s) and rapid (r)process elements from Y to Ba. The chemical composition and kinematic parameters of the stars imply that they belong to different Galactic populations: we report HD 102870, an IAU standard radial velocity star, to be a thin disk star and BD +20 3603, a metal-poor HPM star, to be a halo star.
keywords:
High proper motion, chemical abundances, kinematicsS. O. Solakcı1,
T. Şahin2∗,
C. Flynn3,
A. Dervişoğlu4
1Akdeniz University, Faculty of Science, Physics Department, 07058, Antalya, Turkey
2Akdeniz University, Faculty of Science, Space Science and Technologies Department, 07058, Antalya, Turkey
3Center for Astophysics amd Supercomputing, Swinburne University of Technology, Hawthorn, Australia
4Department of Astronomy and Space Sciences, Erciyes University, 38039, Kayseri, Turkey
1 Introduction
The study of unevolved late-type stars belonging to different Galactic populations (the halo, the thick and thin disks) with large proper motions is fundamental for our knowledge of the Galaxy’s stellar content as well as for reconstructing its chemical evolution. Late-type, metal-poor stars (the F to K type dwarfs such as BD +20 3603) with narrow and less blended spectral lines in their spectra are excellent probes at medium resolution of the chemical history of the earliest stellar populations. Large ongoing surveys of such stars, such as HERMES/GALAH, ESO-Gaia and RAVE depend on accurately calibrated stellar parameters from such stars.
We are currently undertaking a program of determining abundances for a large number of elements from High Proper Motion (here after HPM) stars and correlating these with the stellar Galactic orbital parameters. The project is based on high resolution échelle spectra obtained with the 1.9m Observatoire de Haute-Provence telescope and spectrograph. Our whole HPM (-362 to +689 mas.yr-1 in RA; -899 to +339 mas.yr-1 in Dec.)111Proper motions and distances (computed from parallaxes) are from SIMBAD database at http://SIMBAD.u-strasbg.fr/SIMBAD/. Atmospheric parameters are from the ELODIE archive at http://atlas.obs-hp.fr/ELODIE/; Moultaka et al. (2004). sample consists of 54 F-type stars, along the ELODIE library (Prugniel & Soubiran 2001) with effective temperatures Teff K, surface gravities log g , metallicities [Fe/H] , and distances d pc. In this paper, we aim to determine chemical abundances of two interesting program stars: HD 102870, a common star among IAU standard radial velocity stars as listed in the Astronomical Almanac, also a GAIA FGK Benchmark Star (GBS; Jofré et al. 2014) and BD +20 3603, a metal-poor HPM star. In Section 2, we briefly give information on data selection process while Section 3 describes the observations and the methods used for chemical abundance analysis. In Section 4, we present results on their kinematics. In Section 5, we report the results of LTE based determination of model atmosphere parameters and elemental abundances suggesting a thin disk and halo membership for HD 102870 and BD +20 3603, respectively.
2 Data Selection
The ELODIE (Soubiran 2003) library contains 1953 spectra for 1388 stars with F and G types being the most common: the library contains 615 F type and 545 G type stars. Our first selection criterion for the program stars was their spectral types. Among the F spectral type stars, we chose only the stars with an HPM designation in the library, and removed the spectroscopic binaries from the sample. Binarity is checked by using SIMBAD database222It should be noted that comments on binarity is not reported in the ELODIE archive.. Thus, in total, we are left with 54 échelle spectra for spectroscopic analysis from the library.
3 Observation and Analysis
High resolution (R=42 000) and high signal-to-noise ratio (S/N) ELODIE data provides a spectral coverage from 3900 to 6800 Å . The spectra were continuum normalized, wavelength calibrated and radial velocity corrected by the data-reduction pipeline run at the telescope. Prior to the abundances analysis, the ELODIE spectra were re-normalized, using a in-house developed interactive normalization code INSS333INSS-Interactive Normalization of Stellar Spectra, developed under the TUBITAK project (No:111T219) on ”Radial Velocity measurements of RV Tauri-like IRAS Stars”. written in IDL.
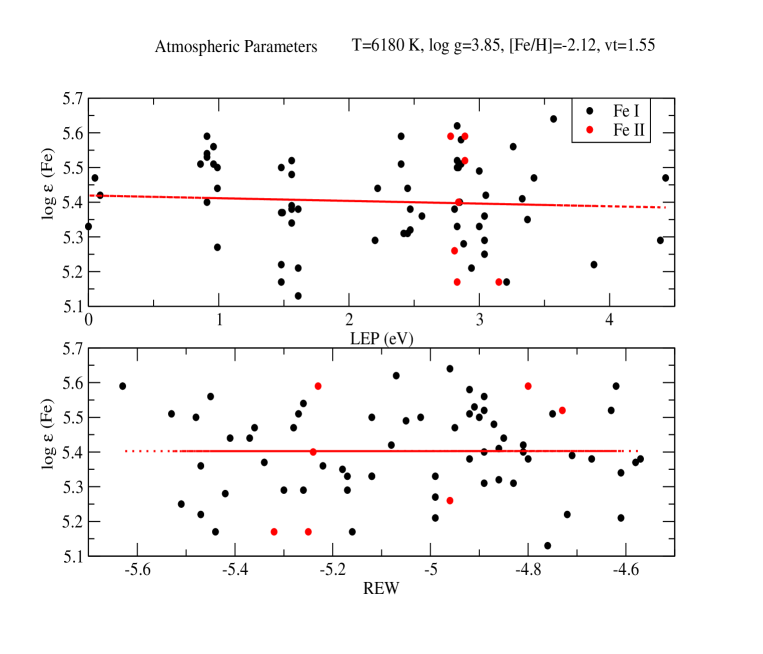
We have used LIME - Line Measurements from échelle Spectra (Şahin 2013) for the line identification process. The current version of LIME (ver. 3.0.) provides not only the most probable identifications for the line of interest but also lists the related atomic data (e.g. Rowland Multiplet Number-RMT, log, and Lower Level Excitation Potential-LEP) that are compiled (e.g. from NIST database) and fed into the code by the user. Equivalent widths (EWs) are obtained using SPECTRE (Sneden 1973). Finally, we determine the chemical composition of the stars by using an LTE line analysis code MOOG (Sneden 1973) and an ATLAS9 computed (ODFNEW) model atmospheres. In the limit that a line selection contains relatively weak lines (i.e. mÅ ), the effective temperatures (Teff) is found by imposing the condition that the derived abundance be independent of the lower level excitation potential (LEP). In the limit that all lines have the same LEP and a similar wavelength, the microturbulence () is found by requiring that the derived abundance be independent of reduced equivalent width (EW). For abundance determinations of most of the HPM stars including HD 102870 and BD +20 3603 in our ELODIE sample, this procedure was followed. For our sample of Fe I lines, these two conditions are imposed simultaneously since these atmospheric parameters are interdependent, an iterative procedure is necessary. We determined the surface gravity () by requiring ionization equilibrium, e.g. that Fe I and Fe II lines produce the same iron abundance. 444The reason for this choice of Fe lines is that Fe lines are often quite numerous, even in very metal-poor stars. The details of abundance analysis and source of atomic data are the same as in Şahin & Lambert (2009) and Şahin et al. (2011).
4 Space Velocities and Orbits
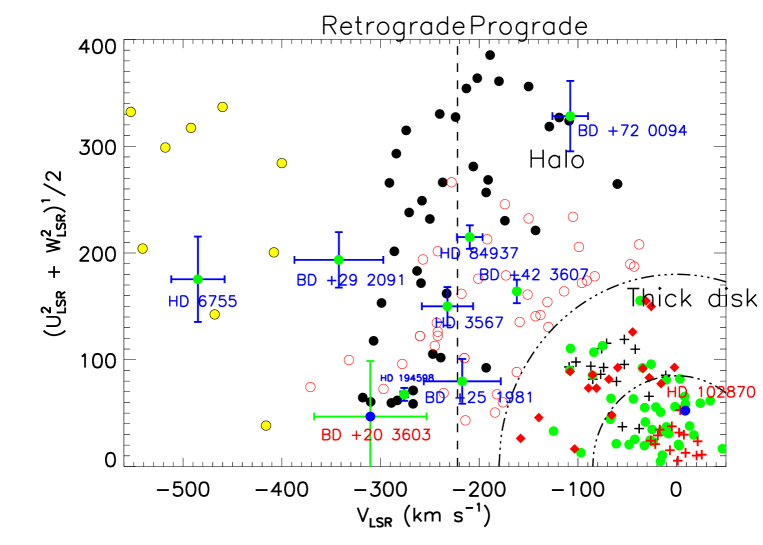
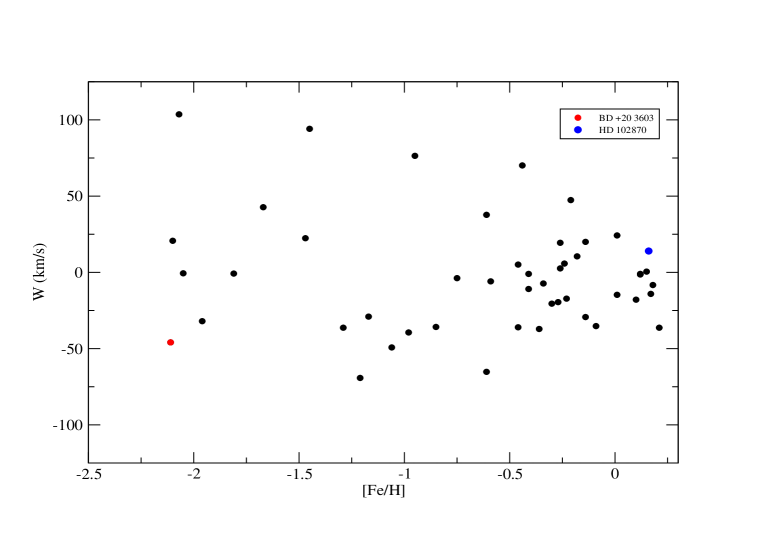
In order to analyse the content of our HPM sample in terms of stellar population, we compute the space velocities of the stars. Information on their positions (from SIMBAD), parallaxes and proper motions are from the new reduction of the Hipparcos data (Van Leeuwen 2007). Radial velocities have been computed by cross-correlation methodology (with an accuracy better than 0.1 km s-1). We calculate the Galactic space velocities U (toward Galactic Center, l = 0∘), V (along the Galactic Rotation: l = 90∘, b = 0∘), W (towards the North Galactic Pole, b=90∘) and their errors with respect to the local standard of rest using the method presented in Johnson & Soderblom (1987). Corrections for the solar motion (10.0, 5.25, 7.17) km s-1 by Dehnen & Binney (1998) were adopted. Finally, using those computed Galactic space velocities, a Toomre Energy Diagram consisting of a complete list of HPM stars from the archive with a sample of stars from Nissen & Schuster (2010) (outer halo stars with black filled circle, inner halo star with open red circles, and thick disk stars with crosses) and Schuster (1993) (high velocity stars with yellow filled circle) was compiled.(see Fig.1) Additional samples of thin (red plus sign), thick (red filled diamond) disk stars from Bensby et al. (2005) with our sample of HPM stars555The error bars (in blue) are indicated only for the stars with large velocity errors ( km/s) in the total space velocity. (filled green circle) are also included. The dashed line in Figure 1. indicates zero rotation in the Galaxy and the arcs correspond to V180 km/s and 87 km/s, the definitions of “thick disk” and “disk” (Nissen 2004). Figure 2. shows the distribution of the sample stars in the plane metallicity - velocity.
In order to complement the chemical abundances obtained in this study, we also calculate Galactic orbital parameters for HD 102870 and BD +20 3603 with the standard gravitational potentials described in the literature (Miyamoto & Nagai 1975; Hernquist 1990; Johnston et al. 1995; Dinescu et al. 1999). The Solar Galactocentric distance and circular velocity are taken to be 8.0 kpc and 220 km s-1, respectively. For the orbital integration, a fourth order symplectic integration technique by Yoshida (1990) was applied. The typical orbital integration corresponds to 3 Gyr, and is sufficient to evaluate the orbital elements of the HPM sample. Testing the code for orbital parameters of 160 stars from Takeda et al. (2007) gives a mean error of 0.01 in eccentricity and of 0.11 kpc in Galactocentric distance.
5 Results and conclusions
5.1 HD102870: a radial velocity standard star
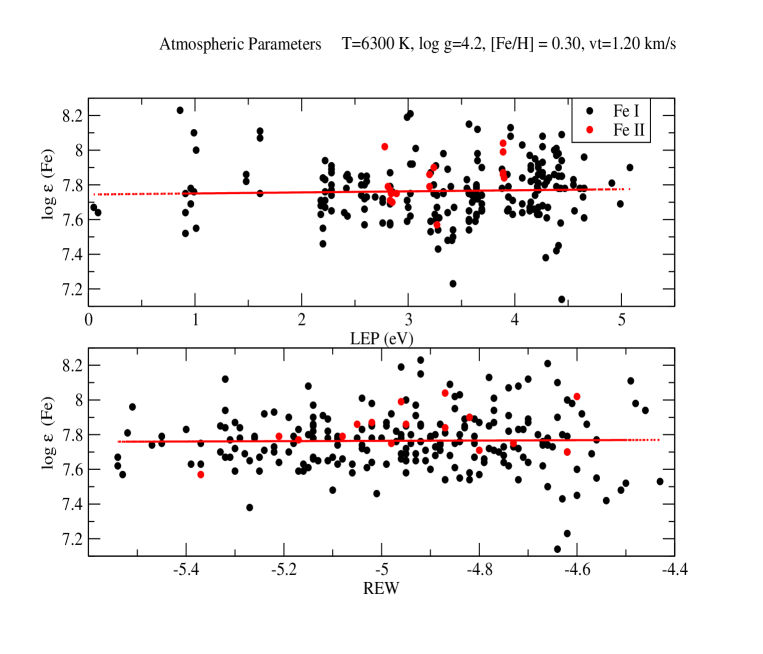
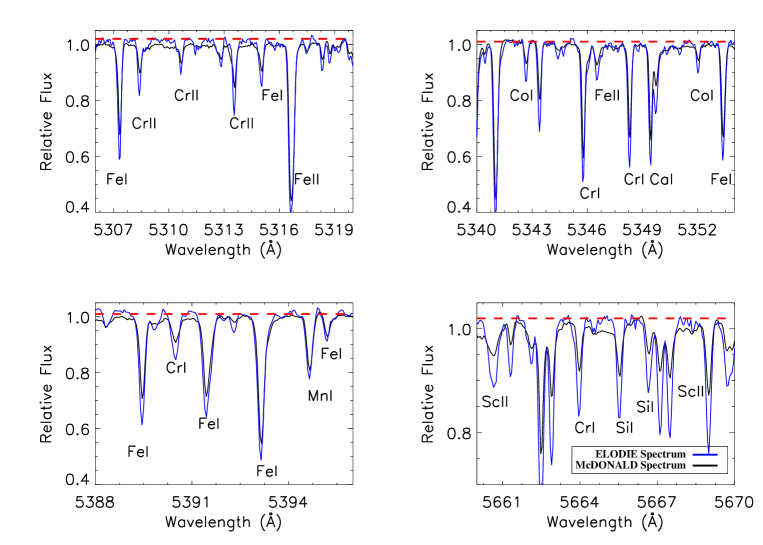
Chemical abundances based on our equivalent width analysis of IAU standard radial velocity star (as listed in the Astronomical Almanac): HD 102870 for the following model parameters: Teff = K, log g = , [Fe/H] = , and = km s-1 are obtained. Figure 3 presents an example plot for the determination of atmospheric parameters. The spectrum of HD 102870 is presented in Figure 4. Intensity differences between ELODIE and McDonald spectra in neutral and ionized lines of Si, Ca, Sc, Cr, Mn, Fe, and Co are interesting to note. Figure 5 shows a comparison of model parameters obtained in this study to those listed in the literature.
The final elemental abundances log (X) averaged over the sets of measured lines are listed in Table 1, where the first column gives species, second gives logarithmic elemental abundances and third gives element over iron ratios for the star666[X/Fe]=[log(X)-log(Fe)]star - [log(X)-log(Fe)]⊙. Column four and five give element over iron ratios for thin disk stars from Bensby et al. (2005) and Solar abundances from Asplund et al. (2009). The number of lines used in the analysis are presented in the column six.
On purely chemical grounds, the metallicity of HD 102870 implies a thin disk membership for the star ( [Fe/H] for the thin disk, Lambert 1988). The element abundance for the star with [/Fe]-0.1 is also typical for a thin disk star (Navarro et al. 2011). Further confirmation for thin disk membership came from kinematics of the star.
The Galactic space velocities to be used to determine membership status of the star has been calculated as = (, , ) km/s. The Toomre energy diagram is shown in Figure 1. also verifies the thin disk membership for the star.
Finally, we compute thin and thick disk probabilities for the star on the basis of its spatial velocity. Those respective thin and thick disk membership probabilities as 0.95 (Pr1) and 0.05 (Pr2), with the recipe given by Mishenina et al. (2004) and also using the membership test by Bensby et al. (2005), clearly indicates to a thin disk membership with a thick-disk-to-thin-disk (TD / D) probability of 0.02. We also computed the orbit of the star. The computed apogalactic and perigalactic distances of the star are found to be kpc and kpc and a maximum height excursion above the Galactic plane of pc. An orbital eccentricity of 0.15 is obtained. Additional test by isochrones of Bertelli (1994) for estimation of age gives an age of 9 Gyrs for this thin disk star.777Age estimation is based on atmospheric parameters: Teff, log g and [Fe/H] and calculations are performed on the basis of scaled-solar evolution models (see Allende Prieto et al. 2004; Reddy et al. 2006, and Ramirez et al. 2007).
5.2 BD +20 3603: a metal-poor high-proper motion star
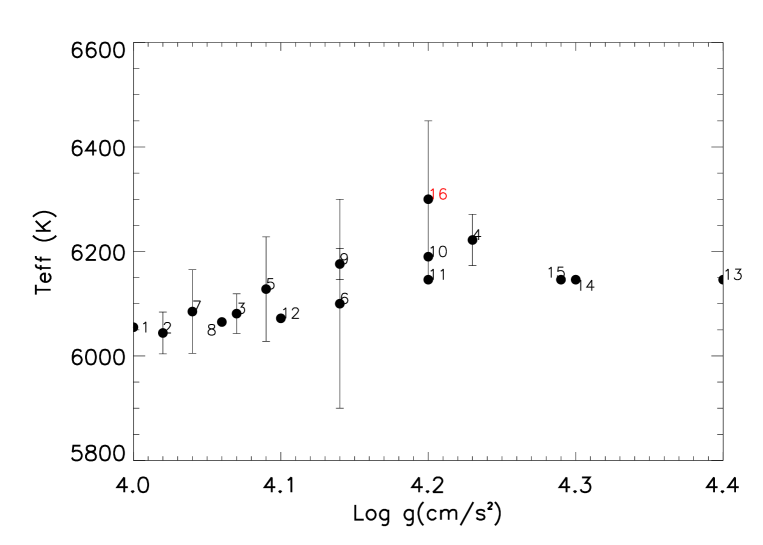
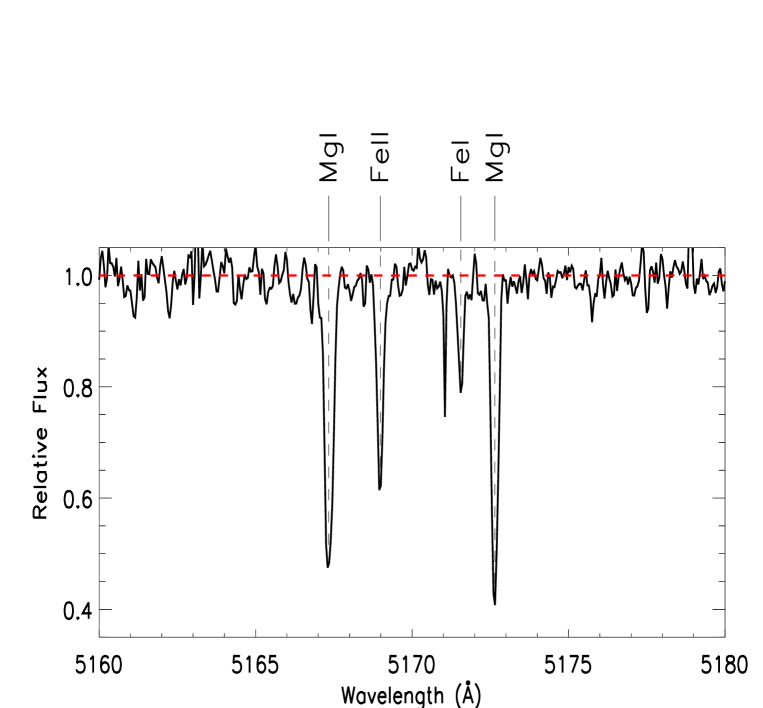
The chemical abundances and kinematic analysis of metal-poor high-proper motion star, BD +20 3603, was performed . In Table 2, we present results on equivalent width analysis of the spectrum for the following model parameters: Teff = 6180150 K, , [Fe/H], and . Figure 6 presents an example plot for the determination of atmospheric parameters. An example spectrum of the star is presented in Figure 7. Figure 8 presents a comparison of model parameters obtained in this study to those listed in the literature. Table 2 presents the elemental abundances with element over iron ratios from Bai et al. (2004) in the fourth column. To check our determination of abundances and compare line to-line scatter values, we used equivalent widths, reported line list and atomic data from a low resolution spectrum (R15000) of the star by Bai et al. (2004).

Bai et al. (2004) do not report line-by-line abundances for the elements studied for equivalent width analysis but only present the (mean) element over iron ratios. So, in order to perform this test for comparison purposes, a model atmosphere using the following model parameters of Bai et al. (2004) (T K, cm s-2, [Fe/H] , km s-1 ) was computed. Neutral and ionized Fe abundances are found as follows: [Fe I] and [Fe II] with a line-to-line scatter as high as 0.5 dex. Using a KUROLD instead of NEWODF model increased neutral and ionized iron abundances by only 0.09 dex and 0.07 dex, respectively. These values are in accordance with our determination of iron abundance: [Fe I] = 5.400.12, [Fe II] . The test is performed with a 3 times higher resolution spectrum from the ELODIE library with our determination of equivalent widths provided as input and a similar source of atomic data (i.e. NIST) were used. The overabundances of magnesium ([Mg/Fe]=0.21) and calcium ([Ca/Fe]=0.35) as tracers of -process elements with [/Fe]0.3 are expected for a halo star (Magain 1987, 1989; Gratton & Sneden 1987, 1988, 1991; Nissen et al. 1994; Fuhrmann et al. 1995; McWilliam et al. 1995). The computed Galactic velocity components for BD +20 3603 are found to be km s-1. The method of Bensby (2005) for BD +20 3603 implies a halo membership for the star. The apogalactic and perigalactic distances of 8.050.60 kpc and 2.162.0 kpc with a Zmax of 890600 pc and an orbital eccentricity of 0.58 indicates to a halo membership for the star. The isochrones by Bertelli (1994) corraborates the membership status of the star as a halo star with an age of 9 Gyr. The star, based on elemental abundances, metallicity (based on metallicity criteria for halo objects as [Fe/H] by Lambert 1988) and its kinematics supported with orbital computations seem to be a halo star.
6 Future Work
Focusing on chemistry of metal-poor and radial velocity standard stars with relatively high space motions with a help of their kinematics will not only extent our understanding of earliest type of stellar populations but also improve accuracy of radial velocity measurements. Our report of relatively higher metallicity of HD 102870 as an IAU standard radial velocity star is a unique example. Intensity differences between ELODIE and McDonald spectra of the star in neutral and ionized Si, Ca, Sc, Cr, Mn, Fe, and Co lines are interesting to note and needs to be investigated further by increasing the number of HPM stars for spectroscopic analysis. This also implys an important fact that special care has to be taken when using the radial velocity standard stars with HPM designation in studies regarding precise measurements of radial velocities. So the question inspired us to pursue this research remains partially unanswered. The analysis of whole sample continues. For some of the program star with relatively low signal-to-noise ratio, additional spectra are required. A dedicated web page containing results on abundances and kinematical properties for whole HPM sample is also being prepared. We plan to extend our study to G type HPM stars from the ELODIE library in order to convey effects of HPM nature of a star on its chemistry in more detail and to reveal possible correlation between kinematics and abundance ratios.
7 Acknowledgment
TS acknowledge the financial support by T BITAK (TBAG-1001; Project No: 111T219).
References
- (1) Allende Prieto C., Barklem P. S., Lambert D. L. and Cunha K. 2004, AA, 420, 183
- (2) Asplund M.,Grevesse N., Sauval A., P. Scott P., et al. 2009, AA, 481, 522
- (3) Bai G. S., Zhao G., Chen Y. Q., Shi J. R., Klochkova V. G., Panchuk V. E., Qui H. M., Zhang H. W., et al. 2004, AA, 425 - 671
- (4) Balachandran S. 1990, AJ, 354, 310
- (5) Baschek B. H., Holweger H., Namba O., & Traving G. 1967, ZAP, 65, 418
- (6) Bensby T., Feltzing S., Lundstr m I., Ilyin I. 2005, AA, 185, 203
- (7) Bertelli G.,Bressan A., Chiosi C., et al. 1994, AA, 275, 302
- (8) Boesgaard A. M., Lavery R. J. 1986, AJ, 309, 762
- (9) Carney W., Wright S., Sneden C., et al. 1997, AJ, 114, 363
- (10) Cenarro A. J., Peletier R. F., S nchez-Bl zquez P., Selam S. O., Toloba E., Cardiel N., Falc n-Barroso J., Gorgas J., Jim nez-Vicente J., Vazdekis A. 2007, MNRAS, 374, 664
- (11) Prugniel P., Soubiran C. 2001, AA, 369, 1048
- (12) Dehnen W., Binney J., et al. 1998, MNRAS, 387,394
- (13) Dinescu D. I., Girard T. M., van Altena W. F. 1999, AJ, 117, 1792
- (14) Edvardsson B., Andersen J., Gustafsson B.,et al. 1993, AA, 275, 101
- (15) Edvardsson B., Gustafsson B., Nissen P. E. 1984, Msngr, 38, 33
- (16) Fuhrmann K. 1998, AA, 338, 161
- (17) Fuhrmann, K., Axer, M., & Gehren, T. 1995, AA, 301, 492
- (18) Fulbright P. 2000, AJ, 120, 1841
- (19) Gehren T. 1981, AA, 100, 97
- (20) Ghezzi L., Cunha K., Smith V. V., de Ara jo F. X., Schuler S. C., de la Reza R. 2010, AJ, 720, 1290
- (21) Gratton, R. G., & Sneden, C. 1987, AAS, 68, 193
- (22) Gratton, R. G., & Sneden, C. 1988, AA, 204, 193
- (23) Gratton, R. G., & Sneden, C. 1991, AA, 241, 501
- (24) Gratton R. G.; Carretta E.; Castelli F. 1996, AA, 314, 191
- (25) Hernquist L. 1990, ApJ, 356, 359
- (26) Jofré P., Heiter U., Soubiran C., Blanco-Cuaresma S., Worley C. C., Pancino E., Cantat-Gaudin T., Magrini L., Bergemann M., Gonzalez Hernandez J. I., Hill V., Lardo C., Laverny P. de, Lind K., Masseron T., Montes D., Mucciarelli A., Nordlander T., Recio Blanco A., Sobeck J., Sordo R., Sousa S. G., Tabernero H., Vallenari A., and Van Eck S. 2014, AA, 564, 133
- (27) Johnson D., Soderblom D., et al. 1987, Apj, 864, 867
- (28) Johnston K. V., Spergel D. N., Hernquist L. 1995, ApJ, 451, 598
- (29) Lambert D. L., Hinkle K., Luck R., et al. 1988, Apj, 333, 917
- (30) Leeuwen F., et al. 2007, AA, 653, 664
- (31) Magain, P. 1987, AA, 179, 176
- (32) Magain, P. 1989, AA, 209, 211
- (33) Maldonado J., Eiroa C., Villaver E., et al. 2012, AA, 541, 40
- (34) Mallik Sushma V. 1998, AA, 338, 623
- (35) McWilliam, A., Preston, G. W., Sneden, C., & Searle, L. 1995, AJ, 109, 2757
- (36) Mishenina T., Soubiran C., Kovtyukh V., et al. 2004, AA, 551, 562
- (37) Mishenina T., Pignatari M., Korotin S. A., et al. 2013, AA, 552, 128
- (38) Miyamoto M., Nagai R. 1975, PASJ, 27, 533
- (39) Moultaka J., Ilovaisky S. A., Prugniel P., & Soubiran C. 2004, PASP, 116, 693
- (40) Navarro, J. F., Abadi, M. G., Venn, K. A., et al. 2011, MNRAS, 412, 1203
- (41) Nissen P. E., Shuster W. J., et al. 2010, AA, 511, L10
- (42) Nissen, P. E. 2004, in Origin and Evolution of the Elements, Carnegie Observatories Astrophysics Series, Vol. 4, (Eds.) A. McWilliam and M. Rauch, Pasadena: Carnegie Observatories, 156
- (43) Nissen, P. E., et al. 1994, AA, 285, 440
- (44) Prugniel P., Vauglin I., Koleva M., 2011, AA, 531, 165
- (45) Peterson, R. C. 1981, AJ, 244, 989
- (46) Ramirez I., Allende Prieto C., Lambert D. L. 2007, AA, 465, 271
- (47) Reddy B. E., Lambert D. L., Allende Prieto C. 2006, MNRAS, 367, 1329
- (48) Schuster W. J., Parrao L., Contreras Martinez M. E., et al. 1993, AA, 97, 951
- (49) Sneden C., et al. 1973, Apj, 834, 839
- (50) Soubiran C., Bienayme O., Siebert A., et al. 2003, AA, 141, 151
- (51) Şahin T. 2013, ”LIME - Line Measurement from échelle Spectra”, Dig Sites of Stellar Archeology: Giant Stars in the Milky Way, Ege University Publication
- (52) Şahin T., & Lambert D. L. 2009, MNRAS, 398, 1730
- (53) Şahin T., Lambert D. L., Klochkova V. G., and Tavolganskaya N. S. 2011, MNRAS, 410, 612
- (54) Takeda Y. 2007, PASJ, 59, 335
- (55) Thevenin F., Vauclair S., Vauclair G. 1986, AA, 166, 216
- (56) Tomkin J., Lemke M., Lambert D. L., Sneden C. 1992, AJ, 104, 1568
- (57) Yoshida H. 1990, Phys Letter A, 150, 262
- (58) Wu Y., Singh H. P., Prugniel P., Gupta R., Koleva M. 2011, AA, 525, 71
- (59) Zhang H. W., Zhao G. 2005, MNRAS, 364, 712
- (60)