Topology, Length Scales and Energetics of Surfactant Micelles
Abstract
We investigate the morphology and energetics of a self-associating model cationic surfactant in water using coarse-grained molecular dynamics simulations. We develop an algorithm to track micelle contours and quantify various microstructural features, such as contour length, persistence length, and mesh size. We demonstrate that branched and multiconnected structures govern the anomalous dependence of zero-shear viscosity on salt concentration. We predict reliably the end-cap energy of micelles, for the first time, directly from the simulations.
In aqueous solutions, surfactant molecules spontaneously self-assemble into diverse geometrically complex and dynamically fluctuating morphologies. It has long been known that the emerging superstructures can range from spherical and elongated cylindrical to very long, flexible wormlike micelles with or without branches Debye51 ; Lequeux96 ; CatesCandau90 ; Danino95 ; Appell92 ; Magid97 ; Sangwai11 ; Lin94 ; Cardiel13 and topologically rich knotted structures Lin94 ; Cardiel13 . The diversity in microstructure and rheological properties make micellar solutions beneficial to numerous applications Maitland00 as hydrofracking fluids in oil industry, turbulent friction drag reducing agents Lin94 , thickening agents in consumer products, drug carriers in targeted delivery Weitz09 , and templates to create functional nanofluids with tunable mechanical or optical properties Nettesheim08 ; Helgeson10b ; Cong11 .
Since the early work of Debye Debye51 , the microstructural transitions in micellar solutions have been investigated both theoretically Israelachvili76 ; Mackintosh90 ; Shaul82 ; CatesCandau90 ; Odijk91 and experimentally Debye51 ; Danino95 ; Shikata94 ; Khatory93 . It is now well-recognized that the molecular structure of co-surfactant or salt has a spectacular effect on the morphology. In particular, aromatic organic salts have stronger binding affinity to the micelles and induce enormous growth. Consequently, micelles become very long, flexible and entangle even at relatively low surfactant concentration . Dilute solutions with spherical or short cylindrical structures exhibit Newtonian fluid rheology Shikata94 ; Khatory93 ; Vasudevan08 . In contrast, solutions above the overlap concentration consist of very long-thread like structures with contour lengths that span from a few 10s of nm to several m, and show viscoelastic behavior reminiscent of flexible polymer solutions CatesCandau90 ; Shikata94 ; Khatory93 . However, unlike polymers, WLMs can merge and undergo reversible breaking at time scales that are detectable both in scattering experiments and simulations. Under non-equilibrium conditions, such as, under shear flow, the structure, dynamics, and the resultant rheological properties could change dramatically: two notable examples are the shear induced structure (SIS) formation, and shear banding Khatory93 ; Shikata94 ; Vasudevan08 ; Keller98 ; Gonzalez04 ; Yesilata06 ; Nicolas12 ; Fielding04 ; Miller07 . Due to such dynamical complexities, a quantitative description of the microstructure of micellar fluids is incomplete. In this paper, we present a comprehensive simulation study of self-assembly, emerging structures, length scales, and the energetics of a model surfactant solution with explicit solvent, electrostatic and hydrodynamic interactions.
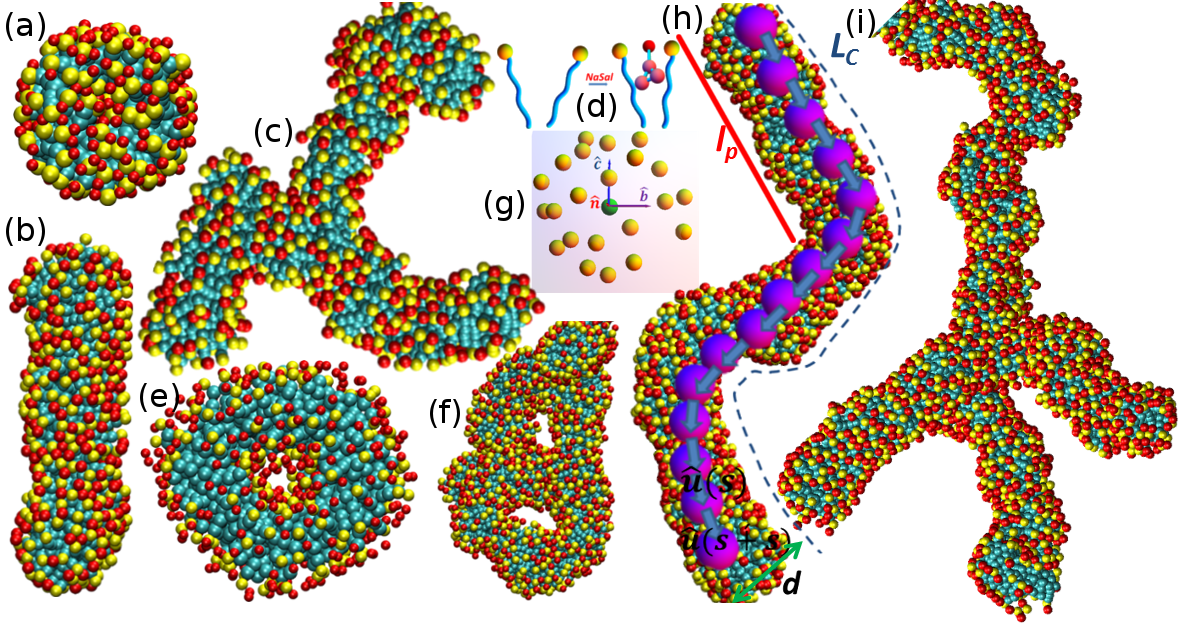
Despite decades of research aimed at understanding the structure and dynamics of micellar solutions, there are a few fundamental questions that still remain unanswered. First, although the scaling of average micelle length for neutral or highly electrostatically screened micelles is clear CatesCandau90 ; Mackintosh90 ; Odijk91 , how changes with and is not well understood at intermediate concentrations. Much remains unknown about the dependence of micelle length distribution on . In fact, contour length measurements of WLMs in the entangled regime by Cryo-TEM as well as light and neutron scattering experiments have not yielded a conclusive topological picture Lequeux96 . Second, the observed non-monotonic dependence with multiple maxima of zero-shear viscosity on Oelschlaeger10 ; Hoffmann94 cannot be rationalized within the framework of the existing theories. Third, the end-cap energy defined as excess energy of surfactants in the hemispherical region () compared to the energy of those on the cylindrical body () of a micelle, is generally inferred indirectly from rheological measurements Helgeson10b ; Larson14a ; Nettesheim08 . To help address these fundamental questions, we simulate aqueous complexes of cetyltrimethylammonium chloride (CTAC) surfactants and strongly binding aromatic counterions–Sodium Salicylate (NaSal). From these simulations, we enumerate micelle morphologies, outline a phase diagram, quantify the end-cap energy and uncover the relevant length scales that help shed light on the anomalous viscosity variations with respect to . Simulations utilize the coarse-grained MARTINI force field Marrink07 ; Sangwai11 and are performed using the LAMMPS software Plimpton95 in a constant NVT ensemble: see Supplemental Material supp for details of the simulations and a micelle contour tracking algorithm developed to quantify the length scales, , , and . Topologically rich structures that emerge at different are shown in Fig. 1.
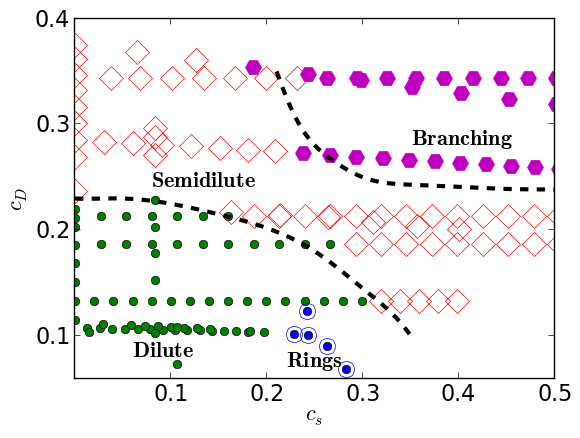
Phase diagram. Figure 2 outlines the phase diagram as functions of and . We determine the boundary separating the dilute and semidilute regimes from the overlap volume of the micelles. Assuming each micelles as a rigid cylinder, we compute the volume fraction , where , and are the micelle length, number of micelles, and the volume of the simulation box respectively. A solution with is considered dilute, while a solution above the overlap concentration consists of wormlike chains and is semidilute. On further increasing the concentration, branched or multiconnected structures form. To determine the boundary between the semidilute and branched regimes in the phase diagram, we calculate the number of nodes in the solution. Solutions with of the micelles having branches on average are considered as the branched phase. In a limited range of intermediate concentrations, we find micelles with handles [see Fig. 1(e-f)] and is shown by rings in Fig. 2. MD trajectory supp clearly demonstrates that toroidal micelles form via end-cap attachment of a flexible cylindrical micelle.
Shape transitions. It has been shown in earlier simulation studies Sangwai11 that micelle shape crucially depends upon the salt concentration. The mechanisms of this shape transformation can also be quantified by analyzing the free energy of an interfacial surfactant film when the film thickness is small compared to the neighboring layers. Mathematically, a surface embedded in can be fully characterized by the mean , and the Gaussian curvatures. In the small curvature limit, the free energy of the film is given by
| (1) |
where and are the bending moduli and is the spontaneous curvature of the film. For an amphiphile with surface area and liquid hydrocarbon volume , the packing parameter that minimizes the free energy in Eq. 1 is given by Israelachvili76
| (2) |
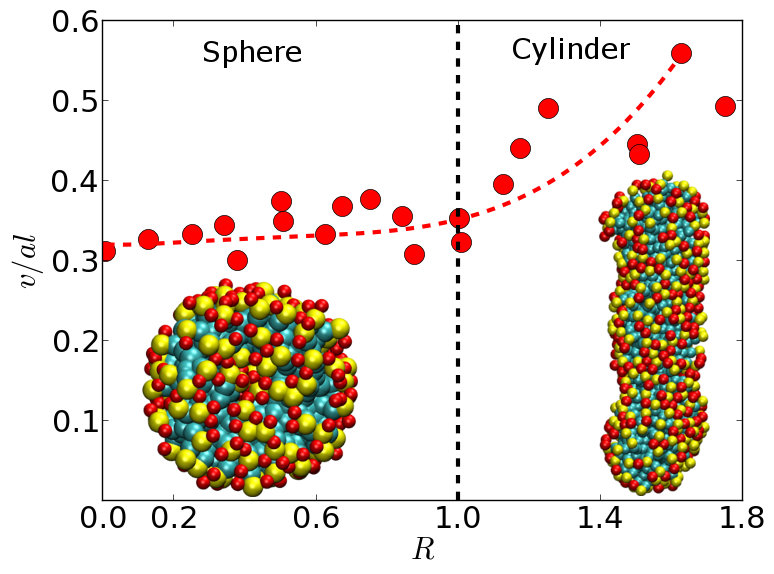
where is the length of the hydrocarbon tail. Focusing on the micelles shapes, we numerically calculate by mapping a small section of the interface to a Monge patch as illustrated in Fig. 1(g) which is fully described in SI supp . It is interesting to note that the normals at vertices are unambiguously defined from the orientations n of the amphiphilic molecules even at the umblic points. The average value of from these calculations over a range of is shown in Fig. 3. Without added salt or at lower salt concentrations, and the thermodynamically most favorable shape is a sphere. Upon increasing , Sal- ions interdigitate into the micelles surface [see Fig. 1(a-f)], thereby effectively screening the electrostatic interaction between the charged head groups [see Fig. 1(c)]. This effect gradually increases with increasing as shown by the decreasing effective surface area per surfactant in Fig. 3. In other words, the splay configuration costs more energy as compared to the uniform orientation of the molecules. This results in a more tightly packed structure leading to micelle growth along the major axis, and cylindrical micelles are energetically favorable.
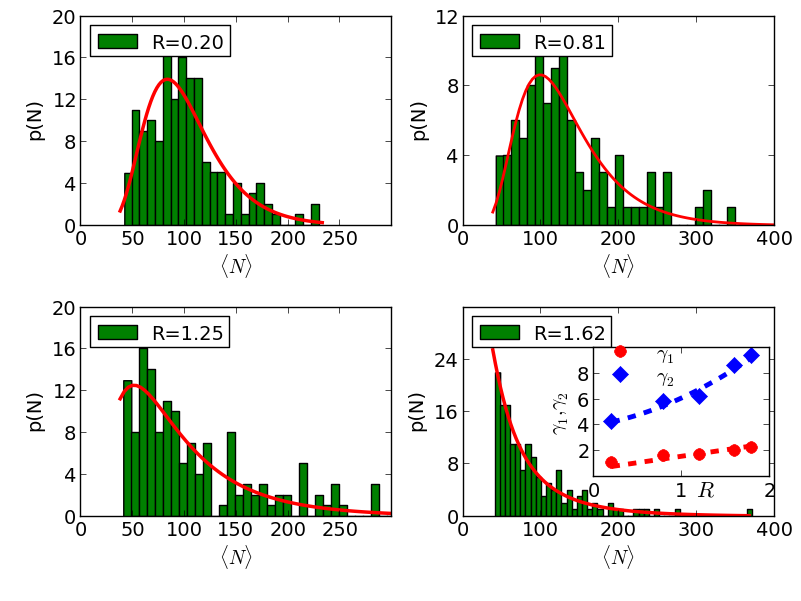
Micelle length distribution p(N). To provide insights into micelle length distributions, we simulate systems with various at a fixed . These simulations consist of one million atoms in a cubic box of dimensions . We conducted these simulations long enough () to capture the breakage and recombination dynamics of the micelles supp . Figure 4 shows the distribution of aggregation number for different . When , the distribution is an exponentially decaying function as shown in Fig.4(c-d). However, is log-normal rather than exponential for as evidenced from Fig.4(a-b). For , the Sal- ions condense non-uniformly over the micelles. It is possible, therefore, that electrostatic interactions in some micelles is only partially screened as compared to certain others. These results can be compared with the existing theories of Ref. CatesCandau90 ; Mackintosh90 , which argued that the interplay between entropy and the end-cap energy gives a broad, exponential distribution of lengths . Our results clearly show that this is not the case for charged micelles, at least when . Therefore, a more general distribution is suggested as:
| (3) |
The length distribution has a longer tail for a larger . To quantify these effects, we show the and moments (, and respectively) in the inset plots, and both increase with .
(a) (b)
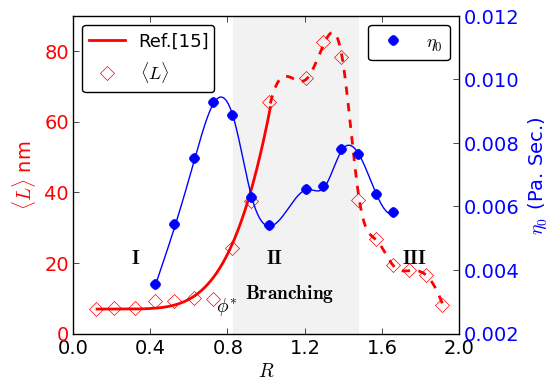
Contour length and zero-shear viscosity . To understand the morphological changes underlying the non-monotonic variation of with , we simulate systems with M for . Figure 5(a) plots and vs. . Broadly, we can classify these variations into three regimes. Region I is the growth regime, which is further divided into two sub-regimes: those below and above . For , there is a gradual rise of with increasing . However, increases sharply for in the semidilute regime. We interpret these results using an existing theory of micelle growth by MacKintosh et al. Mackintosh90 for charged micelles which predicts that , where is the renormalized end-cap energy, and , and are the radius of micelles , Bjerrum length and the effective charge per unit length of micelles respectively. To compare our simulations with Ref. Mackintosh90 , we calculate the Bjerrum length from the radial distribution function of the charge supp . Therefore, the effective charge per unit length of micelles Odijk91 . Using these estimates, we compare the predictions of the theory (thick solid line) with simulations (diamonds) in Fig. 5(a), and a very good agreement is found. In region II, as the branched or interconnected structures form, the contour length increases slightly and attains a maximum when a fully saturated network forms. Finally, upon further increasing (region III), the increased entropy of free Sal- ions in the solution favors more end-caps and decreases again.
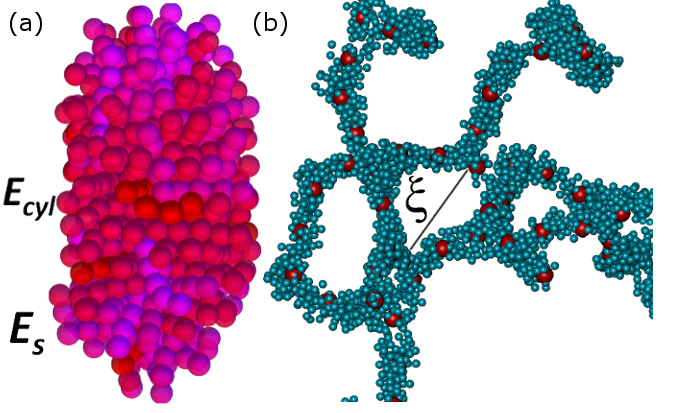
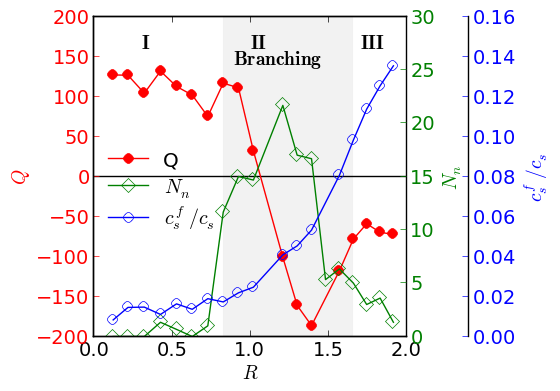
A key contribution of this study is uncovering the mechanisms that cause the anomalous variations of with respect to shown in Fig. 5(a). We extract from reverse non-equilibrium molecular dynamics (RNEMD) simulations Plathe99 ; supp . Interestingly, exhibits two maxima as observed in experiments for similar systems Hoffmann94 ; Oelschlaeger10 . To further understand the underlying structural changes, we show the average micelle charge Q, fraction of unbound counterions , and the node density in Fig. 5(b). We can correlate these data and micelle configurations with the viscosity changes. Initial increase in viscosity and in region I can be attributed to the transition from spherical or short cylindrical to wormlike micelles. Beyond this maximum, as shown in Fig. 5(b), because of the condensed counterions the effective micelle charge becomes negative, promoting favorable inter-micelle interactions. Consequently, as shown in Fig. 5(a), viscosity decreases for due to a transition from linear to branched micelles. Closer inspection of the microstructure reveals that some of the micelles are simply branched (Y junctions) or have multiple branches while some are even cross-linked (X junctions). This fact is illustrated by an increase of shown in Fig. 5(b). Such microstructures have previously been reported for several surfactant systemsDanino95 ; Appell92 ; Porte86 . In fact, these structures are less viscous than entangled networks Appell92 of WLMs, and offers a faster mechanism for stress relaxation by sliding the cross-links along the contour. Beyond the viscosity minimum at , micelle branches start to merge forming loops, resulting in a multiconnected network as shown in Fig. 6(b) of approximate mesh size . The viscosity increases upon network formation, and passes through a second maximum at when the network is fully saturated as signified by a maximum in in Fig. 5(b). The increase in viscosity from the branched state to the interconnected one is likely due to the increase rigidity of the network. Finally, in region III, the fraction of unbound counterions increases nonlinearly Shikata89 with increasing , and the increased electrostatic attraction between the free counterions and the bound surfactants results in a gradual disintegration of the network as evidenced by a decrease in . Consequently, micelles with branches or linear micelles are formed again. Hence, our simulations show that the following sequence of morphological transitions manifests as the double maxima observed for vs. in Refs. Hoffmann94 ; Oelschlaeger10 : spherical wormlike ()branched () multiconnected ()branched/wormlike ().
(a) (b)
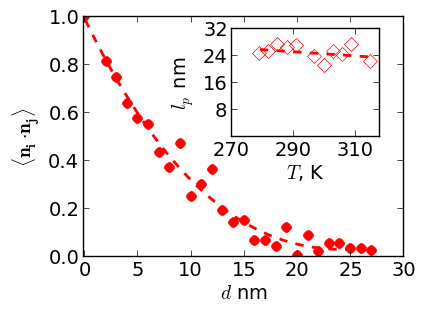
Persistence length . The global flexibility determines the viscoelastic properties of WLM solutions, where is the distance over which orientational correlations are lost. Flexible behavior is observed for , whereas for the micelles behave as rigid rods exhibiting I-N transition under shear flow Berret92 ; Gonzalez04 . To a first approximation, 1D bending modulus is defined as . From the constructed contour path of the WLM chain, as demonstrated in Fig. 1(h), we define the orientation vector along the contour. Figure 7(a) shows the tangent to tangent correlations , and the calculated at different . It is remarkable that the predicted value , and are both consistent with experiments Helgeson10b ; Oelschlaeger10 ; Larson14a . Additionally, the inset shows that is a constant over the temperature range of .
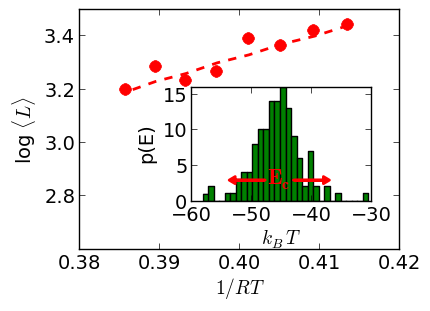
End-cap Energy . We present calculations of by two methods. In the first method, we extract it using the theory of Mackintosh et al. Mackintosh90 . Fig.7(b) plots vs. and confirms the Arrhenius dependence as predicted in Refs. Mackintosh90 ; Helgeson10b . From the slope of this plot we estimate an of , consistent with experiments Helgeson10b ; Shikata94 ; Nettesheim08 . Second, we evaluate directly by adding the pairwise interactions in simulations at . A color map of the chemical potential of the surfactants in a typical cylindrical micelle is shown in Figure 6(a). Inset shows the distribution of interaction energies of surfactants within a micelle, whose variance provides a direct measure of , which is in good agreement with the estimated value from the Arrhenius plot.
In summary, we have presented a quantitative analysis of the topology, length scales, and energetics of cationic surfactants micelle solution using extensive MD simulations. We have correlated the growth and branching of micelles with their viscosity, and proposed an underlying mechanism for the observed anomalies in viscosity upon increasing the salt concentration. Given that the model captures experimentally observed trends, we believe that framework presented here can offer an ideal platform to probe non-equilibrium phenomena in micellar fluids.
Acknowledgements.
This work used the computational resources provided by Science and Engineering Discovery Environment (XSEDE), which is supported by National Science Foundation grant number OCI-1053575. The authors acknowledged financial support by National Science Foundation under Grant No. 1049489 and 1049454.References
- (1) P. Debye and E. Anacker, J. Phys. Chem. 55, 644 (1951).
- (2) D. Danino, Y. Talmon, H. Levy, G. Beinert, and R. Zana, Science 269, 1420 (1995).
- (3) F. Lequeux, Current Opinion in Colloid Interface Science 1, 341 (1996).
- (4) M. Cates and S. Candau, Journal of Physics: Condensed Matter 2, 6869 (1990).
- (5) J. Appell, G. Porte, A. Khatory, F. Kern, and S. Candau, Journal de Physique II 2, 1045 (1992).
- (6) A. V. Sangwai and R. Sureshkumar, Langmuir 27, 6628 (2011); A. V. Sangwai and R. Sureshkumar, Langmuir 28, 1127 (2011).
- (7) J. J. Cardiel, A. C. Dohnalkova, N. Dubash, Y. Zhao, P. Cheung, and A. Q. Shen, Proc. Natl. Acad. Sci. U. S. A. 110, E1653 (2013).
- (8) Z. Lin, J. Cai, L. Scriven, and H. Davis, J. Phys. Chem. 98, 5984 (1994).
- (9) L. Magid, Z. Han, G. Warr, M. Cassidy, P. Butler, and W. Hamilton, The Journal of Physical Chemistry B 101, 7919 (1997).
- (10) G. C. Maitland, Current Opinion in Colloid Interface Science 5, 301 (2000),E. D. Burger, J. Rheol. 24, 603 (1980), S. Ezrahi, E. Tuval, and A. Aserin, Adv. Colloid Interface Sci. 77, 128 (2006).
- (11) B. Wang, H. C. Shum, and D. A. Weitz, ChemPhysChem 10, 641 (2009); J. A. Champion, Y. K. Katare, and S. Mitragotri, J. Control. Release 121, 3 (2007).
- (12) T. Cong, S. N. Wani, P. A. Paynter, and R. Sureshkumar, Appl. Phys. Lett. 99, 043112 (2011), D. Erickson, D. Sinton, and D. Psaltis, Nature Photonics 5, 583 (2011).
- (13) F. Nettesheim et al., Langmuir 24, 7718 (2008).
- (14) M. E. Helgeson, T. K. Hodgdon, E. W. Kaler, and N. J. Wagner, J. Colloid Interface Sci. 349, 1 (2010).
- (15) F. C. Mackintosh, S. A. Safran, and P. A. Pincus, Europhys. Lett. 12, 697 (1990).
- (16) J. N. Israelachvili, D. J. Mitchell, and B. W. Ninham, Journal of the Chemical Society, Faraday Transactions II 72, 1525 (1976).
- (17) A. Ben-Shaul and W. M. Gelbart, J. Phys. Chem. 86, 316 (1982).
- (18) T. Odijk, Biophys. Chem. 41, 23 (1991).
- (19) A. Khatory, F. Lequeux, F. Kern, and S. J. Candau, Langmuir 9, 1456 (1993).
- (20) T. Shikata, S. J. Dahman, and D. S. Pearson, Langmuir 10, 3470 (1994).
- (21) M. Vasudevan, A. Shen, B. Khomami, and R. Sureshkumar, J. Rheol. 52, 527 (2008); M. Vasudevanet al., Nature materials 9, 436 (2010).
- (22) S. Keller, P. Boltenhagen, D. Pine, and J. Zasadzinski, Phys. Rev. Lett. 80, 2725 (1998).
- (23) B. Yesilata, C. Clasen, and G. H. McKinley, J. Non Newtonian Fluid Mech. 133, 73 (2006 ).
- (24) A. Nicolas and A. Morozov, Phys. Rev. Lett. 108, 088302 (2012 ).
- (25) S. M. Fielding and P. D. Olmsted, Phys. Rev. Lett. 92, 084502 (2004 ).
- (26) E. Miller and J. P. Rothstein, J. Non Newtonian Fluid Mech. 143, 22 (2007).
- (27) M. Lopez-Gonzalez, W. Holmes, P. Callaghan, and P. Photinos, Phys. Rev. Lett. 93, 268302 (2004).
- (28) C. Oelschlaeger, P. Suwita, and N. Willenbacher, Langmuir 26, 7045 (2010).
- (29) H. Hoffmann,J. Phys. Chem. 578, 2 (1994), H. Rehage and H. Hoffmann, J. Phys. Chem. 92, 4712 (1988).
- (30) W. Zou and R. G. Larson, J. Rheol. 58, 681 (2014).
- (31) S. J. Marrink, H. J. Risselada, S. Yefimov, D. P. Tieleman, and A. H. de Vries, The Journal of Physical Chemistry B 111, 7812 (2007).
- (32) S. Plimpton, J Comp Phys, 117, 1 (1995).
- (33) Supporting information: contour tacking algorithm, RNEMD method, microstructures evolution.
- (34) F. Mller-Plathe, Physical Review E 59, 4894 (1999).
- (35) T. Shikata, H. Hirata, and T. Kotaka, Langmuir 5, 398 (1989).
- (36) J. Berret, D. Roux, G. Porte, and P. Lindner, Europhys. Lett. 25, 521 (1994).
- (37) G. Porte, R. Gomati, O. El Haitamy, J. Appell, and J. Marignan, J. Phys. Chem. 90, 5746 (1986).