Estimating R-Process Yields from Abundances of the Metal-Poor Stars
Abstract
The chemical abundances of metal-poor stars provide important clues to explore stellar formation history and set significant constraints on models of the r-process. In this work, we find that the abundance patterns of the light and iron group elements of the main r-process stars are very close to those of the weak r-process stars. Based on a detailed abundance comparison, we find that the weak r-process occurs in supernovae with a progenitor mass range of . Using the SN yields given by Heger & Woosley and the abundances of the weak r-process stars, the weak r-process yields are derived. The SNe with a progenitor mass range of are the main sites of the weak r-process and their contributions are larger than 80%. Using the abundance ratios of the weak r-process and the main r-process in the solar system, the average yields of the main r-process are estimated. The observed correlations of the [neutron-capture/Eu] versus [Eu/Fe] can be explained by mixing of the two r-process abundances in various fractions.
1 Introduction
Heavy elements are created in slow (s-process) and rapid (r-process) neutron-capture process (Burbidge et al., 1957). Although many authors thought that the r-process sites are related to Type II supernovae (SNeII) explosions (Cowan & Sneden, 2006; Arnould et al., 2007; Sneden et al., 2008), this has not yet been fully confirmed. To investigate the r-process sites, the chemical abundances of the metal-poor stars are important. Observed element abundances of the “main r-process stars” CS 22892-052 (Sneden et al., 2003) and CS 31082-001 (Hill et al., 2002) show that the heavy element (Z) patterns are very similar to the scaled solar r-process abundance pattern, while the lighter neutron-capture elements are deficient in the solar r-process pattern (Cowan & Sneden, 2006). This implies that the main r-process is not enough to explain the solar r-process pattern. In contrast, observations of the very metal-poor stars HD 122563 ([Eu/Fe]:Westin et al. (2000)) and HD 88609 (Honda et al., 2007) show that there is an excess of their lighter neutron-capture elements (e.g. Sr, Y and Zr). This indicates that their abundances could come from another component: “lighter element primary process” (Travaglio et al., 2004) or “weak r-process component” (Wanajo & Ishimaru, 2006; Izutani et al., 2009). Montes et al. (2007) have proposed that this abundance pattern is uniform and unique.
Based on the abundance analysis, Roederer et al. (2010a) found that the abundances of other metal-poor stars seemed to lie in the continuum between the patterns of the main r-process stars and the weak r-process stars. In this case, they presented the idea that the abundances of CS 22892-052 and HD 122563 could not be two standard patterns of the r-process. They proposed that the two patterns may represent the complete r-process and the incomplete r-process, respectively, and suggested that the mixing of two patterns should not be responsible for the large range of observed [Y/Eu] of the metal-poor stars. Recently, Boyd et al. (2012) proposed that the heavy elements observed in some metal-poor stars, such as HD 122563, are produced by the incomplete r-process, since the massive stars collapse to black holes to truncate the r-process. They found that the calculated result can not match the abundances of weak r-process star HD 122563 and suggested that more exploration of truncated r-process is needed.
The abundances of heavy elements and light elements in the extreme metal-poor stars ([Fe/H]) can provide significant clues about r-process nucleosynthesis, because their abundances should keep the abundance characteristics produced by a few SNe (McWilliam et al., 1995a, b). In this aspect, the main r-process stars merit special attention. Their abundances could reflect results of the main r-process nucleosynthesis that occurred in a SN. The very high ratios of [neutron-capture/Fe] imply that the production of main r-process elements does not couple with the iron group elements (Qian & Wasserburg, 2007). On the other hand, the abundances of weak r-process stars should be close to the results for the weak r-process nucleosynthesis. The ratios of [Sr/Fe] mean that ejection of weak r-process elements from a SN couple occurs with the ejection of iron group elements. So, the abundances of weak r-process elements should couple with the abundances of light elements and iron group elements. Recently, Li et al. (2013c) derived the main r-process and weak r-process components and used them to study the stellar abundances (Li et al., 2013a, b).
Although the r-process sites can be studied by comparing the model predictions with the observed abundances, the different studies obtained different conclusions (e.g. Travaglio et al. (1999); Cescutti (2008)). Recently, Matteucci et al. (2014) studied the Eu yields in compact binary mergers (CBM) and found that CBM should be responsible for Eu abundances in the Galaxy. However, they reported that the time of the binary neutron star mergers and the progenitor mass range of neutron stars are still uncertain. Although many models have been presented, the r-process nucleosynthesis sites producing the neutron-capture elements of the metal-poor stars are still unknown. In this case, the detailed analyses about the correlation between the abundances of the light and iron group elements with those of the neutron-capture elements in metal-poor stars should be important. In this paper, we extract abundance clues by comparing the abundance patterns between the main r-process stars and the weak r-process stars in section 2. In Section 3, the progenitor mass ranges of the weak r-process and main r-process are investigated. The quantitative estimates for the average yields of the weak r-process and the main r-process are presented in section 4. In section 5, the explanation of correlations between [Xi/Eu] and [Eu/Fe] are given. Section 6 is our conclusions.
2 Abundance Clues
The elements (e.g. Mg, Si, Ca and Ti) in the metal-poor stars are definitely produced in massive stars (Woosley et al., 1995; Heger & Woosley, 2010). To investigate the relationship between the abundances of elements and main r-process elements, the observed abundance ratios of [/Eu] as the function of [Eu/Fe] for metal-poor stars (Westin et al., 2000; Cowan et al., 2002; Hill et al., 2002; Johnson, 2002; Sneden et al., 2003; Christlieb et al., 2004; Honda et al., 2004; Barklem et al., 2005; Ivans et al., 2006; Lai et al., 2008; Hayek et al., 2009; Mashonkina et al., 2010; Roederer et al., 2010b) are shown in Figure 1. Clearly, the relationships of [/Eu] versus [Eu/Fe] in Figure 1 are close to straight lines with slopes of approximately -1. This indicates that the elements are not correlated with Eu. This noncorrelations imply that the mass ranges of the massive stars producing the elements are different from those of the progenitors of SNe II from which the main r-process elements are ejected. Furthermore, the observations also mean that the gas clouds in which main r-process stars formed have been polluted by the nucleosynthesis process producing the elements in the massive stars.
Although the r-process sites have not been fully confirmed, much evidence suggests that the r-process is related to SNe II from massive stars (Sneden et al., 2008). For investigating the mass range of the progenitor in which the r-process occurs, the stellar abundances mainly polluted by one process, such as the abundances of the light elements and iron group elements in main r-process stars and weak r-process stars, are significant since they can be compared with the nucleosynthesis calculations.
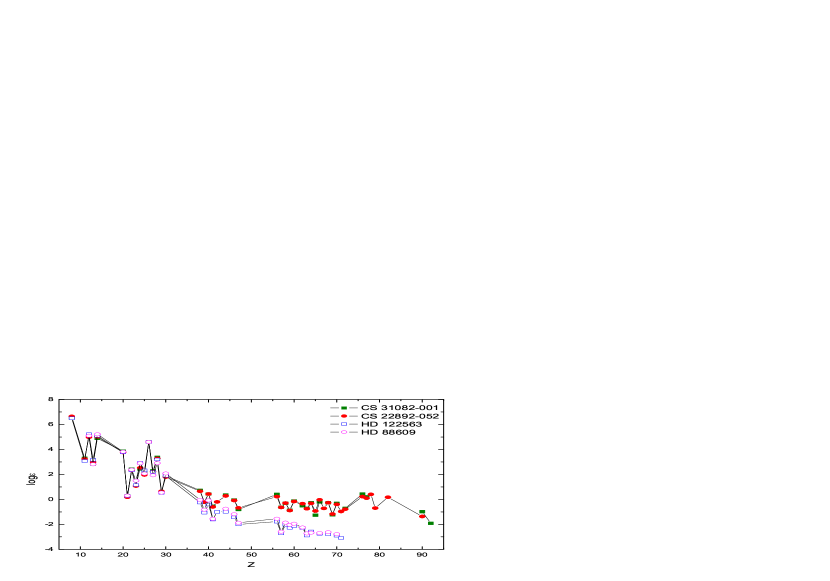
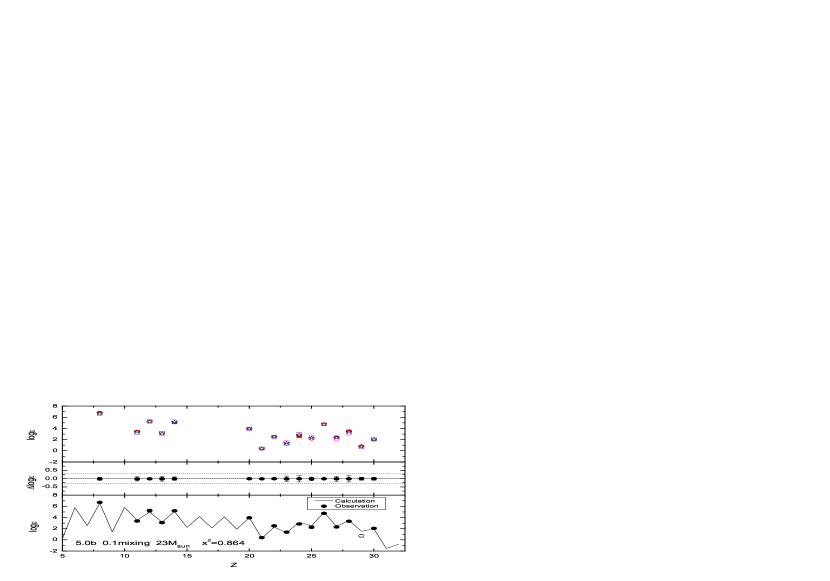
In Figure 2, the comparisons of the abundances of the weak r-process stars (Honda et al., 2004, 2006, 2007) with those of the main r-process stars (Hill et al., 2002; Sneden et al., 2003, 2008) are shown, in which the abundances of HD 88609, CS 22892-052 and CS 31082-001 have been normalized to the Fe abundance of HD 122563. Obviously, the weak r-process stars HD 122563 and HD 88609 have similar abundance patterns: excesses of light neutron-capture elements and underabundances of heavy neutron-capture elements, which is different than the abundance patterns of the main r-process stars. Although the abundance patterns of neutron-capture elements for the weak r-process stars and main r-process stars are obviously different, it is noteworthy that their abundance patterns for light elements and iron group elements are close to each other. In this case, we first normalize the abundances of the light elements and iron group elements of HD 88609, CS 22892-052 and CS 31082-001 to those of HD 122563 and derive the average abundance pattern of four sample stars. Then, the abundances of the light elements and iron group elements of the four stars are normalized to the average abundance pattern. The top panel of Figure 3 shows the average abundance pattern and the best-fit results for four sample stars. There is good agreement between the average abundance pattern and the observed data for the four stars from O to Zn. The rms offsets of these elements are shown in the middle panel. Obviously, the average abundances are a good, representative pattern of the light elements and iron group elements for the weak r-process stars and main r-process stars. Because the abundance patterns of these stars are mainly polluted by a few nucleosynthesis events, the similarity in the abundance patterns of light elements and iron group elements between the weak r-process stars and main r-process stars means that the abundance pattern is stable and universal. Although the abundances of neutron-capture elements are different obviously, the astrophysical origins of the light elements and iron group elements in these two kinds of stars should be similar.
3 The Range of Progenitor Mass
The weak r-process and main r-process are associated with a core-collapse SNe explosion, but the astrophysical sites have not yet been fully confirmed. Whether or not the light and iron group elements are ejected by a core-collapse SNe relate to the progenitors’ masses. Two mass ranges of the massive stars should lead to a core-collapse SNe: the O-Ne-Mg core-collapse SNe with an initial mass of and the Fe core-collapse SNe with an initial mass of (Qian & Wasserburg, 2007). Our goal is to investigate the mass range of the progenitors of the SNe in which the weak r-process occurred. To find the mass range of the progenitors producing the abundance pattern of light and iron group elements of the weak r-process stars, we use the single SN yields presented by Heger & Woosley (2010) to fit the average abundances of four stars (from O to Zn). The best-fit result is shown in the bottom panel of Figure 3. We find that the average abundances are best matched by a progenitor mass of with . Taking a mass interval of for , Figure 4 displays the calculated lower limit of as a function of the progenitor mass. Obviously, the lower limit of is sensitive to the progenitor mass. The average abundance pattern can be fitted by the yields of the massive stars of , with . The fitted results are significant evidence that the weak r-process occurs in the supernova with the progenitor masses of . Furthermore, because the sites producing the main r-process elements do not produce light and iron group elements, this process must occur in the supernova with progenitor masses of . Boyd et al. (2012) have suggested that the r-process elements may be produced in the massive stars with . The fitted results lie in their progenitor mass range.
4 Estimating the R-process Yields
Using the light element yields of a single SN calculated by Heger & Woosley (2010) and the weak r-process abundance pattern presented by Li et al. (2013c), it was possible to derive the weak r-process yields. The relationship between weak r-process yields and weak r-process abundance is
| (1) |
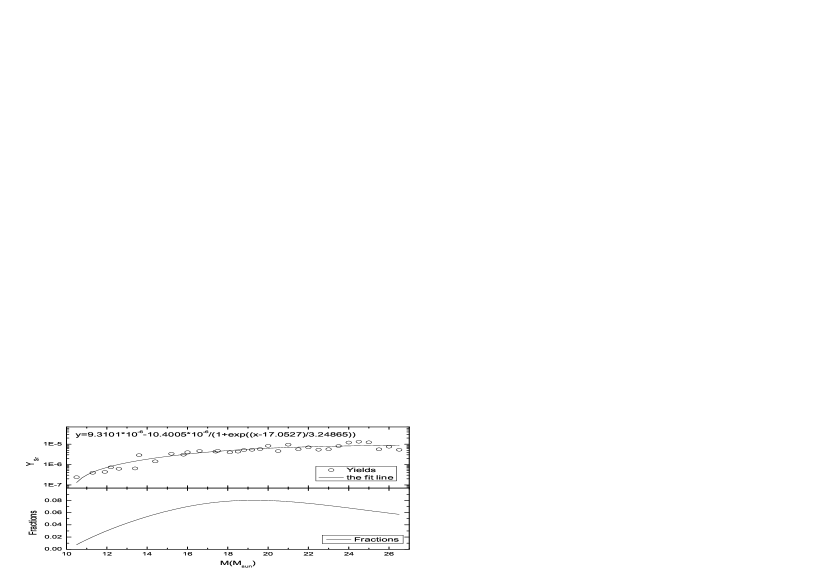
where is atomic weight. Combining the light element yields calculated by Heger & Woosley (2010) and equation (1), we obtain the Sr yields as a function of progenitor mass, which are shown in the top panel in Figure 5. The Sr yields increase with the progenitor mass and reach a maximum at about at . Assuming a Salpeter initial mass function (IMF), the normalized fractions of Sr yields in weak r-process per unit mass interval (in units of solar mass) compared to the total contribution from are shown in the bottom panel of Figure 5. The calculated results indicate that the SNe with a progenitor mass range of 15 are the main sites of the weak r-process. The contributions of the SNe to the abundances of the weak r-process elements in our galaxy are larger than 80%. The average weak r-process yields produced by one weak r-process event, which have been weighted by the Salpeter IMF, are listed in Table 1.
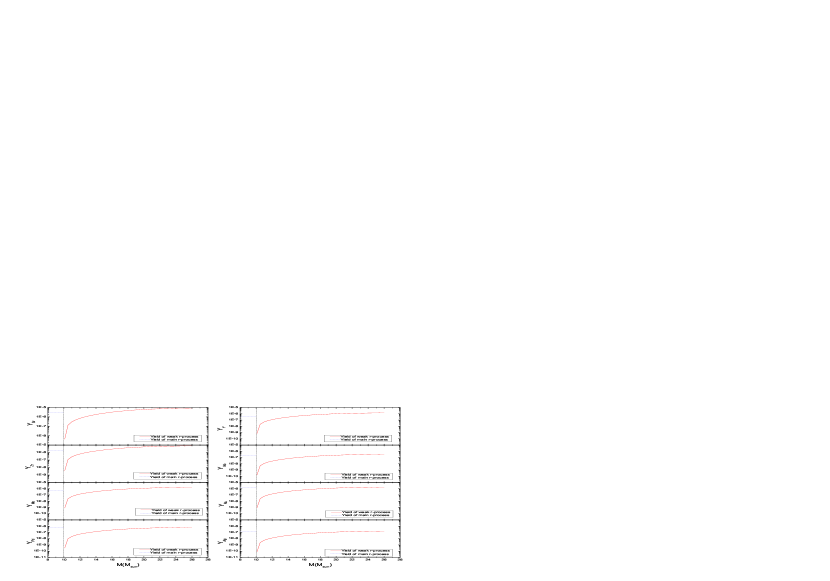
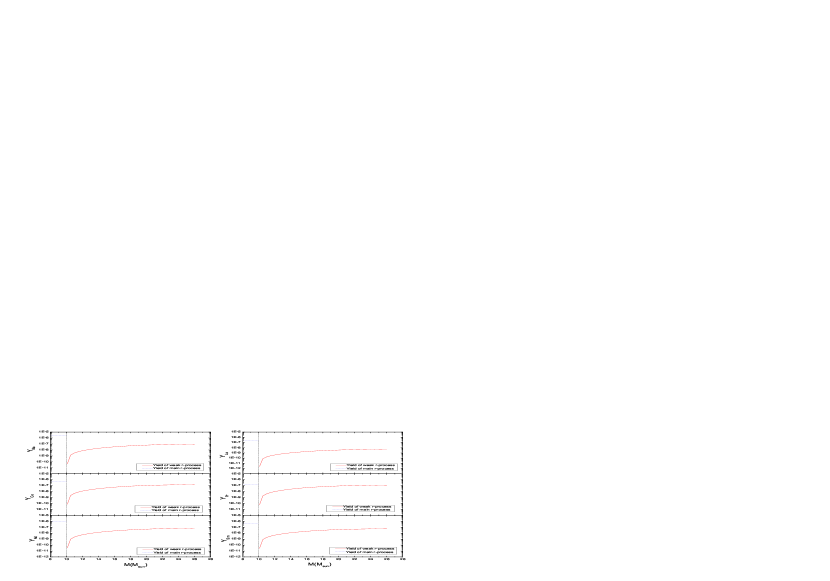
Because the solar r-process abundances can be matched by main r-process and weak r-process abundances obtained from the metal-poor stars (Li et al., 2013c), the two r-process patterns are independent of metallicity. In this case, the solar r-process pattern has been divided into two components. The r-weak:r-main ratios for Sr, Y and Zr are about 0.66:0.34, 0.74:0.26 and 0.73:0.27, respectively. Assuming the Salpeter IMF, the number ratio of the massive stars with to the massive stars with is about 1.9. Taking Sr as a representative element and using the average Sr yield listed in Table 1, the average Sr yield of one main r-process event is derived to be about . Adopting this method, we obtained the average yields of the other neutron-capture elements, which are listed in Table 2. In Figures 6 and 7, the estimated yields of the weak r-process versus the progenitor mass are plotted by curves. The straight lines represent the average yields of the main r-process. For convenient comparison, the dash lines divide each picture into two parts. Our calculated results are based on the assumption that the main r-process occurs in the SN II. Note that Matteucci et al. (2014) have suggested that CBM should be responsible for Eu abundances in the Galaxy. Considering the contributions of the CBM to the abundances of the r-process elements, the yields of the r-process listed in the Table 1 and Table 2 should be the upper limits of the yields produced in the SNe II. Obviously, more investigations on this subject are needed.
5 Explanations of the Correlations between [Xi/Eu] and [Eu/Fe]
Montes et al. (2007) have found that the slopes of [Xi/Eu] versus [Eu/Fe] for the lighter neutron-capture elements are about -1 for [Eu/Fe]1.0. However, the ratios of the [Xi/Eu] flattened for higher [Eu/Fe]. Recently, Boyd et al. (2012) suggested that the heavy elements of some metal-poor stars, such as HD 122563, are produced by the “truncated r-process”, because the more massive stars collapse to black holes before the r-process is completed. However, their calculated result demonstrates that the truncated r-process predictions can only explain the downward abundance trend as atomic number increases and cannot match the abundances of HD 122563. Obviously, more exploration of the truncated r-process is needed (Boyd et al., 2012).
The average ratios [Sr/Fe] of weak r-process stars and main r-process stars are about -0.15 and 0.6 respectively. However, there are some low-Sr stars ([Sr/Fe]-1) in the metal-poor stars (see Fig. 8 in Hansen et al. (2012)), which means that there is another component barely producing neutron-capture elements in the early Galaxy. This component was called the prompt (P) component (Qian & Wasserburg, 2001). Once the SNe II in which r-process elements are produced began to pollute the interstellar medium, the effect of the P component became smaller (Qian & Wasserburg, 2001). In this section, we wish to explain the observed trends of [Xi/Eu] versus [Eu/Fe] quantitatively using derived yields of the two r-processes, so our sample stars do not contain the low-Sr stars.
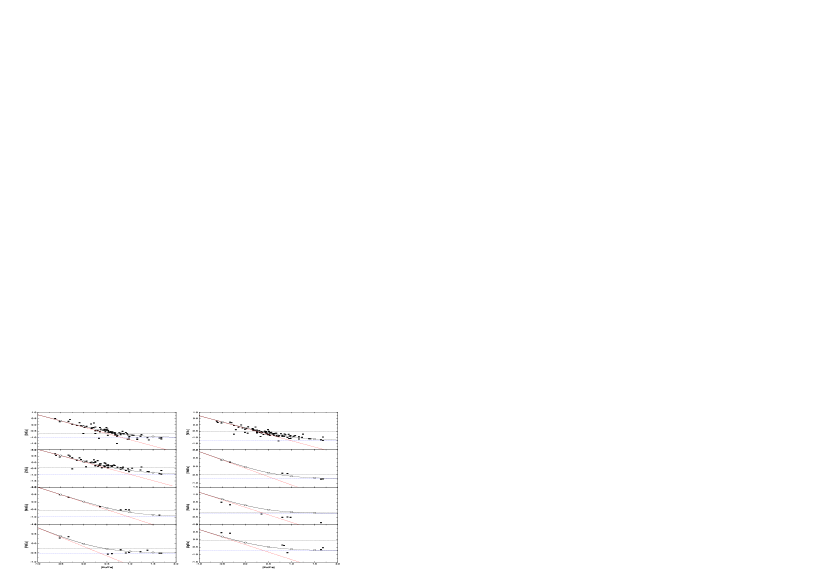
Figure 8 shows the relationships between [Xi/Eu] and [Eu/Fe], where Xi are the abundances of lighter neutron-capture elements. The filled squares are the observed ratios of the metal-poor stars (Westin et al., 2000; Cowan et al., 2002; Hill et al., 2002; Johnson, 2002; Sneden et al., 2003; Christlieb et al., 2004; Honda et al., 2004; Barklem et al., 2005; Honda et al., 2006; Ivans et al., 2006; François et al., 2007; Honda et al., 2007; Lai et al., 2008; Hayek et al., 2009; Mashonkina et al., 2010; Roederer et al., 2010a, b). The dash lines correspond to the average abundance ratios of weak r-process stars, whose slopes are -1. The dotted lines represent the abundance ratios polluted by pure main r-process material. For comparison, we added the dash dotted lines to represent the solar r-process ratios, which are adopted from Arlandini et al. (1999) and updated from Travaglio et al. (2004) for the ratios of Sr-Nb. Obviously, the large scatter of abundance ratios [Xi/Eu] of the metal-poor stars cannot be explained by the corresponding solar r-process ratios. We find that the observed abundance ratios are close to the dash lines for [Eu/Fe]0. The reason of the abundance ratios decrease linearly with increasing [Eu/Fe] for [Eu/Fe]0 is that these elements mainly come from the weak r-process. Obviously, the observed abundance ratios are close to the main r-process lines but not the weak r-process lines for [Eu/Fe]1.0. The reason for flattened [Xi/Eu] at higher [Eu/Fe] is that more contributions come from the main r-process. In order to explain the observed trends of the abundance ratios, we calculated the mixing of the weak r-process abundances and the main r-process abundances with different proportions, which are plotted by the solid lines. We can see that the mixing lines are perfectly consistent with the abundance trends. The results mean that the abundance trends can be explained by the contributions of two r-processes. The fractions of the main r-process that contributed to the abundances of the lighter neutron-capture elements for the various [Eu/Fe] plotted by open circles in Figure 8 are listed in Table 3. We can see that, for the weak r-process stars, the fractions of the weak r-process that contributed to lighter neutron-capture elements (from Sr to Ag) lie in the range of 87%-97%. On the other hand, for the main r-process stars, the contributed fractions of the main r-process are larger than 77%. Based on calculations of the r-process triggered by SNe II explosions, Hansen et al. (2012) showed in their Table 3 that the percentages contributed by the main r-process increase with the increasing atomic number for a given electron fraction. From Table 3, we can see that the fractions contributed by the main r-process to the abundances of the neutron-capture elements increase as the atomic number increases for a given [Eu/Fe]. The results should suggest that the increasing trends are the common phenomenon for the low metallicity.
6 Conclusions
The abundances, especially the abundance patterns, of metal-poor stars can provide important constraints on the r-process sites. In this aspect, the detailed abundance analysis approach might provide some helpful clues to how the core-collapse SNe relate to the r-process. Our results can be summarized:
1. The slopes of [/Eu] versus [Eu/Fe] are roughly consistent with -1. This indicates that the abundances of elements do not related to those of the main r-process elements. This noncorrelation implies that the mass range of the massive stars in which the elements are produced is different from the mass range of the progenitor of the SNe II in which the main r-process occurs.
2. The abundance patterns of light and iron group elements of the main r-process stars are very close to those of weak r-process stars. This indicates that, although the ratios of [Eu/Fe] are obviously different, the light and iron group elements of main r-process stars and those of weak r-process stars should come from massive stars with similar mass range. So, the abundances of the main r-process stars also contain contributions from the weak r-process. The difference in Eu abundances between the weak r-process stars and the main r-process stars is mainly due to a different polluted level of the main r-process.
3. The calculated results imply that the weak r-process occurs in the supernovae with a progenitor mass range of 11-26. The SNe with progenitor mass range of are the main origins of the weak r-process elements. The average yields of one weak r-process event had been derived.
4. The main r-process elements are produced in the supernovae with progenitor masses of . Using the contributed ratios of the weak r-process and the main r-process to the solar system, the average yields of one main r-process event are estimated.
5. For the weak r-process stars, the fractions of the weak r-process that contributed to lighter neutron-capture elements lie in the range of 87%-97%. For the main r-process stars, the contributed fractions of the main r-process are larger than 77%. The observed correlations between the [neutron-capture/Eu] versus [Eu/Fe] can be explained by the mixing of the weak r-process abundances and the main r-process abundances.
Our results could present some constraints for detailed r-process models. Obviously, more detailed studies about the weak r-process and the main r-process are needed.
References
- Arlandini et al. (1999) Arlandini, C., Kppeler, F., Wisshak, K., Gallino, R., Lugaro, M., Busso, M., & Straniero, O. 1999, ApJ, 525, 886
- Arnould et al. (2007) Arnould M., Goriely S., & Takahashi K., 2007, Phys. Rep., 450, 97
- Barklem et al. (2005) Barklem, P. S., et al. 2005, A&A, 439, 129
- Boyd et al. (2012) Boyd, R. N., Famiano, M. A., Meyer, B. S., Motizuki, Y., Kajino, T., Roederer, I. U. 2012, ApJ, 744, L14
- Burbidge et al. (1957) Burbidge, E. M., Burbidge, G. R., Fowler, W. A., & Hoyle, F. 1957, Rev. Mod. Phys, 29, 547
- Cescutti (2008) Cescutti, G. 2008, A&A, 481, 691
- Christlieb et al. (2004) Christlieb, et al. 2004, A&A, 428, 1027
- Cowan & Sneden (2006) Cowan, J. J., & Sneden, C. 2006, Nature, 440, 1151
- Cowan et al. (2002) Cowan, J. J., et al. 2002, ApJ, 572, 861
- François et al. (2007) François, P., et al. 2007, A&A, 476, 935
- Hansen et al. (2012) Hansen, C. J., et al. 2012, A&A, 545, A31
- Hayek et al. (2009) Hayek, W., et al. 2009, A&A, 504, 511
- Heger & Woosley (2010) Heger, A., & Woosley, S. E. 2010, ApJ, 724, 341
- Hill et al. (2002) Hill, V., et al. 2002, A&A, 387, 560
- Honda et al. (2007) Honda, S., Aoki, W., Ishimaru, Y., Wanajo, S. 2007, ApJ, 666, 1189
- Honda et al. (2006) Honda, S., Aoki, W., Ishimaru, Y., Wanajo, S., Ryan, S. G. 2006, ApJ, 643, 1180
- Honda et al. (2004) Honda, S., Aoki, W., Kajino, T., Ando, H., Beers, T. C., Izumiura, H., Sadakane, K., Takada-Hidai, M. 2004, ApJ, 607, 474
- Ivans et al. (2006) Ivans I., Simmerer J., Sneden, C., Lawler, J. E., Cowan, J. J., Gallino, R., Bisterzo, S. 2006, ApJ, 645, 613
- Izutani et al. (2009) Izutani, N., Umeda, H., Tominaga, N. 2009, ApJ, 692, 1517
- Johnson (2002) Johnson, J. 2002, ApJS, 139, 219
- Lai et al. (2008) Lai, D. K., Bolte, M., Johnson, J. A., Lucatello, S., Heger, A., & Woosley, S. E. 2008, ApJ, 681, 1524
- Li et al. (2013a) Li, H. J., Cui, W. Y., Zhang, B. 2013a, ApJ, 775, 12
- Li et al. (2013b) Li, H. J., Liang, S., Cui, W. Y., Zhang, B. 2013b, PASA, 30, 15
- Li et al. (2013c) Li, H. J., Shen, X. J., Liang, S., Cui, W. Y., Zhang, B. 2013c, PASP, 125, 143
- Mashonkina et al. (2010) Mashonkina, L., Christlieb, N., Barklem, P. S., Hill, V., Beers, T. C., Velichko, A. 2010, A&A, 516, 46
- Matteucci et al. (2014) Matteucci, F., Romano, D., Arcones, A., Korobkin, O., Rosswog, S. 2014, MNRAS, 438, 2177
- McWilliam et al. (1995a) McWilliam, A., Preston, G. W., Sneden, C., & Searle, L. 1995a, AJ, 109, 2757
- McWilliam et al. (1995b) McWilliam, A., Preston, G. W., Sneden, C., & Shectma, S. 1995b, AJ, 109, 2736
- Montes et al. (2007) Montes, F., et al. 2007, ApJ, 671, 1685
- Qian & Wasserburg (2001) Qian, Y.-Z., Wasserburg, G. J., 2001, ApJ., 559, 925
- Qian & Wasserburg (2007) Qian, Y.-Z., Wasserburg, G. J., 2007, Phys. Rep., 442, 237
- Roederer et al. (2010a) Roederer, I. U., Cowan, J. J., Karakas, A. I., Kratz, K-L, Lugaro, M., Simmerer, J., Farouqi, K., Sneden, C. 2010a, ApJ, 724, 975
- Roederer et al. (2010b) Roederer, I. U., Sneden, C., Thompson, I. B., Preston, G. W., & Shectman, S. A. 2010b, ApJ, 711, 573
- Sneden et al. (2008) Sneden, C., Cowan, J. J., & Gallino, R. 2008, ARA&A, 46, 241
- Sneden et al. (2003) Sneden, C., et al. 2003, ApJ, 591, 936
- Travaglio et al. (1999) Travaglio, C., Galli, D., Gallino, R., Busso, M., Ferrini, F., & Straniero, O. 1999, ApJ, 521, 691
- Travaglio et al. (2004) Travaglio, C., Gallino, R., Arnone, E., Cowan, J., Jordan, F., & Sneden, C. 2004, ApJ, 601, 864
- Wanajo & Ishimaru (2006) Wanajo S., Ishimaru, Y. 2006, Nucl. Phys. A, 777, 676
- Westin et al. (2000) Westin, J., Sneden, C., Gustafsson, B., Cowan, J. J. 2000, ApJ, 530, 783
- Woosley et al. (1995) Woosley, S. E., & Weaver, T. A. 1995, ApJS, 101, 181


| Z | element | Yield() | Z | element | Yield() |
|---|---|---|---|---|---|
| 38 | Sr | 3.14E-06 | 47 | Ag | 5.68E-08 |
| 39 | Y | 5.18E-07 | 56 | Ba | 3.21E-08 |
| 40 | Zr | 2.81E-06 | 57 | La | 1.75E-09 |
| 41 | Nb | 1.18E-07 | 58 | Ce | 5.25E-08 |
| 42 | Mo | 5.94E-07 | 59 | Pr | 4.34E-08 |
| 44 | Ru | 6.35E-07 | 60 | Nd | 2.38E-08 |
| 46 | Pd | 2.33E-07 | 62 | Sm | 2.02E-08 |
| Z | element | Yield() | Z | element | Yield() |
|---|---|---|---|---|---|
| 38 | Sr | 3.06E-06 | 65 | Tb | 1.13E-07 |
| 39 | Y | 3.52E-07 | 66 | Dy | 1.03E-06 |
| 40 | Zr | 1.92E-06 | 67 | Ho | 2.64E-07 |
| 41 | Nb | 1.83E-07 | 68 | Er | 7.33E-07 |
| 42 | Mo | 4.30E-07 | 69 | Tm | 8.61E-08 |
| 44 | Ru | 1.64E-06 | 70 | Yb | 5.79E-07 |
| 46 | Pd | 6.97E-07 | 71 | Lu | 1.58E-07 |
| 47 | Ag | 1.52E-07 | 72 | Hf | 2.89E-07 |
| 56 | Ba | 2.30E-06 | 76 | Os | 3.46E-06 |
| 57 | La | 2.64E-07 | 77 | Ir | 2.47E-06 |
| 58 | Ce | 5.56E-07 | 78 | Pt | 4.14E-06 |
| 59 | Pr | 1.46E-07 | 79 | Au | 3.30E-07 |
| 60 | Nd | 8.24E-07 | 82 | Pb | 2.58E-06 |
| 62 | Sm | 4.29E-07 | 90 | Th | 1.37E-07 |
| 63 | Eu | 2.27E-07 | 92 | U | 2.24E-08 |
| 64 | Gd | 7.28E-07 |
| [Eu/Fe] | Sr | Y | Zr | Nb | Mo | Ru | Pd | Ag |
|---|---|---|---|---|---|---|---|---|
| -0.5 | 0.05 | 0.03 | 0.03 | 0.07 | 0.03 | 0.11 | 0.13 | 0.12 |
| 0 | 0.13 | 0.10 | 0.10 | 0.19 | 0.10 | 0.29 | 0.32 | 0.29 |
| 0.5 | 0.32 | 0.25 | 0.25 | 0.43 | 0.26 | 0.56 | 0.60 | 0.57 |
| 1 | 0.60 | 0.51 | 0.52 | 0.71 | 0.53 | 0.80 | 0.82 | 0.81 |
| 1.5 | 0.83 | 0.77 | 0.77 | 0.88 | 0.78 | 0.93 | 0.94 | 0.93 |