Measurement of the 10 keV resonance in the 10B()7Be reaction via the Trojan Horse Method
Abstract
The 10B(p,)7Be bare nucleus astrophysical S(E)-factor has been measured for the first time at energies from about 100 keV down to about 5 keV by means of the Trojan Horse Method (THM). In this energy region, the S(E)-factor is strongly dominated by the 8.699 MeV 11C level (Jπ=+), producing an s-wave resonance centered at about 10 keV in the entrance channel. Up to now, only the high energy tail of this resonant has been measured, while the low-energy trend is extrapolated from the available direct data. The THM has been applied to the quasi-free 2H(10B,7Be)n reaction induced at a boron-beam energy of 24.5 MeV. An accurate analysis brings to the determination of the 10B(p,)7Be S(E)-factor and of the corresponding electron screening potential , thus giving for the first time an independent evaluation of it.
pacs:
Valid PACS appear hereI Introduction
Boron depleting reactions play an important role in understanding different scenarios, ranging from astrophysics to applied nuclear physics. In particular, the measurements of (p,) reactions on boron, beryllium and lithium isotopes are of particular interest to determine light element abundances in stars. These elements are destroyed at different depths in stellar interiors and residual (atmospheric) abundances can be used to constrain mixing phenomena occurring in such stars Boesgaard et al. (2005). Boron burning is triggered at temperatures T5106 K and takes place mainly through (p,) processes, with a Gamow peak Rolfs and Rodney (1988) centered at about 10 keV. In this context, the 10B(p,)7Be reaction, for which 7Be nuclei is left in its ground-state, has special interest. Its cross section at the Gamow energy (EG) is in fact dominated by the contribution of the 8.699 MeV 11C level (Jπ=, producing an s-wave resonance centered at about 10 keV.
As for applied nuclear physics, proton-induced reactions on natural boron natB, containing 11B (80) and 10B ( 20), have been considered as possible candidates for “clean-fusion” processes for energy production Peterson et al. (1975). However, since the 10B(p,)7Be reaction is origin of radioactive fuel contamination by 7Be, its cross-section must be precisely known at typical energies 100 keV, where the resonant contribution strongly influences the cross-section behavior.
However, direct cross section measurements at ultra low energies are extremely difficult to be performed, mainly because of the Coulomb barrier penetrability that reduces the cross section to values as small as few Rolfs and Rodney (1988) and because of the electron screening effects Assenbaum et al. (1987); Strieder et al. (2001). Thus, a direct evaluation of the cross section is severely hindered and beyond the present technical possibilities. To obtain the cross section value at the Gamow energy, extrapolation should be used. But cross sections at ultra-low energy experience variations of many orders of magnitude making extrapolation difficult and often unreliable.
To remove the strong energy dependence due to Coulomb barrier penetration, the astrophysical S(E)-factor is introduced via the relation:
| (1) |
where is the center of mass energy, is the Sommerfeld parameter
| (2) |
where and represent the charges of interacting nuclei, is their relative velocity and is the reciprocal of the Gamow factor.
The introduction of the astrophysical S(E)-factor allows for a more accurate extrapolation procedure, especially in absence of resonances Rolfs and Rodney (1988).
In the 10B()7Be case, the available direct experimental data, which are reported in the NACRE compilation Angulo et al. (1999) (NACRE) and in Refs.Youn et al. (1991); Szabo et al. (1972); Wiescher et al. (1983); Angulo et al. (1993); Rauscher and Raimann (1996); Kafkarkou et al. (2013), refer to different experiments and range from more than 2 MeV down to about 20 keV.
At low energies, i.e. E100 keV, these data show an enhancement of the S(E)-factor due to the interplay between the 10 keV resonance and the electron screening effects Assenbaum et al. (1987); Strieder et al. (2001).
In addition, no information is available on the influence of the tail of the sub-threshold resonance at about -35 keV, and at energies between 20 keV and 2 MeV, the different data sets disagree both in energy dependence and in the absolute value Angulo et al. (1993).
To overcome the difficulties related to the suppression of the cross section at ultra-low energies, indirect techniques have proven to be effective.
In particular, the Trojan Horse Method (THM, Baur et al. (1986); Cherubini et al. (1996); Spitaleri et al. (1999); Typel et al. (2003); Spitaleri et al. (2004); Mukhamezhanov (2006); Spitaleri et al. (2011); Spitaleri (2011) and references therein) provides, at present, one of the most powerful technique for measuring the energy dependence of the bare nucleus cross section down to the astrophysically relevant energies.
The THM allows one to extract the low-energy S(E)-factor without Coulomb suppression and electron screening effects, which strongly influence direct measurements at astrophysical energies (see Spitaleri et al. (2011); Spitaleri (2011) and references therein).
The present paper reports on the first measurement of the 10B(p,)7Be S(E)-factor at 10 keV via THM, i.e. in the Gamow window for typical boron burning stellar environments.
II THE TROJAN HORSE METHOD: BASIC THEORY
The THM has been successfully applied to measure the bare nucleus cross sections of several reactions related to fundamental astrophysical and nuclear physics problems Baur et al. (1986); Cherubini et al. (1996); Spitaleri et al. (1999); Typel et al. (2003); Spitaleri et al. (2004); Mukhamezhanov (2006); Spitaleri et al. (2011); Spitaleri (2011); L. Sergi et al. (2010); Gulino et al. (2013); La Cognata et al. (2011); Lamia et al. (2012, 2012, 2013, 2007, 2008); G. Del Santo et al. (2008); La Cognata et al. (2005, 2010); Spitaleri et al. (2001); Tumino et al. (2003, 2006, 2011); La Cognata et al. (2007); Tumino et al. (2007, 2008); Mukhamedzhanov et al. (2008); La Cognata et al. (2009). Here we shortly summarize the main features of the method.
II.1 Quasi-free reaction mechanism
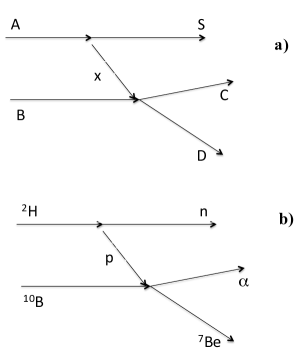
The quasi-free (QF) A+ B C + D + S reaction can be described by means of the Feynman diagram shown in Fig.1 a), where only the first term of the Feynman series is retained.
This can be described as a transfer to the continuum, in which the nucleus A (so called TH-nucleus) breaks-up into the transferred cluster (participant) and the cluster acting as a spectator to the x + B C+ D virtual reaction. The nucleus should have a strong cluster structure to maximize the QF breakup yield.
When this reaction mechanism is present, it can be distinguishable from others in a region of the three body phase space where the inter-cluster momentum () of the spectator is small i.e. for QF conditions.
The THM has its background in the theory of direct reactions (see e.g. Satchler (1983)), and in particular in the studies of the QF reaction mechanisms Spitaleri (1990). The application to nuclear reactions of astrophysical interest is an extension to low energies of the well-assessed measurements of QF reactions at higher energies Zadro et al. (1989); Calvi et al. (1990); Spitaleri (1990).
In the present application, the QF contribution to the three-body 2H(10B,7Be)n reaction of Fig.1 b) Baur et al. (1986); Spitaleri (1990), performed at energy well above the Coulomb barrier in the entrance 2H+10B channel, is selected to extract the 10B(p,)7Be cross section at astrophysical energies.
The THM is applied here within the Plane Wave Impulse Approximation (PWIA) framework, and the motivations for such a simplified approach in the application of the THM have been discussed in Spitaleri et al. (2011); Spitaleri (2011). Some of the critical points of this simplified approximation are presented.
The QF 2H(10B, 7Be)n reaction can be described by the Feynman diagram (Fig.1b) Shapiro et al. (1965); Shapiro (1967, 1968). This diagram represents the dominant process (pole approximation), while other graphs (triangle graphs) indicating re-scattering between the reaction products, are neglected Shapiro (1968). Under these hypotheses, the incident particle 10B is considered to interact only with the proton in the target nucleus 2H, while the neutron is considered spectator of the 10B(p,)7Be virtual reaction of interest for astrophysics.
Following the simple PWIA, the three-body reaction cross section can be factorized into two terms corresponding to the two vertices of Fig.1 b) and it is given by Spitaleri et al. (2011); Spitaleri (2011):
| (3) |
where:
-
•
is a kinematical factor containing the final state phase-space factor and it is a function of the masses, momenta and emission angles of the two detected particles and 7Be, of the incident 10B particle momentum, and of the mass of the spectator . Referring to Fig.1 a), its final expression is:
(4) where stands for the system Spitaleri et al. (2001);
-
•
is the half-off-energy-shell (HOES) differential cross section for the 10B(p,)7Be reaction at the center-of-mass energy , given in post-collision prescription by the relation Y. Grossiodor et al. (1974)
(5) where is the -value for the 10B(p,)7Be reaction and E is the relative energy.
-
•
is the Fourier transform of the radial wave function of the inter-cluster motion, usually given by the Hulthén function.
In the deuteron, the relative motion is most likely taking place in wave, thus the momentum distribution has a maximum at = 0 MeV/c ( is the inter-cluster momentum ).
More sophisticated theoretical formulations, accounting for HOES effects and the spin-parity of the interacting nuclei, can be found in Typel and H. Wolter (2000); Typel et al. (2003); Mukhamezhanov (2006); Mukhamedzhanov et al. (2008); Mukhamedzhanov (2011).
II.2 Energy and momentum prescriptions
The beam energy has to be carefully chosen to span the Gamow window under QF conditions.
Moreover, the validity conditions of the Impulse Approximation () were checked. Since the 10B incident energy of 24.5 MeV corresponds to a quite high momentum transfer = 220 MeV/c Barbarino et al. (1980); G. Pizzone et al. (2005, 2009) and to an associated de Broglie wavelength = 0.89 fm, smaller enough with respect the deuteron effective radius of about 4.5 fm F. Chew and G. C. Wick (1952), it is expected that the Impulse Approximation (IA) represents a suitable description of the process. This will be verified during the data analysis.
The beam energy (equal to about 4.1 MeV in the center-of-mass system) is large enough to overcome the Coulomb barrier = 1.62 MeV in the entry 2H+10B channel. Thus, the proton is brought inside the nuclear field of 10B to induce the 10B+ p + 7Be reaction.
Even if the beam energy was much larger than the in direct experiments, the THM has allowed us to investigate this range. This is possible because the initial projectile energy is compensated for by the binding energy of deuteron (Spitaleri et al. (1999, 2004) and references therein), making the relative energy very low. In symbols:
| (6) |
where E is the the projectile energy in the two body proton-10B center-of-mass system and the binding energy.
The applicability of the is limited to small momenta, satisfying the condition given in Ref. Shapiro (1967)
| (7) |
where = and the p-n reduced mass. For deuterons, the limit (6) is;
| (8) |
III THE EXPERIMENT
III.1 Selection of the Trojan horse nucleus
The 10B(p,)7Be cross section measurement can be performed using of a participant proton hidden either inside a deuteron 2H = with = spectator (binding energy = 2.225 MeV) or inside = with = spectator (= 5.49 MeV). The spectator-particle independence of the cross section has been proved in a number of works Tumino et al. (2005); G. Pizzone et al. (2011, 2013). The 2H(10B,7Be)n cross-section measurement is performed in inverse kinematics by using deuteron target as a virtual-proton target, as already done in a large number of indirect investigations with the THM Spitaleri et al. (2011); Tumino et al. (2003); La Cognata et al. (2007); La Cognata et al. (2011, 2008); L. Sergi et al. (2010); Lamia et al. (2008, 2012).
The choice of a deuteron as TH-nucleus is suggested by a number of reasons:
-
1.
its relatively low binding energy;
-
2.
its well known radial wave function;
-
3.
its obvious proton-neutron structure;
-
4.
it provides neutral spectator, if proton is chosen as participant;
-
5.
the relative motion takes place in , thus the momentum distribution 2 has a maximum for = 0 MeV/c;
-
6.
the small effects of the -wave component (less than 1% Lamia et al. (2012)).
III.2 Experimental setup
The experiment was performed at the Laboratori Nazionali del Sud (LNS) in Catania (Italy). The SMP Tandem Van de Graaf accelerator provided a 24.5 MeV 10B beam with an intensity of 1.5 nA. The beam spot was reduced to 2 mm in diameter using a collimator. An anti-scattering system was used to preserve detectors at small angles from scattered beam. The relative beam energy spread was about 10-4. Self-supported 200 g cm-2 thick CD2 target were placed at 90∘ with respect to the beam direction.
The detection setup consisted of a E-E system, made up of an ionization chamber (I.C.) (as E stage), with mylar entrance (0.9 micron thick), and exit (1.5 micron thick) windows, filled with butane gas at a pressure of about 40 mbar. A silicon position sensitive detector (single area, resistive redout) PSDA was used to detect the residual energy of the emitted particles.

Two position sensitive detectors PSDB and PSDC were placed at opposite side with respect to the beam direction (Fig.2). Thanks to the diameter of the scattering chamber ( 2000 mm), the detectors were fixed at a distance of 600 mm from the target. Details of the adopted experimental setup (i.e. angular position, distances, solid angles etc.) are listed in Table 1, together with the intrinsic angular resolution . The coplanarity of the three detectors was checked by an optical system.
Angular ranges were chosen to cover neutron momenta pn ranging from -200 MeV/c to 200 MeV/c. This assures that the bulk of the quasi-free contribution for the breakup process of interest lies inside the investigated region. This allowed also to cross check the method inside and outside the phase-space regions where the quasi-free contribution is expected.
The energy and position signals of the PSDs were processed by standard electronics together with the time signals coming from any two of them.
The trigger for the data acquisition was given by the logic coincidence between the E-E system and the “OR” of logic signals from PSDB and PSDC. The processed signals were then sent to the acquisition system for on-line monitoring and data storage.
Deterioration of CD2 targets has been continuously overseen by monitoring the ratio of the Z=4 particle yield to the charge collected in the Faraday cup at the end of the beam line.

| Detector | Area | ||||||
|---|---|---|---|---|---|---|---|
| (deg) | (deg) | ( msr) | (mm) | (m) | (cm2) | (deg) | |
| 6.9 | 5 | 1.50.1 | 5702 | 492 | 5 | 0.10 | |
| 8.2 | 8 | 4.1 | 3502 | 492 | 5 | 0.16 | |
| 17.9 | 8.6 | 3302 | 984 | 5 | 0.17 |


III.3 Detector calibration
At the initial stage of measurement, masks with 18 equally spaced slits were placed in front of each PSD to perform position calibration. A correspondence between position signals from PSD’s and detection angle was then established. Energy and angular calibration were performed by using a 9 MeV 6Li beam impinging on a CD2 target, to measure reactions on 12C and 2H, and a gold target to measure the 6Li+197Au elastic scattering. In addition, a three-peaks alpha source (239Pu, 241Am, 244Cm) was also used for low-energy calibration. The overall procedure lead to a resolution better than 1% for energy calibration and better than 0.2∘ for angular calibration.
IV DATA ANALYSIS
As already mentioned above, the application of THM requires several steps in the data analysis. Its application is not straightforward and careful evaluation reaction channel and reaction mechanism selections need to be performed. Each of these steps is described in detail in the following paragraphs together with validity tests of the method.
IV.1 Selection of the 2H(10B,7Be)n channel
To disentangle the contribution of the 2H(10B,7Be)n reaction, 7Be nuclei were selected using the standard E-E technique (Fig.3), while no identification was used for particles on PSDB and PSDC. In Fig.3 the typical E-E two-dimensional-plot is shown. The kinematical variables have been then reconstructed under the assumption that the mass of the third undetected particle is one (neutron mass).
Therefore the experimental Q-value spectrum, shown in Fig.4, has been deduced and it is centered at about -1.07 MeV, in good agreement with the theoretical value of -1.079 MeV. In the further analysis, only events inside the Q-value peak are considered, being the measured background of Fig.4 lower than the 4.
In addition, the experimental - kinematical locus of the 2H(10B,7Be)n reaction was reconstructed and compared with the simulated one, angle by angle. In particular, Fig. 5 shows the spectra obtained by selecting the angular condition =17∘1∘ and =8∘1∘.
Good agreement between the experimental (black solid dots) and theoretical (red solid dots) kinematic loci is found for all the angular couples, the differences in the population of the kinematic loci being originated by reaction dynamics. This procedure confirms the correct identification of the 2H(10B,7Be)n reaction channel and the accuracy of the detectors calibration.


IV.2 Selection of the QF reaction mechanism contribution
The identification of the different reaction mechanisms is a crucial step in the data analysis because there might be mechanisms other than the QF one, such as sequential decay () or direct breakup (), producing the same particles , 7Be and neutron in the final state (Fig.6). This exit channel can be populated by three different sequential processes, corresponding to the different couplings of the three particles in the exit channel (Fig.6):
-
1.
10B+2H11C∗+7Be + +
-
2.
10B+2H8Be∗+7Be + +
-
3.
10B+2H5He∗+7Be + + 7Be
Kinematic conditions can be chosen to minimize contributions in most cases, as it is possible to identify contributions coming from by means of the analysis of the relative energy spectra for any pair of detected particles.
Fig.7 a) and Fig.7 b) show the scatter plots of the and relative energies as a function of the - one. In these plots, any event correlation appearing as a horizontal, vertical or bent line, gives evidence of the formation of an excited intermediate system, finally feeding the exit channel of interest.
The 2D plots of Fig.7 show very clear vertical loci corresponding to 11C levels at excitation energies of 8.104 MeV (labelled as (1)), 8.420 MeV (labelled as (2)), 8.654 MeV and 8.699 MeV (unresolved levels labelled as (3)+(4)). No horizontal loci, corresponding to 5He or 8Be excited states, are present. Moreover, to determine the presence of the different processes a)-d) of Fig.6, a quantitative analysis has been performed by following the the same approach discussed in several works on QF-mechanisms (see Lattuada et
al. (1982, 1982, 1982); Calvi et al. (1983)) and THM measurements (see La Cognata et al. (2005); Gulino et al. (2013); Lamia et al. (2012)). In particular, for fixed angles, we have obtained the experimental spectra of the EBe, Eα, Eα-Be, Eα-n kinematical variables. They were compared with Monte Carlo simulations including all the processes of Fig. 6 that can contribute to the reaction yield. The relative weight of each process has been adjusted in order to reproduce experimental data. This analysis leads to a 4 maximum contribution of process (d) to the total reaction yield and demonstrates that the dominant contribution is given by diagram (a) in Fig. 6.
Therefore, the 2H(10B,7Be)n reaction mainly proceeds through formation of an intermediate 11C excited nucleus. In particular, only the 8.699 MeV 11C excited state can contribute within the astrophysical energy region, because the other three 11C states at 8.654 MeV, 8.420 MeV and 8.104 MeV are below the 10B+p decay threshold H. Kelley et al. (2012).
IV.2.1 Experimental momentum distribution in PWIA
A standard way to investigate the reaction mechanisms is the study of the experimental momentum distribution of 2H Spitaleri et al. (2004, 2011), being this quantity very sensitive to the reaction mechanism.
The kinematical variables of the undetected neutron needed to reconstruct the experimental momentum distribution can be calculated using angles and energies of the detected and 7Be particles.
If the factorization of Eq.(3) is applicable, dividing the QF coincidence yield (Y) by the kinematic factor, a quantity which is proportional to the product of the momentum distribution by the p+10B + 7Be two-body cross section is obtained. In a restricted relative energy and center-of-mass angular range , the differential binary cross section can be considered almost constant and from Eq.(3) we obtain the simple relation:
| (9) |
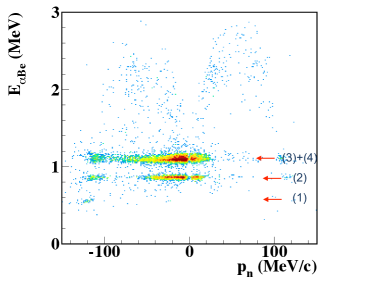
The experimental momentum distribution has been obtained by following the standard approach given in Spitaleri et al. (2004), by considering the 2D-plot .vs.pn shown in Fig.8. By selecting the events corresponding to a very narrow window in both relative energies and angles, a projection onto the pn axis has been made giving the experimental yield Y used in the previous formula.
Neutron momentum values ranging from -100 MeV/c to 100 MeV/c were deduced, accordingly to the horizontal axis of Fig. 8. These data were then corrected for the kinematical factor, thus removing phase-space effects. Finally, an average between the experimental yield corresponding to the condition -100 MeV/cpn0 MeV/c and the one corresponding to the condition 0pn100 MeV/c has been performed.
The resulting momentum distribution is given as black symbols in Fig. 9, as a function of the modulus of the neutron momentum .
It represents the experimental momentum distribution as deduced from the present 2H(10B, 7Be)n measurement performed at Ebeam= 24.5 MeV.
The black solid line in Fig.9 is the theoretical distribution given by the squared Hulthén wave function in momentum space:
| (10) |
normalized to the experimental maximum, with parameters =0.2317 fm-1 and =1.202 fm-1 Zadro et al. (1989). The experimental full width obtained in the present work is 54 5 MeV/c.

IV.2.2 Comparison between the PWIA and the DWBA calculations
The PWIA framework is usually adopted in the THM application since it accurately describes the experimental data, provided that the appropriate FWHM (full width at half maximum) for the experimental value of the momentum transfer is introduced into the calculations G. Pizzone et al. (2005, 2011). This is simply accounted for by using the experimental momentum distribution to extract the HOES cross section. The validity of a PWIA approach can be verified employing the Distorted Wave Born Approximation (DWBA). For such a reason, a DWBA calculation has been additionally performed by means of the FRESCO code J. Thompson (1987), by considering the optical model potential parameters given in Perey and Perey Perey and Perey (1976). The result is shown as dashed red line in Fig.9, after normalization to the experimental data. From the comparison with the experimental momentum distribution one can state that, if we limit our event selection to the region close to the maximum of the experimental momentum distribution (=0 MeV/c for relative motion), the DWBA approach and the PWIA one give similar results, apart from an inessential scaling factor. In fact, the THM cross section is expressed in arbitrary units. The momentum distributions in PWIA (black solid line) and DWBA (red dotted line) nicely agree with the experimental data over the whole neutron momentum range given by Eq. (7) Shapiro (1968). However, to select only the experimental data for which the contribution of the QF reaction mechanism is dominant and the differences between PWIA and DWBA are negligibly small, the narrower 0-30 MeV/c momentum range (delimited by the vertical dot-dashed line in Fig.9) was chosen for the next analysis.
IV.3 Selection of the events for the 10B(p,)7Be investigation
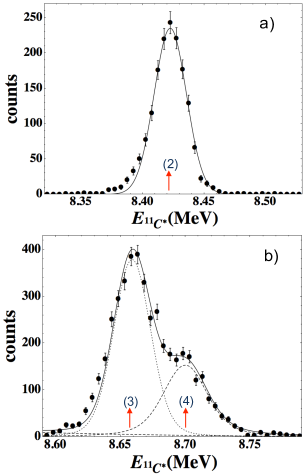
The selected events are finally shown in the two panels of Fig. 10 as a function of 11C excitation energy. In particular, the upper panel shows the well separated peak at about 8420 keV, while in the lower panel the convolution between the 8654 keV and the 8699 keV levels is reported.
| E∗ | Jπ | Ref. | |||
|---|---|---|---|---|---|
| (keV ) | (keV) | (keV) | (keV) | ||
| 81041.7 | -580 | 3/2- | 6 10-3 | — | H. Kelley et al. (2012) |
| 84202 | -287 | 5/2- | 810-3 | 313 | H. Kelley et al. (2012) |
| 86544 | -35 | 7/2 + | 5 | 342 | H. Kelley et al. (2012) |
| 86992 | 10 | 5/2+ | 161 | 402 | Wiescher et al. (1983) |
The isolated 8.420 MeV level has been fitted with a Breit-Wigner function, giving the following parameters: resonance energy ER = 8.422 0.002 MeV, =131 keV and FWHM 313 keV. These must be compared with those in Table II, 8 eV and ER = 8.420 MeV as given in the literature H. Kelley et al. (2012).
Since the isolated level of Fig.10 a) is very narrow, we can conclude that the total energy resolution is equal to its experimental width =313 keV (FWHM) and it is assumed to be constant over the whole measured energy range. The levels labelled with and in Fig.10 b) correspond to the unresolved 8.654 MeV and 8.699 MeV 11C excited states, whose overlap is due to the experimental energy resolution. To select events corresponding to the region with energy 0, it is necessary to separate this two contributions and to evaluate the uncertainties coming from such a procedure.
Since the resonance energy and the width of these two unresolved resonances are known H. Kelley et al. (2012), the observed peaks of Fig.10 b) have been fitted by considering the broadening by energy resolution effects, previously described, on the function F(E)unres.. This function is expressed in terms of the incoherent sum of two Breit-Wigner shapes and plus a non resonant contribution :
| (11) |
where
| (12) |
where the parameters of Eq.(11) are:
- E=8.654 MeV the energy resonance (3),
- N(E)=183048 the peak value in correspondence of resonance (3),
- =5 keV the width of resonance (3),
- E=8.699 MeV the energy resonance (4),
- N(E)=30618 the peak value in correspondence of resonance (4),
- =16 keV the width of resonance (4)
and
| (13) |
being Ethr.=8.689 MeV the proton decay threshold for the 11C nucleus. The procedure described above returns the full-black line superimposed on the TH data of Fig.10 b), giving a reduced of 1.7.
Because of the presence of the subthreshold 8.654 MeV level, its contribution has been properly subtracted for the experimental data of Fig.10 b) lying in the window 0100 keV.
The corresponding uncertainty ( has been then evaluated as
| (14) |
where and are the number of events corresponding to and to at the energy , respectively.
In Fig.10 b), the fit of the unresolved levels (3)+(4) (solid line) is shown as well as the separate level contributions (dotted (3) and dashed (4) lines).The contribution of the 8.699 MeV 11C excited level separated from the subthreshold 8.654 MeV state is shown in Fig.11. Note that the solid line in Fig.11, corresponding to the fit reported in Fig.10 b), is obtained by taking in account the resonant (upper dashed line) and non resonant (lower dashed line) contributions, while errors affecting the data points are the statistical only.
In the next phase of data analysis, only these events are taken into account for extracting the 10B(p,)7Be S(E)-factor.

V RESULTS
V.1 Two-body cross section
The 10B(p,)7Be HOES differential cross section is extracted by inverting Eq.(3):
| (15) |
The product is calculated by using a Monte Carlo simulation, including masses, angles and momenta of the detected 7Be and alpha particles, and the experimental momentum distribution obtained above.
As already mentioned, since the proton is brought inside the 10B nuclear field, the binary reaction is HOES and represents only the nuclear part Spitaleri et al. (2011); Spitaleri (2011); Spitaleri et al. (2004). For this reason, the effects of the Coulomb barrier must be introduced to compare the differential cross section in to the on-energy-shell one.
The so-called TH cross section is then defined using the relation:
| (16) |
where the penetration probability P = P of the Coulomb barrier is defined by the equation:
| (17) |
with and regular and irregular Coulomb functions for , and the relative wave number and the interaction radius for the B system, respectively. Since the angular distributions for the 10B(p,)7Be reaction are almost isotropic Youn et al. (1991), the differential cross section integrated over the experimental range differs from the total cross section by an inessential scaling factor.
In the case of the 10B(p,)7Be reaction, the =0 contribution is dominant as the ground state has = 3+, the proton has = 1 / 2+ and the 8.699 MeV level = 5/ 2+. The small non-resonant background is represented by an component in the region of astrophysical interest, thus the bare nucleus total cross section can be calculated by using:
| (18) |
where W0 is a normalization constant to be determined.
V.2 Bare nucleus astrophysical Sb(E)-factor
The determination of the bare nucleus THM Sb(E)-factor in absolute units has been then performed by using the available direct data of Angulo et al. (1993); Youn et al. (1991); Angulo et al. (1999) (NACRE), showed in Fig.12. However, low-energy direct measurements are strongly affected by the electron screening effects Assenbaum et al. (1987); Strieder et al. (2001), thus the absolute scale on the Sb(E)-factor needs to be obtained by normalizing the TH data to the OES one in an energy range where the electron screening effects are negligible to reduce systematic errors. In addition, energy resolution effects alter the energy trend of the present TH data, thus the normalization procedure is not straightfoward.
For such a reason, a function describing the available direct S-factor measurements was then deduced and reduced to the same experimental resolution of the THM Sb(E)-factor, thus allowing finally to get the normalization coefficient.
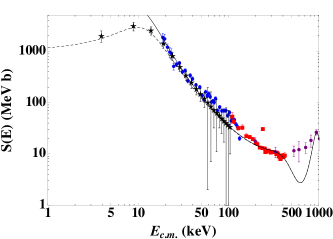
The available low-energy direct data from Refs. Youn et al. (1991); Angulo et al. (1993); Angulo et al. (1999) (NACRE) have been described by means of an -matrix calculation, performed by using the parameters of the relevant resonances currently reported in literature Wiescher et al. (1983); H. Kelley et al. (2012) (Table III). The enhancement at energies lower than 50 keV has been described by using the electron screening potential value of 430 eV given in Angulo et al. (1993).
| Er | ||||
|---|---|---|---|---|
| (keV) | (keV) | (keV) | (keV) | (keV) |
| 9.4 | 210-17 | 15 | 15 | 15 |
| 500 | 3.310-4 | 500 | 500 | 500 |
| 945 | — | — | 210 | 210 |
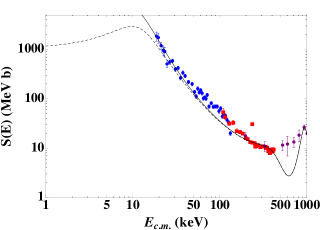
Fig.12 shows the available direct S(E)-factor measurements data for the 10B(p,)7Be reaction as reported in the literature (red and blue symbols for Youn et al. (1991); Angulo et al. (1993); Angulo et al. (1999) (NACRE), respectively) and the obtained -matrix calculation (solid line).
The very poor reduced (8) urges to perform new improved direct measurements of the 10B(p,)7Be reaction. Indeed, the -matrix calculation nicely describes the astrophysical factor at about 500 keV and below about 50 keV, while it fails to reproduce the astrophysical factor in the energy region where the two direct data sets overlap, suggesting the presence of some systematic effect. The R-matrix calculation in Fig.12 includes the additional 9645 keV 11C level, determining a resonance at about 945 keV in the 10B-p center-of-mass system. For this resonance, the reduced widths were chosen to supply the in the literature H. Kelley et al. (2012). However, a strong disagreement is evident between the R-matrix calculation and the experimental direct data reported in A. Roughtoni et al. (1979). A possible explanation is that these data were deduced using the thick-target approach for which no proper deconvolution procedure was operated by the authors.
Finally, it must be noticed that the -matrix calculation has been also performed by considering on the data of Youn et al. (1991) the same correction factor used by Angulo et al. (1993). In this sense, new direct measurements at higher energies could be used to constrain such a fit, for both absolute values and adopted resonance parameters.
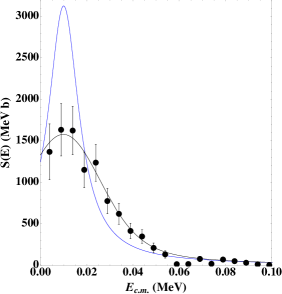
The THM Sb(E)-factor of Fig.13 (black dots) has been then obtained by normalizing it to the -matrix calculation of Fig.12 smeared to match the same experimental resolution of the present experiment. The normalization procedure, performed in the energy range 50-100 keV in which electron screening does not strongly alter the pure resonant trend of the astrophysical S(E)-factor and in which the resonant 945 keV level does not play any significant role (less than 2%), leads to an overall uncertainty of about 15% with a reduced of 0.5.

The error bars of Fig.13 include the statistical error, the uncertainty connected to the sub-threshold level subtraction, the uncertainty derived from the choice of the nuclear radius in the penetrability factor ( in , Eqs.15,16), and the uncertainty due to the normalization procedure. Table IV lists the values of the THM S(E)-factor together with the total uncertainty.
A fit to the data was performed to evaluate the Sb(E)-factor at zero relative energy. Since this fit has the sole aim to obtain such numerical value and not to provide resonance parameters with a physical meaning, a simple functional form has been used, given by the sum of first order polynomial and a Gaussian function with parameters:
| (19) |
with , the peak value , the width , and as free parameters.
The best fit parameters are = 0.0100.002 MeV, = 131579 MeV/b, = 0.0160.002 MeV, =23659 MeVb, = -2320614 MeV. A reduced of 0.6 is obtained.
| S(E) | S(E) | stat. | lev.sub. | tot. | |||
|---|---|---|---|---|---|---|---|
| (keV) | (MeV b) | (MeV b) | (MeV b) | (MeV b) | . | ||
| 3.9 | 1995 | 499 | 1368 | 342 | 9 | 17 | 25 |
| 8.9 | 3071 | 583 | 1634 | 310 | 8 | 9 | 19 |
| 13.9 | 2530 | 455 | 1625 | 292 | 8 | 6 | 18 |
| 18.9 | 1411 | 268 | 1151 | 219 | 9 | 5 | 19 |
| 23.9 | 797 | 143 | 1239 | 223 | 9 | 4 | 18 |
| 28.9 | 496 | 99 | 775 | 155 | 11 | 5 | 20 |
| 33.9 | 336 | 67 | 621 | 124 | 13 | 5 | 20 |
| 38.9 | 244 | 56 | 415 | 95 | 16 | 6 | 23 |
| 43.9 | 185 | 44 | 348 | 83 | 17 | 6 | 24 |
| 48.9 | 146 | 41 | 211 | 59 | 22 | 9 | 28 |
| 53.9 | 119 | 39 | 132 | 44 | 27 | 12 | 33 |
| 58.9 | 99 | 97 | 15 | 15 | 83 | 51 | 98 |
| 63.9 | 84 | 77 | 16 | 15 | 78 | 46 | 92 |
| 68.9 | 72 | 29 | 78 | 32 | 36 | 14 | 41 |
| 73.9 | 63 | 52 | 19 | 16 | 73 | 37 | 83 |
| 78.9 | 56 | 24 | 70 | 30 | 38 | 12 | 43 |
| 83.9 | 49 | 24 | 51 | 25 | 44 | 15 | 49 |
| 88.9 | 44 | 27 | 32 | 19 | 56 | 21 | 61 |
| 93.9 | 40 | 40 | 12 | 12 | 90 | 38 | 99 |
| 98.9 | 36 | 36 | 3 | 3 | 100 | 71 | 100 |
| 103.9 | 33 | 23 | 24 | 17 | 65 | 22 | 71 |
V.3 Electron screening
In order to compare the THM data fit with the ones reported in the literature, it has been necessary to remove the effect of the energy resolution affecting the THM data, causing a broadening of the resonant peaks. For such a reason, the TH S(E)-factor at infinite energetic resolution has been extracted by means of the already used Breit-Wigner function described in the text. In particular, we have considered that the TH data are nicely described in terms of Eq.(10), once a smearing procedure has been properly applied. The use of more refined approaches, such as a -matrix function, it is not necessary in this context owing to the experimental uncertainties. Assuming a Breit-Wigner shape for the resonance, Eq.(10) has been in fact folded with a Gaussian simulating the response function of the detectors to get the finite-resolution data. Then, in a recursive approach the folded function has been compared with the THM data and the parameter of the original BW modified until the THM data are well reproduced (minimum reduced ).
Thus, the TH S(E)-factor at infinite resolution has been evaluated starting from the original analytical expression in Eq.(10), without considering the contribution of the subthreshold level. The BW function describing the 10 keV resonance as well as the no-resonant contribution of Eq.(10) have been then corrected for the phase-space population effect, penetrability through the Coulomb-barrier, and for the Gamow factor thus allowing us to get the TH S(E)-factor at infinite resolution. The infinite-resolution TH S(E)-factor is shown in Fig.14 as a blue line, while the experimental data at the energy resolution of 31 keV are shown as black-points together with the corresponding smeared function.
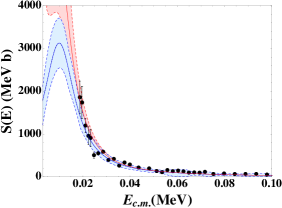
Fig.15 shows the comparison between the direct data of Angulo et al. (1999) (NACRE) and the THM S(E)-factor at infinite resolution (full blue line) together with its allowed upper and lower values (dashed blue lines).
The 10 keV THM S(E)-factor is = 3127583 (MeV b), the error including statistical, subthreshold subtraction, channel radius and normalization uncertainties. The THM value is in agreement with the extrapolated one reported in Angulo et al. (1993), 2870500 (MeV b). Table V lists the S(E)-factor values in the literature and the ones obtained in this work, while in Fig.16 we compare our THM S(E)-factor with the R-matrix calculation previously described. Fig.16 shows a very good agreement between two independent approaches, namely, the experimental THM (stars) and the R-matrix calculation performed taking the resonance parameters in the literature (dashed and solid lines for bare-nucleus and screened astrophysical factors, respectively). This fact makes it clear that possible systematic errors might affect direct data in the region where the two data sets from Youn et al. (1991) and Angulo et al. (1993) overlap.
It is important noting the THM S-factor and the R-matrix have the same energy trend; even if the THM relies on direct data for normalization, possible systematic errors would not change our conclusions.
| S(10 keV) | Approach | Ref. | Year | |
| (MeV b) | (MeV b) | |||
| —— | 2200600 | Direct exp. | Youn et al. (1991) | 1991 |
| —— | 2870500 | Direct exp. | Angulo et al. (1993) | 1993 |
| 900 | 3480 | DWBA | Rauscher and Raimann (1996) | 1996 |
| 1116 | 3105 | -matrix | present work | |
| 1247312 | 3127583 | THM | present work |

In the case of the direct measurements, it must be stressed here that the low-energy cross section evaluations are difficult to be performed, making it necessary to perform extrapolations.
It is worth noting that electron screening significantly alters the low-energy trend of the S(E) factor, thus its effect has to be removed before extrapolation to prevent systematic errors. In the 10B+p case, the adopted enhancement factor assumes the electron screening potential value Ue = 43060 eV as deduced from the direct 11B(p,)8Be S(E)-factor measurement, under the hypothesis of no isotopic dependence of Ue Assenbaum et al. (1987).
Indeed, in the case of the 10B(,)7Be reaction, extrapolation from high-energy data has been performed, assuming a single level Breit-Wigner function describing the resonance at 10 keV, with parameters from Ref.Wiescher et al. (1983).
Since the THM provides an independent measurement of the bare nucleus S(E)-factor, the electron screening potential can be extracted by fitting the available low-energy direct data of Angulo et al. (1993) by using the TH bare-nucleus S(E)-factor and the standard expression for the enhancement factor Rolfs and Rodney (1988); Assenbaum et al. (1987); Strieder et al. (2001)
| (20) |
where is left as the only free parameter in the best fit procedure and is the enhancement factor usually introduced to parameterize the rise of the S(E)-factor due to the electron screening effects Rolfs and Rodney (1988).
As already mentioned, the TH should show the same trend as the direct Sb(E), except in the ultra-low energy range where the two data sets should differ due to the effects of electron screening (Fig.15). For such a reason the low-energy direct data of Angulo et al. (1993) have been fitted by using Eq.19, by leaving the electron screening potential as the only free parameter. The procedure returns the result shown in Fig.17 and the value of []TH = 240200 eV, where the large error takes into account the uncertainties on the bare-nucleus THM S(E)-factor measured here. The central value is in agreement, within the experimental uncertainties, with the adiabatic limit of 340 eV. Table VI is a summary of the adopted electron screening potential values as given in the literature.
| Reaction | Approach | reference | Year | |
|---|---|---|---|---|
| (eV) | ||||
| 11B()8Be | 43080 | Direct exp. | Angulo et al. (1993) | 1993 |
| 472120 | THM | Lamia et al. (2012) | 2012 | |
| 10B()7Be | 43080 | Direct exp. | Angulo et al. (1993) | 1993 |
| 240200 | THM | present work |
VI CONCLUSIONS
The 10B(p,)7Be reaction has been measured for the first time at the Gamow peak by means of the THM applied to the 2H(10B, 7Be)n QF reaction. The QF reaction mechanism has been quantitatively evaluated by analyzing the relative energy spectra and extracting the experimental momentum distribution for the p-n intercluster motion inside deuteron. Both PWIA and DWBA give the same shape for the theoretical momentum distribution if one considers neutron momentum values fulfilling the momentum prescription of Eq.(7) Shapiro (1967). The experimental THM yield is characterized by the population of three different resonant levels of the intermediate 11C nucleus, being the 8699 keV one of primary importance for the 10B()7Be S(E)-factor determination. In fact,
the Gamow peak for typical boron quiescent burning is centered at 10 keV and coincides with the 8.699 MeV 11C state , determining a l=0 resonance at such energy. To this aim, energy resolution effects and selection of the events of interest for the THM investigation have been carefully evaluated together with the corresponding uncertainties. In this way the S(E)-factor has been obtained at low energies with no need of extrapolation. By using the high-energy direct data for normalization, the absolute value of the astrophysical factor has been determined, giving, for the first time, a measurement at the corresponding Gamow peak.
In addition, since the THM S(E)-factor does not suffer from electron screening effects, it has been used to evaluate the electron screening potential value needed for the description of the low energy direct data. This represents the first independent measurement of Ue for the 10B()7Be reaction, since the adopted one derives from applying the so-called isotopic independence hypothesis for electron screening phenomena. The quoted uncertainties on both S(E) and Ue take into account statistical and systematic uncertainties, for which a careful evaluation has been deeply discussed in the text. The present THM investigation of the 10B()7Be reaction leads to = 3127583 (MeV b) for the S(E)-factor value in correspondence of the 10 keV resonance, in which the quoted error accounts for statistical, subthreshold subtraction, normalization and channel radius uncertainties. By using the measured bare-nucleus TH S(E)-factor, a value of 240200 eV has been deduced for the electron screening potential value, where the large error takes into account the uncertainties on the TH S(E)-factor.
Acknowledgements.
This work has been partially supported by the Italian Ministry of University MIUR under the grant “LNS-Astrofisica Nucleare (fondi premiali)” and RFBR082838 (FIRB2008). It has been partially supported also by the grant LC 07050 of the Czech MŜMT, grant M10480902 of the Czech Academy of Science, grant LH1101 of the AMVIS project. A. M. M. acknowledges the support by U.S. Department of Energy under Grants No. DE-FG52-09NA29467, No. DE-FG02-93ER40773, and No. DE-SC0004958 and by NSF under Grant No. PHY-0852653.References
- Boesgaard et al. (2005) A. M. Boesgaard et al., Astr. Phys. Journ., 621, 991 (2005).
- Rolfs and Rodney (1988) C. Rolfs and W. Rodney, Cauldrons in the Cosmos (The University of Chicago, 1988) p. 561.
- Peterson et al. (1975) R. J. Peterson et al., Ann. Phys. Energy, 2, 503 (1975).
- Assenbaum et al. (1987) H. Assenbaum, K. L. Langanke, and C. Rolfs, Z. Phys. A, 327, 461 (1987).
- Strieder et al. (2001) F. Strieder, C. Rolfs, C. Spitaleri, and P. Corvisiero, Naturwissenschaften, 88, 461 (2001).
- Angulo et al. (1999) (NACRE) C. Angulo et al. (NACRE), Nucl. Phys. A, 656, 3 (1999), http://pntpm.ulb.ac.be/nacre.htm.
- Youn et al. (1991) M. Youn et al., Nucl. Phys., A533, 321 (1991).
- Szabo et al. (1972) J. Szabo et al., Nucl. Phys., A195, 527 (1972).
- Wiescher et al. (1983) M. Wiescher et al., Phys. Rev. C, 28, 1431 (1983).
- Angulo et al. (1993) C. Angulo et al., Z. Phys. A, 187, 345 (1993).
- Rauscher and Raimann (1996) T. Rauscher and G. Raimann, Phys. Rev. C, 53, 2496 (1996).
- Kafkarkou et al. (2013) A. Kafkarkou et al., Nucl. Instr. and Method. B, 316, 48 (2013).
- Baur et al. (1986) G. Baur et al., Nucl. Phys. A, 458, 188 (1986).
- Cherubini et al. (1996) S. Cherubini et al., Astrophys. J., 457, 855 (1996).
- Spitaleri et al. (1999) C. Spitaleri et al., Phys. Rev. C, 60, 055802 (1999).
- Typel et al. (2003) S. Typel et al., Ann. of Phys., 305, 228 (2003).
- Spitaleri et al. (2004) C. Spitaleri et al., Phys. Rev. C, 69, 055806 (2004).
- Mukhamezhanov (2006) A. Mukhamezhanov, Eur. Phys. Journ., 27, 205 (2006).
- Spitaleri et al. (2011) C. Spitaleri et al., Phys. Atom. Nucl., 12, 1000 (2011).
- Spitaleri (2011) C. Spitaleri, Interaction of High-Energy Particles with Nuclei, International School of Physics Enrico Fermi, Course, edited by A. Bracco and E. Nappi (Academic Press, New York, 2011) p. 210.
- L. Sergi et al. (2010) M. L. Sergi et al., Phys. Rev. C., 82, 032801(R) (2010).
- Gulino et al. (2013) M. Gulino et al., Phys. Rev. C, 87, 012801(R) (2013).
- La Cognata et al. (2011) M. La Cognata et al., Astr. Phys. Journ. Lett., 739, L54 (2011).
- Lamia et al. (2012) L. Lamia et al., Journ. of Phys. G, 39, 015106 (2012a).
- Lamia et al. (2012) L. Lamia et al., Astr. & Astrophys., 541, A518 (2012b).
- Lamia et al. (2013) L. Lamia et al., The Astrophys. Jour., 768, 65 (2013).
- Lamia et al. (2007) L. Lamia et al., Nucl. Phys. A, 787, 309c (2007).
- Lamia et al. (2008) L. Lamia et al., Il Nuovo Cimento C, 31, 423 (2008).
- G. Del Santo et al. (2008) M. G. Del Santo et al., Proc. of Science, 53, 2496 (2008).
- La Cognata et al. (2005) M. La Cognata et al., Phys. Rev. C, 72, 065802 (2005).
- La Cognata et al. (2010) M. La Cognata et al., Astrophys. J., 708, 796 (2010).
- Spitaleri et al. (2001) C. Spitaleri et al., Phys. Rev. C, 63, 055801 (2001).
- Tumino et al. (2003) A. Tumino et al., Phys. Rev. C, 67, 065803 (2003).
- Tumino et al. (2006) A. Tumino et al., Eur. Phys. J. A, 27, 243 (2006).
- Tumino et al. (2011) A. Tumino et al., Phys. Lett. B, 700, 111 (2011).
- La Cognata et al. (2007) M. La Cognata et al., Phys. Rev. C, 76, 065804 (2007a).
- Tumino et al. (2007) A. Tumino et al., Phys. Rev. Lett., 98, 252502 (2007).
- Tumino et al. (2008) A. Tumino et al., Phys. Rev. C, 78, 045801 (2008).
- Mukhamedzhanov et al. (2008) A. M. Mukhamedzhanov et al., J. Phys. G: Nucl. Part. Phys., 35, 014016 (2008).
- La Cognata et al. (2009) M. La Cognata et al., Phys. Rev. C., 80, 012801 (2009).
- Satchler (1983) G. R. Satchler, Direct Nuclear Reactions, International Series of Monographs on Physics (Oxford University Press, 1983) p. 211.
- Spitaleri (1990) C. Spitaleri, Problems of Fundamental Modern Physics, edited by R. Cherubini, P. Dalpiaz, and B. Minetti (World Scientific, New York, 1990) p. 211.
- Zadro et al. (1989) M. Zadro et al., Phys. Rev. C., 40, 181 (1989).
- Calvi et al. (1990) G. Calvi et al., Phys. Rev. C., 41, 1848 (1990).
- Shapiro et al. (1965) I. S. Shapiro et al., Nucl. Phys. A, 61, 353 (1965).
- Shapiro (1967) I. Shapiro, Interaction of High-Energy Particles with Nuclei, International School of Physics “Enrico Fermi”, Course 38, edited by E. Ericson (Academic Press, New York, 1967) p. 210.
- Shapiro (1968) I. S. Shapiro, Sov. Physics Uspekhi, 10, 515 (1968).
- G. Fallica et al. (1978) P. G. Fallica et al., Lett. Nuovo Cimento, 22, 547 (1978).
- Y. Grossiodor et al. (1974) J. Y. Grossiodor et al., Phys. Rev. Lett., 32, 177 (1974).
- Typel and H. Wolter (2000) S. Typel and H. Wolter, Few Body Sist., 29, 7 (2000).
- Mukhamedzhanov (2011) A. M. Mukhamedzhanov, Phys. Rev. C, 84, 044616 (2011).
- Barbarino et al. (1980) S. Barbarino et al., Phys. Rev. C, 21, 1104 (1980).
- G. Pizzone et al. (2005) R. G. Pizzone et al., Phys. Rev. C, 71, 055801 (2005).
- G. Pizzone et al. (2009) R. G. Pizzone et al., Phys. Rev. C, 80, 025807 (2009).
- F. Chew and G. C. Wick (1952) G. F. Chew and G. C. Wick, Phys. Rev., 85, 636 (1952).
- Tumino et al. (2005) A. Tumino et al., Eur. Phys. J. A., 25, 649 (2005).
- G. Pizzone et al. (2011) R. G. Pizzone et al., Phys. Rev. C, 83, 045801 (2011).
- G. Pizzone et al. (2013) R. G. Pizzone et al., Phys. Rev. C, 87, 025805 (2013).
- La Cognata et al. (2007) M. La Cognata et al., Phys. Rev. C, 76, 065804 (2007b).
- La Cognata et al. (2008) M. La Cognata et al., Phys. Rev. Lett., 101, 152501 (2008).
- Lamia et al. (2012) L. Lamia et al., Phys. Rev. C, 82, 025805 (2012c).
- Lattuada et al. (1982) M. Lattuada et al., Lettere al Nuovo Cimento, 33, 433 (1982a).
- Lattuada et al. (1982) M. Lattuada et al., Il Nuovo Cimento, 69, 1 (1982b).
- Lattuada et al. (1982) M. Lattuada et al., Il Nuovo Cimento, 71, 429 (1982c).
- Calvi et al. (1983) G. Calvi et al., Lettere al Nuovo Cimento, 37, 279 (1983).
- H. Kelley et al. (2012) J. H. Kelley et al., Nucl. Phys.A, 880, 88 (2012).
- J. Thompson (1987) I. J. Thompson, Comput. Phys. Rep., 7, 167 (1987).
- Perey and Perey (1976) C. M. Perey and F. Perey, At. Data Nucl. Data Tables, 17, 1 (1976).
- A. Roughtoni et al. (1979) N. A. Roughtoni et al., At. Data Nucl. Tables, 23, 177 (1979).