Shapley Supercluster Survey (ShaSS): Galaxy Evolution from Filaments to Cluster Cores
Abstract
We present an overview of a multi-wavelength survey of the Shapley supercluster (SSC; z0.05) covering a contiguous area of 260 Mpc2 including the supercluster core. The project main aim is to quantify the influence of cluster-scale mass assembly on galaxy evolution in one of the most massive structures in the local Universe. The Shapley supercluster survey (ShaSS) includes nine Abell clusters (A 3552, A 3554, A 3556, A 3558, A 3559, A 3560, A 3562, AS 0724, AS 0726) and two poor clusters (SC 1327- 312, SC 1329-313) showing evidence of cluster-cluster interactions. Optical () and near-infrared () imaging acquired with VST and VISTA allow us to study the galaxy population down to m⋆+6 at the supercluster redshift. A dedicated spectroscopic survey with AAOmega on the Anglo-Australian Telescope provides a magnitude-limited sample of supercluster members with 80% completeness at m⋆+3.
We derive the galaxy density across the whole area, demonstrating that all structures within this area are embedded in a single network of clusters, groups and filaments. The stellar mass density in the core of the SSC is always higher than , which is the cosmic stellar mass density for galaxies in the local Universe. We find a new filamentary structure (7 Mpc long in projection) connecting the SSC core to the cluster A 3559, as well as previously unidentified density peaks. We perform a weak-lensing analysis of the central 1 deg2 field of the survey obtaining for the central cluster A 3558 a mass of , in agreement with X-ray based estimates.
keywords:
galaxies: evolution – galaxies: clusters: general – galaxies: clusters: individual: A 3552, A 3554, A 3556, A 3558, A 3559, A 3560, A 3562, AS 0724, AS 0726, SC 1327-312, SC 1329-313 – galaxies: photometry – galaxies: stellar contents – gravitational lensing: weak1 Introduction
It is well established that the properties of galaxies are correlated with the environment (e.g. Lewis et al., 2002; Goto et al., 2003; Balogh et al., 2004; Blanton et al., 2005; Baldry et al., 2006; Pimbblet et al., 2006; Haines et al., 2007; Bösch et al., 2013). At galaxy populations in rich clusters are dominated by ellipticals, S0s and at lower masses dwarf ellipticals (dEs) with few, if any, star-forming spirals (Dressler, 1980; Dressler et al., 1985). Cluster galaxies have not always been as inactive as they are at the present epoch. Butcher & Oemler (1984) showed that the fraction of blue (star-forming) galaxies among cluster members increases from almost zero in the local Universe to 20% by , while recent Spitzer/Herschel surveys have confirmed large numbers of starburst galaxies in clusters to and beyond (e.g. Popesso et al., 2012). While some of this rapid evolution of cluster galaxies can be explained by the cosmic decline in star formation among field galaxies since (e.g. Le Floc’h et al., 2005), cluster populations have shown an accelerated evolution in star formation (SF) over the last four billion years, resulting in an overall reduction in the total star formation rates (SFRs) per unit halo mass since (Haines et al., 2013). Empirically, clusters accrete gas-rich, star-forming spirals at .5–1.0 and then contribute to transforming them somehow into the passive S0s and dEs of local clusters.
Several mechanisms affecting the galaxy properties and dependent upon the environment have been proposed and investigated in detail and all of them serve to kinematically disturb spiral galaxies and/or transform their structural properties and/or deplete their reservoirs of gas, and so quench star formation. These physical processes include gravitational and tidal interactions amongst galaxies (Toomre & Toomre, 1972; Moore et al., 1996), between galaxies and the cluster gravitational field (Byrd & Valtonen, 1990), galaxy mergers (Barnes & Hernquist, 1991), group-cluster collisions (Bekki, 2001), ram-pressure (Gunn & Gott, 1972) and viscous stripping (Nulsen, 1982), evaporation (Cowie & Songalia, 1977) and ‘starvation’ (Larson et al., 1980). Since these mechanisms are characterized by different time-scales and efficiencies which depend, in turn, on the properties of both the galaxies themselves (e.g. their stellar masses, morphologies) and their environment, they can affect the galaxy properties in different characteristic ways (Boselli & Gavazzi, 2006; Haines et al., 2007). Examples of this are the different effects of tidal and hydrodynamical interactions. The ram pressure exerted by the hot and dense intracluster medium (ICM) can effectively remove the cold gas supply, truncating the gas disc and quenching star formation, in massive cluster galaxies passing through the centre of rich clusters in about one crossing time ( yr), while the interstellar gas of a massive galaxy may never be completely stripped if the galaxy moves on a tangential orbit or is member of a poor cluster. Repeated high-velocity encounters (harassment) of cluster galaxies can destroy the fragile disc of dwarf galaxies, but not significantly affect the structure of a giant galaxy.
The development of large spectroscopic surveys such as the Sloan Digital Sky Survey (SDSS), plus the availability of panoramic far ultra-violet – far infra-red (FUV–FIR) data from the GALEX and Spitzer space telescopes have allowed the impact of environment on SF to be quantified in unprecedented detail. In these studies, however, the environment and its characteristics are usually treated as ‘static parameters’. While the galaxies move across the cluster, field and filament environments (experiencing different ram pressures, encountering other galaxies and possibly being involved in merging), the cluster potential well, the galaxy density as well as the ICM are usually not considered ‘time-dependent’. Of course, at first pass this approach is an unavoidable reduction on complexity. On the other hand in a hierarchical Universe with the assembly of the structures, the galaxies evolve and move, tending towards denser regions with time, while the environments change too, thus what we actually observe is galaxy evolution in an evolving environment.
The most massive structures in the local Universe are superclusters, which are still collapsing with galaxy clusters and groups frequently interacting and merging, and where a significant number of galaxies are encountering dense environments for the first time. The relative dynamical immaturity of superclusters and the presence of infalling dark–matter halos make them ideal laboratories to test the predictions of hierarchical mass assembly models, and in particular on galaxy evolution. Superclusters are not so rare systems in the Universe (see Sheth & Diaferio, 2011). The observations of superclusters is often considered a challenge to the hierarchical structure formation paradigm since such extreme dense structures, but also voids, are not reproduced by the -body simulations. Yaryura et al. (2011) pointed out that the reason of this discrepancy can be due to the method used to assess the probability of finding such events in the distribution of cold matter. They proposed a new technique to analyse an ensemble of -body simulations in a volume equal to that of the two-degree Field Galaxy Redshift Survey (2dFGRS, Colless et al., 2001) where the probability to find peculiar structures (overdense and underdense) was thus estimated to be 2 per cent and not null.
Superclusters allow in principle both to study dynamical processes such as cluster-cluster collisions and group-cluster mergers and to sample different environments from cluster cores to filaments and fields. Furthermore, within a dynamically active and locally dense structure the probability to observe evidence of environmental effects on galaxy evolution is dramatically enhanced making these systems a sort of magnifying glass to identify the different physical mechanisms which transform the properties of galaxies. In order to address all these aspects, a careful selection of the target is fundamental. The ideal structure should map different environments with evidence of cluster-cluster interactions. Finally, in order to study in detail the galaxy properties a resolution kpc is required in a wide range of galaxy mass down to the dwarf regime where such galaxies are not quenched by internal processes, but are more susceptible to environmental transformations. With all this in mind, we have undertaken a study of the Shapley supercluster which is the largest conglomeration of Abell clusters in the local Universe.
The Shapley Supercluster Survey (ShaSS) will map a 23 deg2 region ( 260 Mpc2) of the Shapley supercluster at , containing filaments and embedded galaxy groups which form a dynamically-bound network connecting nine Abell and two poor clusters, in order to identify the primary locations (groups, filaments, clusters) and mechanisms for the transformation of spirals into the S0s and dEs.
Among the observational studies of superclusters, the STAGES project (Gray et al., 2009) addressed in particular the study of galaxy evolution in the Abell 901(a,b) supercluster at redshift 0.165 while the ORELSE survey (Lubin et al. 2009, but see also Mei et al. 2012) searched for structures on scales greater than 10 Mpc at higher redshifs (0.61.3) with the aim to investigate the properties of member galaxies. The comparison between the STAGES, ORELSE and other similar studies and ShaSS will be then unavoidable and useful to trace the evolution with redshift, although we notice that the area (in Mpc2) of ShaSS is a factor 10 that of the STAGES survey and was chosen to map the filaments connecting the Abell clusters.
The optical survey VST-ACCESS in four bands collected at the ESO VLT Survey Telescope (VST) represents the core of this multi-band project. The infrared coverage with WISE, the dedicated spectroscopic survey with AAT/AAOmega and the Shapley-VISTA survey, together with other proprietary data, provide the fundamental data-set to achieve the scientific goals of ShaSS. In this article we will give an overview of the project and present the first results. In Sect. 2 the motivations and main scientific objectives of the project are discussed. The target is described in Sect. 3. The characteristics and strategy of the survey are described in Sect. 4. Details of the data reduction and analysis of the data quality are given in Sects. 5 and 6, respectively. The first results concerning the characterization of the environment are presented in Sect. 7, where we derive the galaxy density across the whole ShaSS region and the underlying dark matter distribution for the central 1 deg2 field which allows to estimate the mass of the galaxy cluster A 3558. In Sect. 8 we present the summary and conclusions.
Throughout the paper we adopt a cosmology with =0.3, = 0.7, and H0=70 km s-1Mpc-1. According to this cosmology 1 arcsec corresponds to 0.941 kpc at =0.048 and the distance modulus is 36.66. The magnitudes are given in the AB photometric system.
2 Survey motivations and objectives
2.1 The role of large scale mass assembly on galaxy evolution
In CDM cosmological models structure formation occurs hierarchically, such that the most massive halos corresponding to galaxy clusters form latest, doubling their masses on average since (Boylan-Kolchin et al., 2009; Gao et al., 2012), and are also the most dynamically immature. Preferentially located at the nodes of the complex filamentary web, clusters are continually accreting dark matter halos containing individual galaxies or galaxy groups. On average, 50% of galaxies in local clusters have been accreted since (Berrier et al., 2009), of which 40% are within groups (McGee et al., 2009).
The process of central galaxies becoming satellites, as their host halos are accreted into more massive halos, has been shown to strongly affect their evolution, with satellite galaxies more likely to be quenched than central galaxies of the same stellar mass (e.g. Wetzel et al., 2012). Star formation is suppressed within galaxy groups, with the fraction of star-forming galaxies declining steadily with increasing group mass (at fixed stellar mass) and proximity to the group centre (Weinmann et al., 2006; Wetzel et al., 2012; Woo et al., 2013). Galaxies which are quenched within such groups and later accreted into clusters are described as having been ‘pre-processed’.
Numerical simulations and theoretical studies predict the effect of cluster-cluster mergers on galaxy properties. Bekki et al. (2010) claimed that merging of galaxy clusters may induce SF due to the increase of the external pressure of the ICM compressing the cold gas in the cluster galaxies. This results in a population of starburts or post-starburst galaxies having the same age and so dating the merging event. The spatial distribution of these star-forming galaxies is expected to differ from the overall distribution of the other cluster galaxies. Similarly, for comparable group and cluster halo densities gravitational shocking as the group enters the cluster could temporarily increases its mass and pull the group members into a denser, more compact system inducing galaxy mergers (Moss, 2006). Simulations also showed that starbursts induced by galaxy mergers can be amplified by a factor (Martig & Bournaud, 2008) if they take place in the tidal field of cluster/group of galaxies.
Owen et al. (2005) studied the excess population of radio galaxies in the cluster A 2125 at =0.25, mostly located in groups outside the cluster core and with radio luminosities indicating the SF as the main mechanism responsible of the radio emission. The authors related this observational evidence with the ongoing major cluster-cluster merger and explained the increased SF as due to the variation of the tidal field experienced by the member galaxies during a cluster-cluster interaction, probably being close to the core passage. Studying a system of merging clusters, Johnston-Hollit et al. (2008) observed an excess of star-forming galaxies aligned along the bridge of galaxies connecting A 3158 to the A 3125/A 3128 complex, suggestive of merger-induced SF. In addition, they found that the fraction of radio-loud sources is lower with respect to a global cluster environment and similar to that measured by Venturi et al. (2000) in the cluster A 3558 which is considered as an example of a late merger stage. They suggested that in the cluster cores radio emission from active galactic nuclei (AGNs) is suppressed in the late stages of cluster mergers. The suppressed radio emission observed in both bright and faint cluster galaxies has been also associated to cluster merger by Mauduit & Mamon (2007). They explained their findings with the disruption of cool cores, i.e. the gas supply to the central AGN for the bright galaxies, while the low radio loudness and fainter cluster galaxies have been affected by the enhanced ram pressure when crossing the shock front between the merging clusters. Further observational support of the important role that cluster mergers play in triggering the evolution of cluster galaxies is provided by Owers et al. (2012) studying the merging cluster A 2744. They identified three rare ‘jellyfish’ galaxies located in close proximity to the ICM features associated with a merging subcluster and its shock front. Their interpretation is that the SF knots detected in the tails of stripped gas are due to the rapid increase in pressure experienced by the galaxies interacting with the shock.
Hence, the observations seem to confirm that galaxy/group accretion and cluster-cluster merger affect the cluster galaxies and that the galaxy properties can be sensitive indicators of the merger stage.
2.2 Measuring the environmental effects beyond r200
The colour-density relation is observed in galaxy clusters well beyond (e.g. Haines et al., 2009) and the fraction of star-forming galaxies steadily increases with cluster-centric radius. Nevertheless even at 3-5 r200, the fraction of star-forming galaxies is below that seen in the field (e.g. Chung et al., 2011) suggesting that the environment plays a role inducing transformations well outside .
By means of hydrodynamical cosmological simulations Bahé et al. (2013) investigated the trend of cold and hot gas contents and SF as function of clustercentric distance in clusters and groups of galaxies. They found a large-scale trend with cold and hot gas contents and SF increasing with the clustercentric distance, but approaching the values of the field galaxy sample only at (corresponding to 10 Mpc for a massive cluster). Moreover, the SF in low-mass cluster galaxies (M=109-9.5M⊙) still shows a significant discrepancy even at this large radius with respect to that of the field galaxies. According to the authors, three main causes can explain the observed trends: i) ‘pre-processing’ of galaxies within infalling groups; ii) ‘overshooting’ for those galaxies that are not falling in for the first time (also called ‘backsplash’ galaxies); iii) ram-pressure stripping. Of course, the three mechanisms act differently depending on the galaxy and host halo mass and the clustercentric distance, but in any case the radial trend of the hot gas cannot be explained solely by overshooting and pre-processing. A direct interaction with the host group/cluster is also required and their simulations suggest that ram-pressure stripping can strip the hot gas from low- and high-mass galaxies out to several times , although it cannot affect the cold gas except for the low-mass galaxies. The authors also claimed that tidal interaction does not play an important role in the gas removal, but it should be an important factor in the morphological transformation of these galaxies.
S0s differ from normal spirals by their higher bulge luminosities rather than fainter disks (Christlein & Zabludoff, 2004), disfavouring simple RPS or starvation mechanisms (but see Kapferer et al., 2009). Instead, mechanisms such as merging or harassment are capable of channelling material to a central bulge, sufficient to produce the higher central mass densities seen in cluster spirals and ultimately the stellar phase densities found in S0s (Moran et al., 2007). This channeling of material will also likely fuel rapid growth of the central supermassive black hole and trigger a period of nuclear activity. Deep observations are needed to reveal tidal streams or ‘fans’, characteristic of recent merging activity (van Dokkum, 2005).
In-situ transformation via merging in clusters is strongly suppressed due to the high encounter velocities. Low-velocity encounters and mergers should be much more frequent in galaxy groups, leading to the suggestion that the bulge growth required to form S0s occurs primarily via pre-processing in galaxy groups, which are subsequently accreted into clusters (Balogh et al., 2004). Moreover, the S0 fractions of groups match those seen in clusters at the same redshifts, and are much higher than found in the field (Wilman et al., 2009). Strong nuclear activity which is linked to bulge growth is also found to be effectively suppressed in cluster galaxies, with the distribution of X-ray AGN in rich clusters revealing them to be an infalling population with high relative velocities (Haines et al., 2012). This confirms that the transformation of galaxies often occurs (or begins at least) well outside the cluster cores, in groups or as infalling galaxies enter the virialized region for the first time (Moran et al., 2005).
Hints about the distribution of galaxy luminosity, colours and morphology in the filaments have been given by Pandey & Bharadwaj (2006), who found that brighter galaxies have a less filamentary distribution than the fainter ones. With respect to the morphology, the early-type galaxies are concentrated in the vicinity of the nodes, while spiral galaxies are sparsely distributed across the filaments. Fadda et al. (2008) observed that the fraction of starburst galaxies in the filaments around the cluster A 1763 is twice that in other cluster regions as detected by Spitzer and suggested that filaments are a sort of galaxy reservoir for clusters.
By studying a sample of supercluster filaments in the two-degree Field Galaxy Redshift Survey, Porter et al. (2008) observed a sudden enhancement in SF in faint dwarf galaxies outside the cluster virial radius. They interpreted their findings with a close interaction and/or harassment with other infalling galaxies along the same filaments. Another possible explanation is the very first interaction that these galaxies experienced with the ICM inducing tidal shocks and then a burst of SF. Actually, the dominant processes that quench SF in galaxies depend crucially on the galaxy mass. Dwarf galaxies, given their shallow potential wells, should be more susceptible to environmental processes such as tidal/ram-pressure stripping (e.g. Barazza et al., 2009). Indeed their SF histories are completely defined by their local environment, since passive dEs are only found as satellites within massive halos (i.e. cluster, group or massive galaxy; Haines et al., 2006, 2007). The formation of many cluster dEs is often rather recent, manifest by young stellar ages ( Gyr) and the significant populations of starburst and post–starburst dwarf galaxies in the outskirts of local clusters (Smith et al., 2009; Mahajan et al., 2011).
2.3 Relating star formation quenching to ram-pressure stripping
Ram-pressure stripping (RPS), as originally proposed by Gunn & Gott (1972) requires, in principle, the presence of a dense ICM. Thus, its effect would be limited to cluster cores where the gas discs of massive spirals are rapidly truncated. Nevertheless, with a 3–D hydrodynamical simulation, Marcolini et al. (2003) showed that RPS may extend to poorer environments for low-mass galaxies which, thanks to their lower escape velocities, are easier to strip. Roediger & Hensler (2005), by means of high resolution 2D hydrodynamical simulations, demonstrated that ram pressure effects can be observed over a wide range of ICM conditions. In particular, in high density environments RPS severely truncates the gas disc of L⋆ galaxies, while in low density environments, where moderate ram pressure is foreseen, their gas disc is clearly disturbed and bent (Roediger & Hensler, 2005). The gas discs of these galaxies can be truncated to 15-20 kpc in the first 20–200 Myr of RPS.
Merluzzi et al. (2013) identified a bright (LL⋆) barred spiral galaxy 1 Mpc from the centre of the rich cluster A 3558 in the Shapley supercluster core, which is strongly affected by RPS. Integral-field spectroscopic observations revealed ongoing gas stripping in the form of one-sided extraplanar ionized gas along the full extent of the disk, simultaneously with a starburst triggered by gas compression along the leading edge of the galaxy. The galaxy is estimated to be being subjected to weak-moderate ram pressure, as defined by Roediger & Hensler (2005). This adds a piece of evidence to the fact that RPS is acting more efficiently on the galaxy interstellar medium (ISM) than previously foreseen and also outside of the cluster cores as also observed in the Virgo cluster by Chung et al. (2009). This new understanding of the RPS supports the view that this mechanism is the principal transformation process to quench SF in spirals although probably helped by other processes affecting the structure of the galaxies. Bösch et al. (2013) drew a similar conclusion analysing a sample of 182 disk galaxies in the cluster system Abell 901/902. The fraction of galaxies showing asymmetric gas rotation curves, and thus probably affected by RPS (Kronberger et al., 2008), turned out to be 75 per cent higher in the clusters than in the field, the majority of them being morphologically undisturbed. Although these galaxies seemed preferentially located at low clustercentric radii, they also observed a population of dusty and red spirals in the cluster outskirts, which could be also affected by ISM-ICM interactions. The relevance of RPS for quenching SF in cluster galaxies is further complicated by the fact that a non-homogeneous ICM is expected for non virialized merging and post-merging clusters, thus the clustercentric distance is not the only parameter describing the ICM density, i.e. the ram-pressure strength.
2.4 The approach of the Shapley Supercluster Survey
Our study is based on characterizing a dynamically active environment in a multifaceted way and disentangling its effects on galaxy evolution. It has the following main objectives.
- -
-
To investigate the role of cluster-scale mass assembly on the evolution of galaxies mapping the effects of the environment in the cluster outskirts and along the filaments with the aim to identify the very first interactions between galaxies and their environment.
- -
-
To identify and measure signs of ongoing transformation in galaxies belonging to a complex structure with the goal of improving our comprehension of what drives their star-formation quenching and structural modification.
- -
-
To obtain detailed maps of the dark matter and baryonic matter distributions (galaxies, ICM), combining weak lensing, X-ray and dynamical analyses.
- -
-
To quantify the variation in the stellar mass fractions going from cluster cores to groups, by comparing the near-infrared light distribution with the dark matter maps and dynamical masses.
- -
-
To build up a multi-band homogeneous data-set on this area of the sky made of sub-kiloparsec resolution imaging and magnitude-limited spectroscopy, thus providing the community with a solid background for studies of the Shapley supercluster.
To address the above objectives we will explore the global and internal properties of galaxy populations extending outside the cluster/group virial radius and aim for an accurate characterization of the environment. This will be defined through galaxy density, dark matter distribution, dynamical substructure, and ICM properties. The different quantifications of the environment will allow us to disentangle the effects of local and large-scale density, cluster and group merging, dynamical state and mass of the host system on the properties of galaxies in different ranges of mass.
Recent studies investigated the effects of the local and large-scale environment on galaxy evolution, mainly considering groups of galaxies. Some of these works defined the environment through the luminosity-density only (e.g. Lietzen et al., 2012), or associate galaxy groups to a large-scale environment identified by a smoothed luminosity field (e.g. Luparello et al., 2013), or are limited to massive galaxies (e.g. Catinella et al., 2013). Therefore, although there is a general agreement that the group environment is important for the evolution of the group members, a study of global and internal properties of galaxy population in groups and, in general, in different structures dynamically bound in a supercluster is still lacking. For instance, Rasmussen et al. (2012) found that both local (distance from the centre) and global (mass) group environments play a role in quenching star formation, while Ziparo et al. (2014) show that global group-scale mechanisms linked to the presence of a hot gas halo are dominant in quenching SF in group galaxies rather than purely density related processes.
In the following we briefly outline how we will derive the quantities necessary for our study (see also Sect. 4).
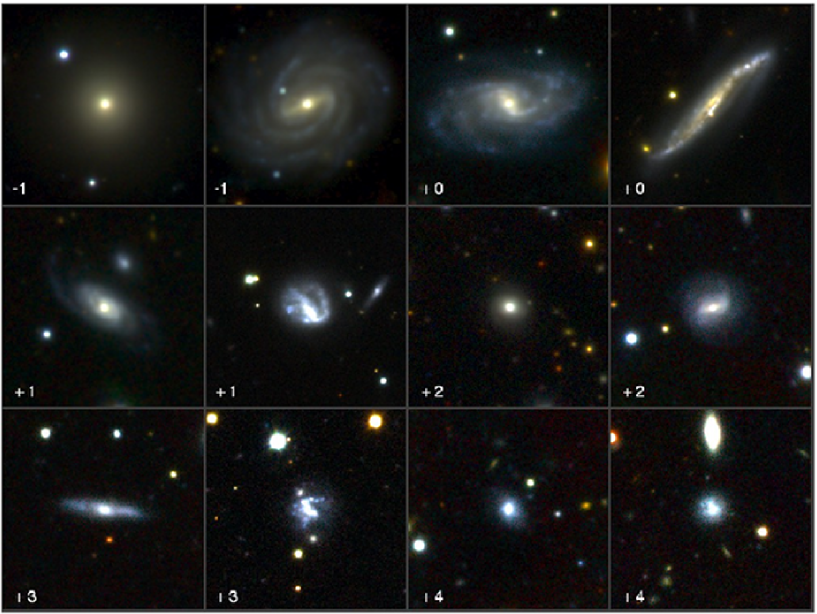
As the main classification scheme of galaxies we will adopt the concentration, asymmetry and clumpiness parameters (Kent, 1985; Bershady et al., 2000; Conselice et al., 2000; Conselice, 2003), complemented by the M20 and Gini coefficients (Lotz et al., 2004; Abraham et al., 2003). This parameter set (hereafter ‘CAS+MG’) has proven to robustly link the internal light distribution of galaxies to their formation and evolution (e.g. Scarlata et al., 2007; Muñoz-Mateos et al., 2009; Kleiner et al., 2014; Holwerda et al., 2014; Lotz et al., 2008; Lotz et al., 2011, and references therein). Besides being effective in separating the different morphological types and tracing star formation, the CAS+MG scheme is particularly sensitive to their recent interaction or merging activities, making it the ideal tool to obtain a census of galaxies whose structure appears disturbed by the environment, which is crucial for our project. For a selected sample of ‘normal’ galaxies (as determined through the CAS+MG parameters) it will be possible to quantify the relevance of (pseudo-)bulges and bars as a function of the environment by surface photometry fitting.
In Fig. 1 we show examples of SSC galaxies in the magnitude range from m*-1 to m*+4 ( mag). For galaxies in this magnitude range we plan to perform classical (visual) morphological classification, that will be used to calibrate the CAS+MG parameters against the Hubble sequence for our data. The signal-to-noise ratio (SNR) and spatial resolution of VST images will instead allow us to obtain reliable CAS+MG parameters up to m*+6 ( mag), i.e. well into the dwarf galaxy regime (see Sect. 4.1). Finally, AAOmega and literature spectra of more luminous galaxies will provide spectral classification through line indices.
Galaxy global properties such as colours, stellar masses and star-formation rates will be derived. The contribution of both unobscured and obscured SFR need to be considered since dust-obscured cluster galaxies are common in merging clusters (e.g. Haines et al., 2009). The –band luminosity will provide a star-formation rate (SFR) indicator once calibrated using the multi–wavelength data already available in the Shapley supercluster core (see Sect. 4.4), by obtaining correlations between luminosity, dust extinction, and metallicity. The available mid-infrared data will provide a robust and independent indicator of obscured star formation (Sect. 4.4), and also allow us to identify AGN via their unusually red W1-W2 colours (e.g. Wright et al., 2010). AGN will also be identified from their emission-line ratios or broad emission lines from the AAOmega spectra, or their X-ray emission in the supercluster core where XMM data are available.
The depths of our survey are conceived to reach the necessary accuracy of all of the above quantities, as will be outlined in the next Sections.
Finally, we will not only measure statistically the environmental effects on galaxy properties on such large scales, but also to ‘catch in the act’ the direct interaction of supercluster galaxies with their environment into the surrounding large-scale structure. The latter is possible only using imaging with a sub-kiloparsec resolution and follow-up integral-field spectroscopy for a few individual cases (e.g. Merluzzi et al., 2013).
3 The target: Shapley supercluster
The ‘remote cloud of galaxies in Centaurus’ first identified by Shapley (1930) is one of the richest superclusters in the nearby Universe, consisting of as many as 25 Abell clusters (Zucca et al., 1993) in the redshift range 0.0330.060 (Quintana et al., 1995, 1997). The first spectroscopic study confirming the existence of the ‘Centaurus supercluster’ was carried out by Melnick & Moles (1987), then it was re-discovered by Scaramella et al. (1989, their ‘-region’) as a cluster overdensity in the Abell et al. (1989, ACO) cluster catalogue and identified by Raychaudhury (1989, his ‘Shapley concentration’) as an excess in galaxy number counts in the UK Schmidt Telescope Sky Survey plates.
The Shapley supercluster (hereafter SSC) because of its peculiar richness and location, lying in the direction of the dipole anisotropy of the Cosmic Microwave Background (CMB), was investigated as responsible of at least a fraction of the Local Group acceleration (Scaramella et al., 1989; Raychaudhury, 1989; Plionis & Valdarnini, 1991; Quintana et al., 1995; Kocevski et al., 2004; Feindt et al., 2013, and references therein). To assess the role of this structure in the acceleration of the Local Group a robust estimate of its mass is required. This gave a boost to spectroscopic and X-ray observations of the supercluster devoted to i) map the whole structure and measure the density contrast in galaxy number counts and mass/number of associated clusters; ii) investigate its dynamical state and iii) derive the underlying mass distribution. A detailed review of the properties of the Shapley supercluster based on previous investigations will be given elsewhere (Merluzzi et al., in preparation), here we will describe the key characteristics of the SSC - i.e. those features making the SSC, and above all its central region, a magnifying glass to investigate the effect of the environment and mass assembly on galaxy evolution.
3.1 Supercluster morphology and dynamics
By analysing a spectroscopic sample across a region of 15 deg in diameter centred on the dominant cluster A 3558, Quintana et al. (1995) concluded that the supercluster has a ‘cigar-shape with the eastern side being the closest to us’ (but see also Drinkwater et al., 2004) and from the flattened geometry they suggested that it is not spherical and virialized. The complex morphology of the SSC comprises a main body at 15000 km s-1 together with walls/filaments/arms of galaxies connecting the three main systems of interacting clusters (the A 3558, A 3528 and A 3571 complexes) as well as a foreground structure connecting the SSC to the Hydra-Centaurus supercluster (4000 km s-1) and hints of a background structure at 23000 km s-1(for details see Quintana et al., 2000; Proust et al., 2006). The main plane of the SSC (14800 km s-1) extends 10x20 deg2 (see Drinkwater et al., 2004). Is this vast and complex structure gravitationally bound? In this case it would be the most massive bound structure known in the Universe.
Applying a spherical collapse model, Reisenegger et al. (2000) found that the SSC is gravitationally collapsing at least in its central region within a radius of 8 Mpc centred on A 3558 including 11 ACO clusters; the very inner region, associated with the massive clusters, is likely in the final stages of collapse. X-ray observations of clusters in the SSC confirmed the overdensity: a factor 10 to 50 cluster overdensity (Raychaudhury et al., 1991) and factor 3 baryon overdensity (Fabian, 1991) over a region of 60x80 Mpc2. These results indicated that the structure is gravitationally bound at least in its central region.
From the ROSAT All-Sky Survey in a region of 0.27 sterad, De Filippis et al. (2005) measured the cluster number density which turned out to be more than an order of magnitude greater than the mean density of Abell clusters at similar latitudes - mainly due to an excess of low-luminosity X-ray systems in the outskirts, suggesting that the supercluster is still accreting low-mass systems. Ettori et al. (1997) analysing a mosaic of 15x20 deg2 of ROSAT and Einstein Observatory X-ray observations centred on A 3558, concluded that the SSC core is dynamically bound within Mpc, approaching the maximum expansion before collapsing, i.e. the turnaround point. On the other hand, the dynamical analysis of Bardelli et al. (2000) proposed a scenario where the SSC has already reached its turnaround radius and the final collapse will happen in Gyr.
Using the X-ray cluster sample of De Filippis et al. (2005) and the spherical collapse model, Muñoz & Loeb (2008) investigated the dynamics of the SSC. Their study showed that the SSC is not bound at a radius of 51 Mpc with an outer shell moving radially away from the centre, while the excess of mass becomes enough to bind a spherical region of 10 Mpc radius.
Recently, Pearson & Batuski (2013) ran -body numerical simulations of the SSC and other superclusters in order to determine what portions of the superclusters were potentially gravitationally bound. The SSC showed the most extended bound structure among the other analyzed superclusters. In particular, A 3554, A 3556, A 3558, A 3560 and A 3562 have a large number of close encounters in their simulations, while an additional pair, A 1736 and A 3559, has also some chance of being bound. In such a crowded environment it is very unlikely that galaxies have not been affected by cluster related processes such as RPS, starvation and/or galaxy harassment and tidal interaction.
One of the key objectives of ShaSS is to constrain the dark matter distribution and mass over this whole region via a weak lensing analysis, and in conjunction with X-ray and dynamical analyses estimate the extent of the region that is gravitationally bound to the SSC core, and determine whether clusters such as A 3559 are currently falling towards the supercluster core.
3.2 The Shapley supercluster core
We now zoom in to the very central dense region of SSC, namely the ‘core’, which consists of three Abell clusters: A 3558, A 3562, and A 3556 and two poor clusters (SC 1327-312 and SC 1329-313), resolved by Breen et al. (1994) by means of X-ray observations. The evolutionary stage of the SSC core (SSCC) is still matter of debate.
| Cluster | RA J2000 | DEC J2000 | redshift | [km s | richnessa | RVIR [Mpc] | Massb [M⊙] | ||||
|---|---|---|---|---|---|---|---|---|---|---|---|
| AS 0724 | 13 13 08.6 | -32 59 38 | 14864157 | 51085 | 0 | 8.81013 | |||||
| AS 0726 | 13 15 11.7 | -33 38 52 | 14892137 | 57877 | 0 | 0.96 | 4.61013 | ||||
| A 3552 | 13 19 00.7 | -31 51 04 | 14753119 | 68260 | 1 | 3.61013 | |||||
| A 3554 | 13 19 27.6 | -33 29 49 | 1443194 | 56066 | 1 | 0.80 | 5.81013 | ||||
| A 3556 | 13 24 00.2 | -31 39 22 | 1435776 | 643 | 0 | 0.98 | 1.71014 | ||||
| A 3558 | 13 28 02.6 | -31 29 35 | 14403 | 996 | 4 | 1.16 | 1.31015 | ||||
| A 3559 | 13 29 53.1 | -29 30 22 | 1413057 | 51945 | 3 | 0.31 | 2.01013 | ||||
| A 3560 | 13 32 22.0 | -33 05 24 | 14551106 | 793116 | 3 | 1.33 | 3.41014 | ||||
| A 3562 | 13 33 47.0 | -31 40 37 | 14455191 | 1197194 | 2 | 0.89 | (3.9)1014 | ||||
| SC 1327-312 | 13 29 45.4 | -31 36 12 | 14844 | 691 | 1.30 | 3.01013 | |||||
| SC 1329-313 | 13 31 36.0 | -31 48 45 | 14790 | 377 | 1.14 | 3.71013 | |||||
| 13348 | 276 | ||||||||||
| a) Abell et al. (1989). |
| b) All the masses are dynamically derived except for that of A 3562 which is derived from X-ray observations. |
| c) De Filippis et al. (2005). |
| d) Proust et al. (2006), the redshift is corrected with respect to the CMB. |
| e) Reisenegger et al. (2000), cluster mass within a radius enclosing an average density 500 times the critical density. |
| f) Ragone et al. (2006), estimates of virial radius and virial mass. |
| g) Bardelli et al. (1998), the mass value is transformed into adopted cosmology. |
| h) David et al. (1999). |
| i) Bardelli et al. (2002). |
| j) Ettori et al. (2000), the mass value is transformed into adopted cosmology. |
| k) Breen et al. (1994). |
| For SC 1329-313 mass and virial radius are estimated for the whole system, while redshifts and velocity dispersions |
| are given for the two different clumps by Bardelli et al. (1998). |
| Uncertanities are quoted when available. |
The dynamical analysis of the SSCC pointed out its very complex dynamical state with interacting clusters belonging to the same structure elongated both in declination and along the line of sight (Bardelli et al., 1994, 1998). Several sub-condensations, detected also in X-ray, could be recognized. Bardelli et al. (1998) identified twenty-one significant three-dimensional subclumps, including eight in the A 3558 cluster alone. This ‘clumpy’ structure as well as the proximity of the clusters (e.g. the Abell radius of A 3556 is overlapped to that of A 3558) makes robust estimates of the cluster velocity dispersions, masses (see Bardelli et al., 1998) and even Abell richness (see Metcalfe et al., 1994) difficult. Based on their spectroscopic study, Bardelli et al. (1998) proposed two alternative evolutionary scenarios for the SSCC: i) a cluster-cluster collision seen just after the first core-core encounter; ii) a series of random mergings occurred among groups and clusters.
Diffuse filamentary X-ray emission has been observed across the whole SSCC (Bardelli et al., 1996; Kull & Böhringer, 1999; Hanami et al., 1999) connecting the clusters. A continuous filament of hot gas connecting A 3562 and A 3558 was also seen in the reconstructed thermal Sunyaev-Zeldovich (SZ) Planck survey map (Planck Collaboration 2013). The distribution of the X-ray emission was found to be clearly asymmetric in A 3562, A 3558 and SC 1329-313 and gradients of gas temperature and metallicity have been measured (Ettori et al., 2000; Akimoto et al., 2003; Finoguenov et al., 2004) suggesting that cluster-cluster mergers have occurred and/or are ongoing. By analysing XMM-Newton observations, Finoguenov et al. (2004) proposed a tidal interaction between SC 1329-313 and A 3562 to explain the observed properties of the hot gas in A 3562 – the tailed shape of the X-ray emission associated with SC 1329-313 as well as the sloshing of the A 3562 core. Another detailed analysis of XMM-Newton and Chandra by Rossetti et al. (2005) pointed out the very complex dynamical history of A 3558 having characteristics which are typical of both merging (e.g. gas temperature gradients) and relaxed (e.g. cool core) clusters. They also detected a cold front leading in the NW direction and probably due to the sloshing of the cluster core induced by the perturbation of the gravitational potential associated with a past merger.
A weak and asymmetric radio halo has been detected in A 3562 (Venturi et al., 2003; Giacintucci et al., 2005). The radio halo correlates with the X-ray emission and presents a radio head-tailed galaxy embedded in it and located between the cluster core and SC 1329-313, thus supporting the interaction between the two systems as proposed by Finoguenov et al. (2004).
A deficit of radio galaxies with respect to the radio-optical luminosity function of other clusters, although probably to be ascribed to A 3558 alone, was observed by Venturi et al. (2000). On the other hand, Miller (2005), with a radio survey of a 7 deg2 region of the SSCC, found a dramatic increase in the probability for galaxies in the vicinity of A 3562 and SC 1329-313 to be associated with radio emission suggesting young starbursts related to the recent merger of SC 1329–313 with A 3562. This observation could be explained by galaxy merging efficiently transferring gas into the galaxy centre, feeding AGN and then switching on SF (Bekki, 1999) .
Although the studies mentioned above are fundamental to demonstrate the complex dynamical status of the SSC and its core, none of them could systematically tackle the issue of galaxy evolution in the supercluster environment due to the lack of accurate and homogeneous multi-band imaging covering such an extended structure. This prevented to collect information about the integrated (magnitudes, colours, SFR) and internal properties (morphological features, internal colour gradients) of the supercluster galaxies. Excluding observations of single clusters in SSC, the first CCD observations covering a deg2 contiguous area of SSCC were those of the ACCESS project (PI: P. Merluzzi; Mercurio et al., 2006; Haines et al., 2006, see Sect. 3.3) which analyzed a galaxy sample complete down to =22.5 (+6) and =22.0 (+7), i.e. well into the dwarf galaxy regime (see Table 2).
3.3 ACCESS project: main results and open issues
The multi-wavelength data-set of the ACCESS 111European funded project: ACCESS: A Compete CEnsus of Star formation in the Shapley supercluster, PI: P. Merluzzi; www.oacn.inaf.it/ACCESS project (see Merluzzi et al., 2010), covering 2-3 deg2 of the SSCC allowed us to obtain the complete census of stellar content and SF across the core region from A 3556 to A 3562. This project was dedicated to investigating the effect of the environment on galaxy evolution in the SSCC exploiting one of the first multi-wavelength data-sets available for such a wide area of a supercluster. The data include panoramic imaging in the UV (Galaxy Evolution Explorer, GALEX), optical (ESO Wide Field Imager, WFI), NIR (UKIRT/WFCAM) and mid-infrared (Spitzer/MIPS), as well as high signal-to-noise ratio (S/N) medium-resolution optical spectroscopy (AAT/AAOmega) for 448 supercluster galaxies. In the following we mention the main results of this project and the open issues that stimulated us to undertake a new multi-wavelength study over a wider supercluster area.
By studying the optical (Mercurio et al., 2006) and near-infrared (NIR, Merluzzi et al., 2010) luminosity functions (LFs) down to m+6 it was found that the slope of the LF increases from high- to low-density environments, indicating that mechanisms such as galaxy harassment and/or tidal stripping contribute to shape the LF. The stellar mass function (SMF), however, does not seems to change its trend with galaxy density in the SSCC and does not show the sharp upturn below =109.5M⊙ observed in the field galaxy population (Pozzetti et al., 2010; Baldry et al., 2012). Is this difference due to the different evolution of the supercluster and the field galaxies, or it is only an artifact due to the different range of stellar masses analyzed for field and supercluster galaxies? And also, which are the different contributions to the galaxy SMF of the blue and red galaxy populations in the supercluster from the cluster cores to the filaments and field? To answer these questions, the mass range should be extended and the membership ascertained.
We also found evidence that the bulk of the star-forming galaxies have been recently accreted from the field and have yet to have their star-formation activity significantly affected by the cluster environment (Haines et al., 2011a) and that the vast majority of SF seen in the SSCC comes from normal infalling spirals (Haines et al., 2011b). Nevertheless, this analysis was limited to galaxies belonging to the SSCC and thus in an extremely dense environment. With the aim to reach a comprehensive picture of how and where galaxies start to quench their SF, it is important to move out from the cluster cores and analyze the properties of the infalling galaxies, i.e. to follow the cluster member from the converging filaments into the clusters. This will also enable us to investigate wether the formation of early-type galaxies, dominant in cluster cores, can be driven by morphological quenching (see Martig et al., 2009) or RPS/starvation (e.g. Crowl & Kenney, 2008). It is unclear which is the most likely and effective process at work (Haines et al., 2011). Wether the formation of passive early-type galaxies in cluster cores should involve the prior morphological transformation of late-type spirals into S0/Sa, mechanisms as pre-processing and tidal interaction have to be considered and quantified. In order to understand if this is the case, we need a morphological study of supercluster galaxies, both isolated and in groups, in the cluster outskirts and beyond.
4 ShaSS: the data
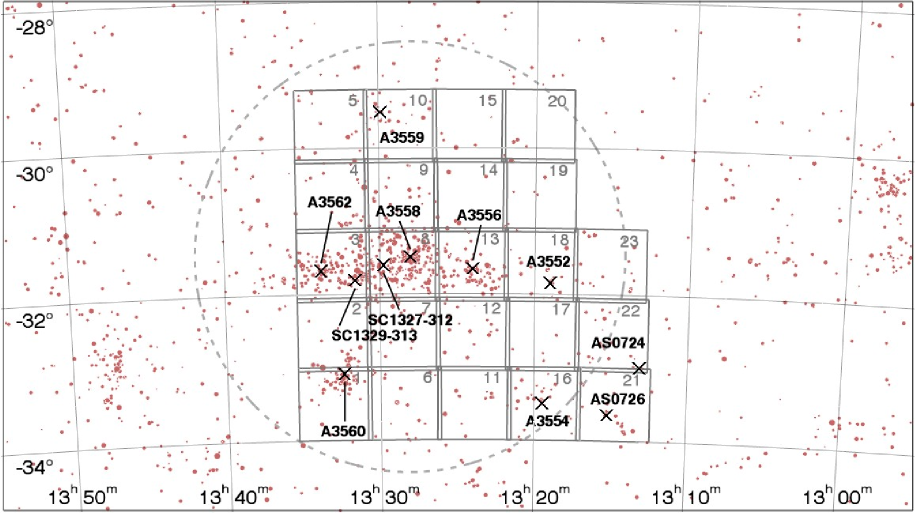
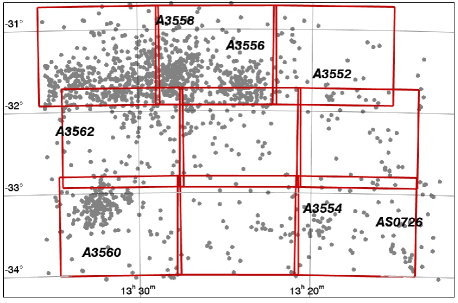
We will map a region of 260 Mpc2 including the SSCC and other six galaxy clusters (AS 0724, AS 0726, A 3552, A 3554, A 3559 and A 3560, see Fig. 2). The supercluster region is chosen to ensure to map the structures directly connected to the SSCC. In fact, the 11 clusters in the region are all within 500 km s-1 of the central cluster A 3558. The survey boundaries are chosen to cover all 11 clusters and the likely connecting filaments, but also to extend into the field (fields 19 and 20 in Fig. 2). The main characteristics of the clusters and groups in the survey are listed in Table 1. We would like to point out that among the other quantities taken from the literature, the virial radii and masses should be considered only indicative for the SSC clusters studied here for which the assumptions of spherical symmetry and isotropy of the velocities are likely not applicable.
The data-set includes optical () and NIR () imaging acquired with VST and VISTA respectively, and optical spectroscopy with AAOmega. At present the -band imaging and AAOmega spectroscopic surveys are completed, while the other observations are ongoing. Table 3 summarizes the depths and completion of the imaging surveys which are described in Sects. 4.1 and 4.3. In the table we list both the target depths and those measured from the data222The noise inside the aperture can be estimated from the flux and its uncertainty derived by SExtractor (see eq. 61 of SExtractor User Manual; www.astromatic.net/software/sextractor. For the characteristics of the spectroscopic survey see Sect. 4.2.
| Band | Exp. Time | depth [5] a | seeing b | complete | |
|---|---|---|---|---|---|
| [s] | target | measured | [arcsec FWHM[ | [%] | |
| 2955 | 24.5 | 24.3 | 0.8-1.1 | 48 | |
| 1400 | 24.2 | 24.8 | 0.6-1.0 | 43 | |
| 2664 | 24.2 | 24.3 | 0.6-0.8 | 61 | |
| 1000 | 22.4 | 23.2 | 0.5-1.0 | 100 | |
| 1620 | 20.4 | 20.3 | 0.6-1.0 | 60 | |
| a) Within a 3 arcsec diameter aperture. |
| b) Range of seeing estimated from the already observed fields. |
4.1 VST-ACCESS survey
The new optical survey (PI: P. Merluzzi), conceived in the framework of the ACCESS project and named after it VST-ACCESS, is being carried out using the Italian INAF Guaranteed Time of Observations (GTO) with OmegaCAM at the 2.6m ESO telescope VST (Schipani et al., 2012) located at Cerro Paranal (Chile). The corrected field of view of 1∘x 1∘ allows the whole ShaSS area to be covered with 23 VST fields as shown in Fig. 2. Each of the contiguous VST-ACCESS fields is observed in four bands: . Red dots in Fig. 2 denote the 1676 spectroscopic supercluster member galaxies ( km s-1) available from literature at the time of the survey planning. The X-ray centres are indicated by crosses for all the known clusters except AS 0726, whose centre is derived by a dynamical analysis.
Survey depths. We will achieve our scientific goals studying the global and internal physical properties of Shapley galaxies down to +6. In particular, we need to i) derive accurate morphology as well as structural parameters (log and ) and detect some of the observational signatures related to the different processes experienced by supercluster galaxies (e.g. extraplanar material); ii) estimate accurate colours, photo– (, see Christodoulou et al., 2012) and stellar masses; iii) evaluate the star-formation rates and resolve the star forming regions at least for the subsample of brighter galaxies. The required SNR depends on which galaxy property is measured: it is higher for the morphological analysis and resolving internal properties/structures (SNR100 in our 3 arcsec aperture, see Conselice et al., 2000; Häussler et al., 2007), but it can be significantly lower for accurate measurements of aperture photometry and colours (SNR20). In the latter case, however, the minimum required SNR should be achieved in all bands.
We chose to use mainly the -band imaging for the morphological analysis, so the band defines the survey depths in all bands. In band (AB magnitude, see Table 2) and at +6=21 we require SNR=100 for the morphological/structural analysis. The completeness magnitude of the catalogue in band is instead defined by the star/galaxy separation (see Sect. 6) which we estimate to be robust down to =23.5 mag (SNR10 within a 3 arcsec aperture), corresponding to a limiting magnitude =24.2 mag (SNR=5). We are collecting the -band imaging under the best observing conditions having a median seeing FWHM0.8 arcsec corresponding to 0.75 kpc at . Additionally, the imaging is fundamental to our weak lensing analysis, to ensure a sufficient density of lensed background galaxies with shape measurements.
The typical colours at for red sequence galaxies in the AB photometric system are: , , according to stellar population models (Bruzual & Charlot, 2003, Gyr, ). This approximation allowed us to estimate the required depths for the other three bands which all should provide complete galaxy samples down to +6 with SNR.
Observation strategy. The 1 square degree unvignetted field of view is sampled at 0.21 arcsec per pixel by OmegaCAM with a 16k16k detector mosaic of 32 CCDs which constitute the science array. The detector mosaic presents gaps up to 25 arcsec and 85 arcsec wide in X and Y direction, respectively. To bridge the gaps, we chose the dither offsetting mode with a diagonal pattern and 5 exposures for , and bands. In order to reach the required depth, cover the gaps and avoid saturation in the centre of bright galaxies, the -band images are instead obtained with 9 exposures and smaller offsets. The contiguous pointings of VST-ACCESS are overlapped by 3 arcmin. This strategy allows, for each band, to use a few pointings observed under photometric conditions in each run to calibrate all the other fields as well as to check the photometric accuracy.
| Field | Bands | ESO Periodsa |
|---|---|---|
| F01 | P89 | |
| F02 | P89 P91 | |
| F03 | P90 P91 P88 P88 | |
| F04 | P90 | |
| F05 | P90 | |
| F06 | P89 P91 | |
| F07 | P89 P91 | |
| F08 | P88 P89 P88 P90 | |
| F09 | P91 | |
| F10 | P90 | |
| F11 | P89 P91 P91 | |
| F12 | P89 P90 P91 P91 | |
| F13 | P90 P90 P89 P88 | |
| F14 | P90 | |
| F15 | P90 | |
| F16 | P89 P90 P91 P91 | |
| F17 | P89 P90 P91 P91 | |
| F18 | P88 P90 P90 P89 | |
| F19 | P91 | |
| F20 | P91 | |
| F21 | P88 P90 P91 | |
| F22 | P88 P90 P90 | |
| F23 | P88 P90 P90 |
| a) For each band in column 2 the period of observations is indicated. |
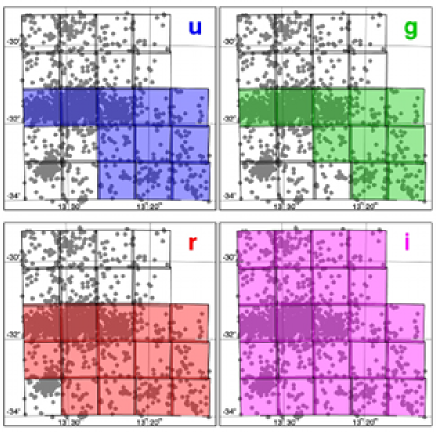
Survey strategy. To carry out the optical survey with VST about 100 hours of telescope time are foreseen. The observations started in February 2012 and are in progress. In the first four ESO semesters a total of 48 h have been allocated of which 87 per cent carried out. We show the coverage at the end of the first two years of the survey (September 2013) in Fig. 3 and in Table 4 the distribution of the observations across this period. The following strategy is chosen to set the priority of the fields to be observed.
- 1)
-
To map the whole area in the band in order to have a magnitude-limited galaxy catalogue with high astrometric and photometric accuracy. This catalogue was mandatory to carry out the spectroscopic survey (see below).
- 2)
-
To collect multi-band optical imaging in the region of the SSCC where we have already available the multi-band data-set (see Sect. 4.4 ) which allows a cross-check of some of the quantities derived from the optical data, e.g. SF indicators.
- 3)
-
To map in optical bands the southern 15 deg2 first, including the two Abell clusters A 3554 and A 3560 and probable filaments connecting these clusters to the SSCC and which is already covered by the VISTA -band survey (see Sect. 4.3).
- 4)
-
To complete then the wavelength coverage of the northern 8 deg2 starting from the eastern side (A 3559).
4.2 AAOmega spectroscopic survey
A spectroscopic survey of 21 deg2 of the ShaSS area333At the time of the AAOmega observations two of the VST fields had not yet been observed. was carried out with the AAOmega spectrograph at the 3.9m Anglo Australian Telescope in May 2013 (PI: P. Merluzzi). The main aim of this survey is to trace the structure of the SSC, beyond the known galaxy clusters, including filaments and groups, in order to describe the local environment in as much detail as possible. We also aimed to reach high completeness in stellar mass and SFR, and for such reason the priorities given to the targets were based on WISE W1 3.4m (as a proxy for stellar mass) and W3 12m (as a proxy for SFR) magnitudes. The detailed analysis of the spectroscopic survey will be presented in a forthcoming article. Here, we note brief details of this process and the pertinent numbers of galaxies recovered.
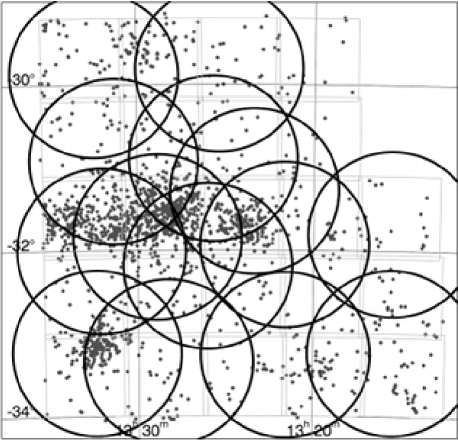
AAOmega is a dual-beam fibre-fed spectrograph, allowing the acquisition of up to 392 simultaneous spectra of objects in a two degree diameter field on the sky. Our observations were carried out with gratings 580V and 385R on the blue and red arm respectively, covering the wavelength range 370 – 880 nm at a resolution of 1300. The survey consisted of 14 AAOmega pointings of 1.5 h integration time (including several repeats to constrain the pair-wise blunder rate444This is the incidence rate where one measures and re-measures (independently) the redshift of a target galaxy. If these two values are different by 600 km s-1, it is a pair-wise blunder (Colless et al., 2001).), whose centres were determined using a simulated annealing algorithm in the same manner as Drinkwater et al. (2010) which allows to optimize the number of targets. Figure 4 shows the configuration of the 14 AAOmega pointings superimposed to the VST fields.
The data were reduced in a standard manner using 2dfdr (Lewis et al., 2002) which included a Laplacian edge detection to remove incident cosmic rays. Redshifts where obtained using the runz code common to 2dFGRS, 2SLAQ, GAMA, WiggleZ (Colless et al., 2001; Cannon et al., 2006; Driver et al., 2011; Drinkwater et al., 2010) which involves Fourier space correlation of each spectrum to a wide batch of template spectra.
We obtained 4037 new redshift measurements in the whole area, which, combined with pre-existing measurements, give a total of 6130 redshifts. In the redshift range of the SSC assumed here (see Fig. 7), the available redshifts are now 2281, of which 915 have been obtained with our AAOmega survey (see Sect.7.1). Beyond the SSC, 3014 AAOmega redshifts encompass the large-scale background structure, unveiling remarkable peaks in the range =0.07–0.25 which were mostly unknown before.
The AAOmega survey is 80 per cent complete down to mag, W1=14.7 mag and W3=10.7 mag. These two last translate into a completeness of 80 per cent in stellar mass and SFR of respectively 8.7 M⊙ and SFR0.7 M⊙ yr-1 at the supercluster redshift. The value of the stellar mass is obtained by means of the W1-stellar mass calibration as determined by matching SDSS DR7 galaxies at the same distance as the SSC, with stellar mass estimates from Salim et al. (2007) and Blanton & Roweis (2007), to the WISE all sky-catalogue, and taking the best-fit linear relation between W1 flux and stellar mass. The SFR is evaluated from the W3 magnitude using eq. 1 of Donoso et al. (2012).
4.3 Shapley-VISTA -band survey
The NIR survey (PI: C. P. Haines) is being carried out with VIRCAM at the 4m ESO telescope VISTA located at Cerro Paranal (Chile). These -band observations are accomplished using the Chilean GTO.
VIRCAM covers 0.59 deg2 per single pointing (paw-print) with 16 2048pxl2048pxl detectors. The gaps between the arrays amount to 90 per cent and 42.5 per cent of the detector size along the X and Y axis respectively. So, to obtain a contiguous coverage of the field of view six offsetting paw-prints (a tile) are needed. The mean pixel size is 0.339 arcsec. Almost all the ShaSS area can be covered with 15 VIRCAM tiles. At present, the 9 tiles in Fig. 5 have been observed.
Combination of the -band data with the VST optical imaging () we will derive accurate stellar masses by means of stellar population models constrained by the observed optical and infrared colours. This will allow us to robustly measure the SMF and distinguish the contributions of star-forming and passive galaxies to the SMF in different mass ranges down into the dwarf regime.
VISTA survey depths. To achieve our scientific goals we need to estimate stellar masses down to M⊙ (see Sect. 3.3) corresponding to 19.6 (+8, see Table 3) which is therefore the requested completeness limit for accurate aperture photometry (SNR10 for a point source in 3 arcsec aperture). In order to estimate the NIR-optical colour gradients with 20-30 per cent accuracy using VST-ACCESS and Shapley-VISTA data, a SNR40-50 is required and according the survey depth this can be achieved at magnitudes brighter than 17.7 corresponding to +6 (M⊙, Merluzzi et al., 2010).
VISTA observations and survey strategy. The 13.5 deg2 southern ShaSS regions was observed in the band by VISTA in April–May 2014 (093.A-0465: 18 hours allocated), covered by a mosaic of VIRCAM tiles as shown in Fig. 5. Each stacked paw-print image consists of s exposures, repeated using 5-point jitter pattern with a maximal offset from the central position of 30 arcsec. Each tile of six paw-prints was observed a second time, such that each point within the tile region was covered by four stacked paw-prints555Each point within a tile is covered by 2 of the 6 paw-prints., giving an exposure time of 1620 s per-pixel. As for the VST-ACCESS survey, the tiles are slightly overlapped ( arcmin in Y and arcmin in X) to confirm the consistency of the photometry from one tile to another. Initial data reduction steps were performed at the Cambridge Astronomical Survey Unit (CASU) using a software pipeline developed specifically for the reduction of VIRCAM data, as part of the VISTA Data Flow System666http://casu.ast.cam.ac.uk/surveys-projects/vista/vdfs (VDFS Irwin et al., 2004). VISTA magnitudes are calibrated onto the Vega magnitude photometric system using unsaturated 2MASS stars in the image, based on their magnitudes and colours in the 2MASS point source catalogue. The resultant stacked -band images have FWHMs in the range 0.6–1.0 arcsec. The -band magnitude detection limit at 5 within a 3 arcsec aperture turns out to be 20.3 mag.
We aim to complete observations of the remaining northern 8 deg2 region with VISTA in 2015.
4.4 Complementary data
The Wide-field Infrared Survey Explorer (WISE, Wright et al., 2010) is a NASA Explorer mission that observed the entire sky in 2010 in four near/mid-infrared bandpasses: 3.4 m (W1), 4.6 m (W2), 12 m (W3) and 22 m (W4). All the data have been reduced, calibrated and released to the public777http://irsa.ipac.caltech.edu/Missions/wise.html. The WISE satellite made twice as many passes of the region covered by the ShaSS survey as it did on average for most areas of the sky (the ecliptic poles excluded), and so the limiting magnitudes are slightly deeper than the typical WISE depths reaching W1=16.96 (Vega magnitude) at SNR=10. This corresponds to m⋆+5 for galaxies in the SSC. The W2 filter (4.6 m) is a magnitude shallower. We typically reach W2=15.26 at a SNR of 10. The W3 filter (12 m) reaches a depth of W3=11.12 mag (1.0 mJy) at a SNR of 10. This corresponds to a SFR of 0.46 M⊙yr-1 for galaxies in the SSC (eq. 1 of Donoso et al., 2012). The W4 filter (22 m) reaches a depth of W4=7.58 (7.7 mJy) at SNR of 10. This corresponds to a SFR of 2.1 M⊙yr-1 for galaxies in the SSC. The resolution of the WISE bands are 6.1 arcsec, 6.4 arcsec and 6.5 arcsec FWHM in bands W1, W2 and W3. W4 instead has a FWHM of 12.0 arcsec.
To cross-correlate WISE and optical catalogues, we use the software STILTS888http://www.star.bris.ac.uk/ mbt/stilts searching for the closest match within a 3 arcsec radius between the VST-ACCESS and WISE detections. Due to higher spatial resolution, the astrometry of the optical images is more accurate and source deblending is checked to avoid multiple detections of a single extended source. In the WISE catalogue, excluding the very extended and bright sources, i.e. few resolved nearby galaxies, there are very few multiple detections of extended sources. This allows us to associate each optical () detection only with one IR detection. The few cases of multiple detection of extended sources in the IR images are then fixed in the final cross-correlated optical-IR catalogue. This approach has been adopted for the -WISE catalogue used for the spectroscopic survey. We note also that nearby IR resolved galaxies were not spectroscopic targets, since their redshifts were already available from the literature.
The ShaSS data are complemented in the central 2-3 deg2 by Spitzer/MIPS 24/70m photometry and GALEX near-ultraviolet and far-ultraviolet imaging which allowed us to produce a complete census of SF (both obscured and unobscured), extending down to SFRs 0.02–0.05 M⊙yr-1, i.e down to levels comparable to the SMC. Although these data do not cover the whole ShaSS region they are fundamental for our survey. The W3 data will enable us to measure the SFR down to 0.2 M⊙yr-1 at 5, while the W1-W3 colour allows us to reproduce and map the bimodal galaxy distributions seen in the f galaxy colours in the supercluster core (Haines et al., 2011a), but over the entire supercluster region, splitting the supercluster galaxies into star-forming, transitional and passive populations. This is possible because we verified that a strong linear correlation exists between W1-W3 colour and f.
Near-infrared -band imaging from the United Kingdom Infrared Telescope with the Wide Field Infrared Camera are also available for 3 deg2 in the SSCC providing a complete galaxy sample down to =18 (Merluzzi et al., 2010). XMM-Newton archive data are available for the SSCC region and for A 3560 and will enable us to map the ICM gas and to identify possible shock fronts due to cluster mergers and then to investigate the effects of such events on galaxy properties.
For a subsample of supercluster galaxies, we have been obtaining integral-field spectroscopy with WiFeS (Dopita et al., 2007) on the Australian National University 2.3m telescope at Siding Spring in Australia. We are targeting a few bright (+1.5) supercluster galaxies showing evidence of undergoing transformation. All these galaxies are selected by either disturbed morphology, such as asymmetry and tails, or evidence of star-formation knots (Merluzzi et al., 2013). For these objects, we also have obtained H imaging with Maryland-Magellan Tunable Filter (MMTF; Veilleux et al., 2010) on the Magellan-Baade 6.5m telescope at the Las Campanas Observatory in Chile.
| Night | Band | ZP | colour term | extinction |
|---|---|---|---|---|
| 2013-02-13 | u | 23.261 0.028 | 0.026 0.019 () | 0.538 |
| 2013-03-16 | g | 24.843 0.006 | 0.024 0.006 () | 0.18 |
| 2012-04-29 | r | 24.608 0.007 | 0.045 0.019 () | 0.1 |
| 2012-02-27 | i | 24.089 0.01 | -0.003 0.008 () | 0.043 |
5 VST data reduction
The VST images have been processed using the VST–Tube imaging pipeline (Grado et al., 2012), developed for the data produced by the VST.
After applying the overscan correction and bias subtraction, we divide by the master flat - a normalized combination of the dome and twilight flats, in which the twilight flat is passed through a low-pass filter first.
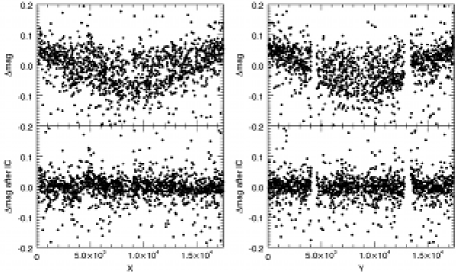
Due to differences between the electronic amplifiers, the CCDs do not have the same gain levels. In order to have the same photometric zeropoint (ZP) for all the mosaic chips a gain harmonization procedure has been applied. The procedure finds the relative CCD gain coefficients which minimizes the background level differences in adjacent CCDs. A further correction is needed for the light scattered by the telescope and instrumental baffling. The resulting uncontrolled redistribution of light adds a component to the background and the flat field will not be an accurate estimate of the spatial detector response. Indeed, after flat-fielding, the image background will appear flat but the photometric response will be position-dependent. This error in the flat-fielding can be mitigated through the determination and application of the illumination correction (IC) map. The IC map is determined by comparing the magnitudes of photometric standard fields with the corresponding SDSS DR8 PSF magnitudes. The differences between the VST and SDSS magnitudes are plotted vs. X and Y axis in Fig. 6 before (top panels) and after (bottom panels) the IC. Usually, the same IC map can be used for observations carried out on the time scale of a month.
In the case of the i band it is required to correct for the fringe pattern due to thin-film interference effects in the detector of sky emission lines. Also this is an additive component that must be subtracted. The fringing pattern is estimated using the ratio where SuperFlat is obtained by overscan and bias correcting a sigma-clipped combination of science images and TFlat is the sky flat. To this aim, the dithering amplitudes of the science frames used must be larger than the extended object sizes in the same images. This is mandatory to allow the sigma-clip procedure to efficiently remove such objects. The difference between the above ratio across the image and its model obtained with a surface polynomial fit is the fringing pattern. The fringe pattern is subtracted from the image applying a scale factor which minimizes the absolute difference between the peak and valley values (maximum and minimum in the image background) in the fringe corrected image.
The relative photometric calibration among the exposures contributing to the final mosaic image is obtained comparing the magnitudes of bright unsaturated stars in the different exposures, i.e. minimizing the quadratic sum of differences in magnitude using SCAMP (Bertin, 2006). The absolute photometric calibration is computed on the photometric nights comparing the observed magnitude of stars in photometric standard fields with SDSS photometry. For those fields that are not observed in photometric but clear nights, we take advantage of the sample of bright unsaturated stars in the overlapping regions between clear and photometric pointings and, by using SCAMP, each exposure of the clear fields is calibrated onto the contiguous photometrically calibrated field. In Table 5 we give examples of the fitted values for the ZP and colour term obtained using the Photcal tool (Radovich et al., 2004). In several cases, the photometric standard star fields were observed with insufficient span in airmass to do a suitable fit. The extinction coefficient was then taken from the extinction curve provided by ESO. The errors listed in Table 5 are those of the fit. The actual errors for the ZP is given by the r.m.s. of the detection among the different exposures of each pointing and turns out to be less than 0.03 mag in all bands.
The relative astrometry among the pointings is derived using SCAMP, while for the absolute astrometry we refer to the astrometric catalogue 2MASS obtaining arcsec astrometric accuracy in all bands. The image resampling, application of astrometric solution and co-addition is performed using the tool SWARP (Bertin et al., 2002) which produces the final stacked image with a weighted average. At the stage of the co-addition the scale factors for relative and absolute photometric calibration are applied.
6 Analysis of the optical images
Once the mosaic images were obtained, we proceeded with the catalogue extraction and measured the photometric accuracy and completeness. Details of ShaSS catalogue extraction and release will be given in a companion article (Mercurio et al. in preparation).
We used the software package SExtractor (Bertin & Arnouts, 1996) estimating the background locally and using a Gaussian filter for source detection. For each source we measured magnitudes in different apertures as well as Kron and PSF magnitudes.
To distinguish between stars and galaxies, we adopted a progressive approach (Annunziatella et al., 2013) using the following parameters provided by SExtractor: i) the stellarity index to select point-like sources; ii) the half-flux radius as a measure of source concentration; iii) the new SExtractor parameter which takes into account the difference between the model of the source and the model of the local PSF; iv) the peak surface brightness above background; v) a final visual inspection for objects with ambiguous values of the stellarity index.
We estimated the completeness magnitudes using both trends of the galaxy number counts and the method by Garilli et al. (1999). The catalogues turned out to be 100 per cent complete at the total magnitudes of 23.9-24.1, 23.8-24.0, 23.3-23.5, 21.8-22.0 mag in bands, respectively. The ranges of magnitudes are due to small differences in seeing among the VST fields.
We measured the SNR inside a 3 arcsec aperture as function of magnitudes achieving SNR=20 at at 22.8, 23.3, 22.8, 21.7 mag, respectively. SNR100 is reached at 21.1 mag in band (m⋆+6) as required. These depths enable us to study the galaxy population down to m⋆+6.
7 Results
In this section we derive the first quantitative characterization of the environment in the survey area in terms of stellar mass density. We also derive the dark matter distribution in the very centre of the SSCC including the cluster A 3558 and the poor cluster SC 1327-312.
7.1 Galaxy density
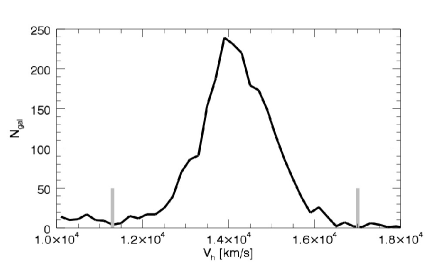
To map the structure of the supercluster, and determine its extent in redshift space and across the plane of the sky, we take advantage of our redshift survey which allows us to demarcate the supercluster in redshift space as lying within the recession velocities 11300–17000 km s-1 (see Fig. 7). These cuts select a supercluster sample of 2281 galaxies across the ShaSS area.
Each galaxy was weighted () according to the inverse probability of it having been observed spectroscopically. Firstly, each galaxy which could have been targeted for spectroscopy (, ) or was a spectroscopic member of the supercluster, was given an initial equal weight of 1.0. For each of these galaxies lacking a redshift, its weight was transferred equally to its ten nearest neighbours with known redshift that also had the same priority level in our AAOmega spectroscopic survey. This results in galaxies without redshifts having zero weight, while galaxies in regions where the spectroscopic survey is locally 50 complete having weights of 2.0. The transferring of weight only within priority levels ensures that we can account statistically for the systematic differences in spectroscopic completeness from one level to another, as well as mapping the local spatial variations in completeness.
Each galaxy belonging to the supercluster is represented by a Gaussian kernel whose transverse width is iteratively set to , where is the geometric mean of the , and a fixed radial width of 700 km s-1. Each galaxy is normalized by the weight parameter to account for spectroscopic incompleteness. The transverse kernel width for each galaxy is initially set to arcmin, and then iteratively adjusted to account for variations in the spatial density of galaxies, such that it typically encloses the 5 to 10 nearest neighbours of the galaxy, irrespective of its location within the supercluster.
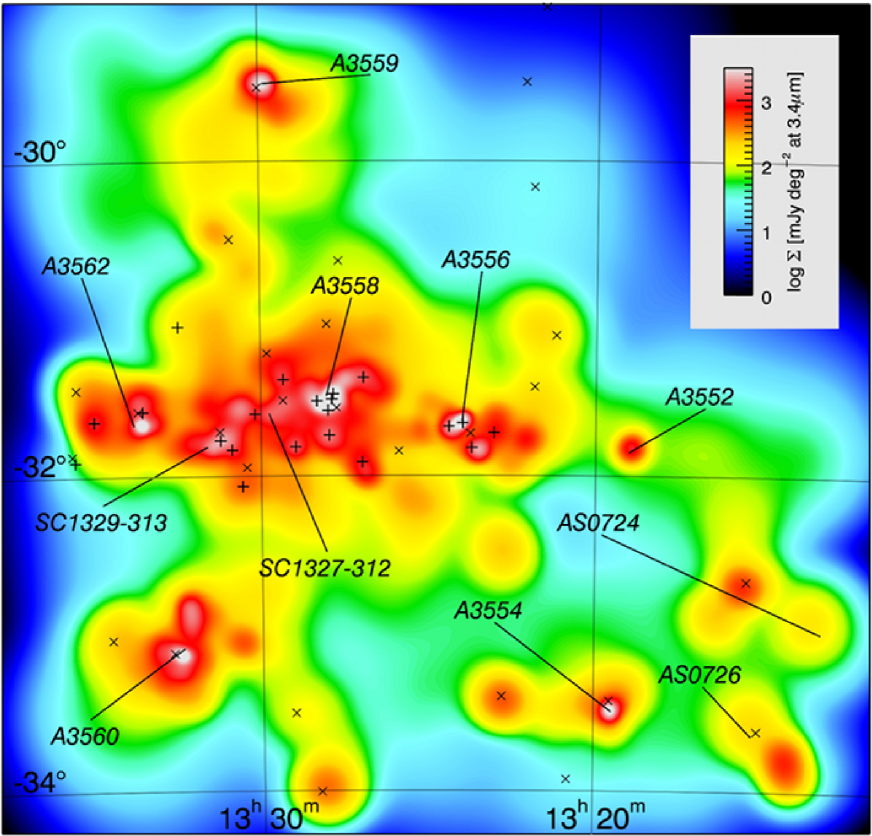
Figure 8 shows the resulting density map in which each galaxy is further weighted by its W1 flux as a proxy for its stellar mass (e.g. Jarrett et al., 2013; McGaugh & Schombert, 2014; Meidt et al., 2014). The density map draws our attention to several features of the whole structure.
- a)
-
Across the SSCC the density of supercluster galaxies is always higher than 315 mJy deg-2. This corresponds to based on the W1–stellar mass calibration obtained for the SSC galaxies (see end of Sect. 4.2). Assuming a depth of 5000 km s-1 or 71 Mpc the stellar mass density is . Both the stellar mass estimates include a 12% correction to account for the low-mass galaxies with or W not targeted in our spectroscopic survey, based on the stellar mass function of Baldry et al. (2012). This is a mean overdensity of with respect to the cosmic total stellar mass density for galaxies in the local Universe () estimated by Baldry et al. (2012) from the GAMA survey (Driver et al., 2011). We obtain a similar overdensity of 35–40 if we simply compare the observed W1 flux density of SSCC galaxies with the average W1 flux density of galaxies within the same redshift range selected from the SDSS DR7 (8032 deg2). Although the SDSS is -band selected, it should be complete to W1=14.5 at , and only marginally incomplete to W1=15.0. The higher density peaks in the SSCC, corresponding to the cluster cores but also the groups and cluster sub-structures, are interconnected forming a single system. This implies that the galaxy distribution follows the hot gas distribution observed across the whole SSCC (e.g. Kull & Böhringer, 1999).
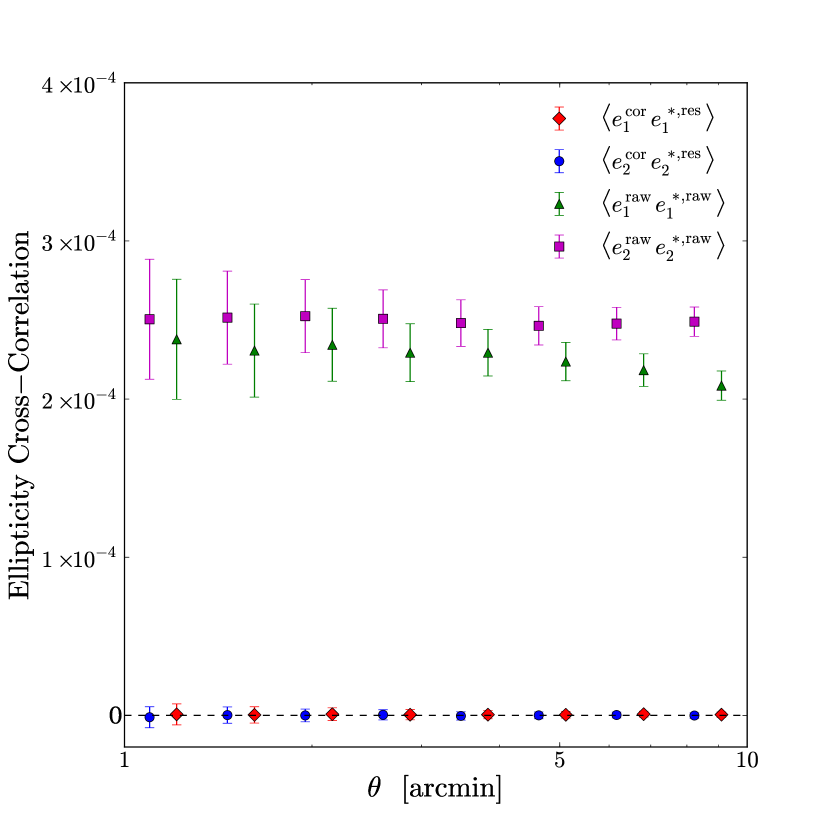
Figure 9: Cross-correlations for galaxy and stellar ellipticities, . Red diamonds () and blue circles () denote the correlation function for corrected galaxy ellipticities, and residual stellar ellipticities, after correcting the PSF anisotropy. Green triangles () and magenta squares () are the correlation function for raw galaxy ellipticities, and raw stellar ellipticities, before the correction. The separation radii are offset by . - (b)
-
There is clear evidence of a filament (7 Mpc in projection) heading north from the SSCC, connecting it with A 3559, with W1 flux densities of 50 mJy deg-2 ( overdensities). Quintana et al. (2000) qualitatively indicated a ‘broad arm running north’ from the SSCC, but in their description this feature should point to A 3557a which is located NW of the ShaSS region. In this direction we do not detect any clear overdensity.
- c)
-
Several overdensities are detected across the density map. Some of them can be associated to cluster dynamical substructures already identified by Bardelli et al. (1998, see Fig. 8), but other density peaks are also detected, i.e. that W of A 3556. The positions of the system centres as defined by X-ray peak and galaxy overdensity appear slightly different, as expected in dynamically active systems. The highest discrepancy between these determinations is found for AS 0724, where the X-ray centre is located 35 arcmin from the galaxy overdensity centre. Notice that AS 0726 was not detected by ROSAT and its centre was derived by a previous spectroscopic survey (Proust et al., 2006), likely affected by incompleteness. Our newly detected overdensity is actually located 16 arcmin from the previous centre.
- d)
-
In A 3560 two main density clumps are sharply defined together with a western clump. The northern clump can be related to the X-ray emission, elongated towards A 3558, detected in the very centre of the cluster which suggested a minor merger scenario between the main cluster and a group located arcmin N of the cluster centre (Venturi et al., 2013). Also the galaxy distribution shows an asymmetric shape elongated in the N direction, but extending a factor two in projection with respect to the X-ray emission (c.f. Fig. 5 of Venturi et al., 2013), taking into account only the two denser clumps in our map. Thus the group involved in the claimed merger could be significantly more massive than that previously identified in the APM catalogue.
In a companion paper, we will assign galaxies to supercluster structures/overdensities. This will be achieved through the dynamical analysis enabling us to detect and measure the amount of cluster dynamical substructures, and to identify possible pre-merging clumps or merger remnants. In particular, we will i) select cluster members (e.g. Fadda et al., 1996; Girardi et al., 1996); ii) derive the centre of the most significant peaks of each identified system applying the 2D adaptive kernel technique to galaxy positions; iii) detect possible subclumps and assign objects to groups (Ashman et al., 1994); iv) identify the 3D substructures combining velocity and position information (Dressler & Shectman, 1988).
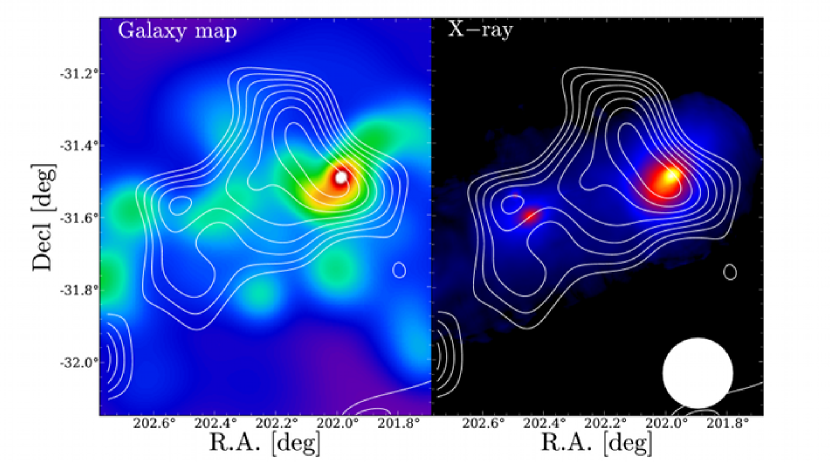
7.2 Weak lensing mass distribution of A 3558
We conducted a weak lensing analysis of the VST-ACCESS field 8 (see Fig. 2) following Kaiser et al. (1995) as modified by Okabe et al. (2013, 2014). We measure image ellipticity of objects detected in the -band data, , from the weighted quadrupole moments of the surface brightness. We then correct a PSF anisotropy of galaxy ellipticities by the function of second-order bi-polynomials of the stellar anisotropy kernel. A cross correlation function of residual stellar ellipticities and the corrected galaxy ellipticities does not show overcorrection or insufficient correction as shown in Fig. 9. Then, a reduced distortion signal, , is estimated with a correction of isotropic smearing effect. We select background galaxies following Okabe et al. (2013) and adopt a new method for minimizing the contamination of member galaxies extending to the colour-colour plane. We measure two colours, and , and fit the red sequence with a linear function. A colour offset is defined for each galaxy by , where and and ‘ES0’ denotes the red sequence galaxies. We select background galaxies by which is the lower limit to allow contamination level. The number density of background source galaxies is , and their mean redshift is .
The mass map is reconstructed as described in Okabe & Umetsu (2008). The reduced shear is pixelized into a regular grid with a Gaussian smoothing, . The FWHM resolution of the map is 11.7 arcmin. The smoothed shear pattern is estimated with a Gaussian kernel, , and a statistical weight for the th galaxy, where is the rms error of the shear estimate and the softening constant variance. We choose as a typical value of the mean rms of . We next invert the smoothed shear field with the kernel (Kaiser & Squires, 1993) in Fourier space to obtain the projected mass distribution. The resulting mass map, , for field 08 of VST-ACCESS is shown in Fig. 10. The mass map is elongated along the east-west direction which is parallel to the large-scale filamentary structure. A main peak is associated with distributions of member galaxies and diffuse X-ray emission of A 3558. Another possible clump, located E of A 3558, is likely associated with diffuse X-ray emission of the galaxy group SC 1327-3136.
We compute the tangential distortion component, , with respect to the projected cluster-centric radius from the BCG of A 3558, shown in Fig. 11. The lensing signal is decreasing as the radius, increases, and becomes flat or increases at arcmin. To understand this feature, we fit the two-dimensional shear pattern with two mass components: A 3558 and the east clump (e.g. Okabe et al., 2011). We use the Navarro Frenk & White (NFW) profile (Navarro et al., 1996, 1997) as the mass model represented by two parameters: which is the enclosed mass within a sphere of radius , and the halo concentration . Here, is the radius inside of which the mean density is times the critical mass density, , at the redshift . Since it is difficult to constrain the concentration for the east clump, we assume a mass-concentration relation (Bhattacharya et al., 2013). The centre of A 3558 is fixed at the BCG position, while the position of the secondary mass component is treated as a free parameter. The model is described by five parameters in total. The best-fit M500 for A 3558 is M⊙. The total lensing signal of the two components (solid line in Fig. 11) well describes the observed lensing signals. Since A 3558 and the east clump are embedded in the SSCC, surrounding data are essential to further constrain the mass.
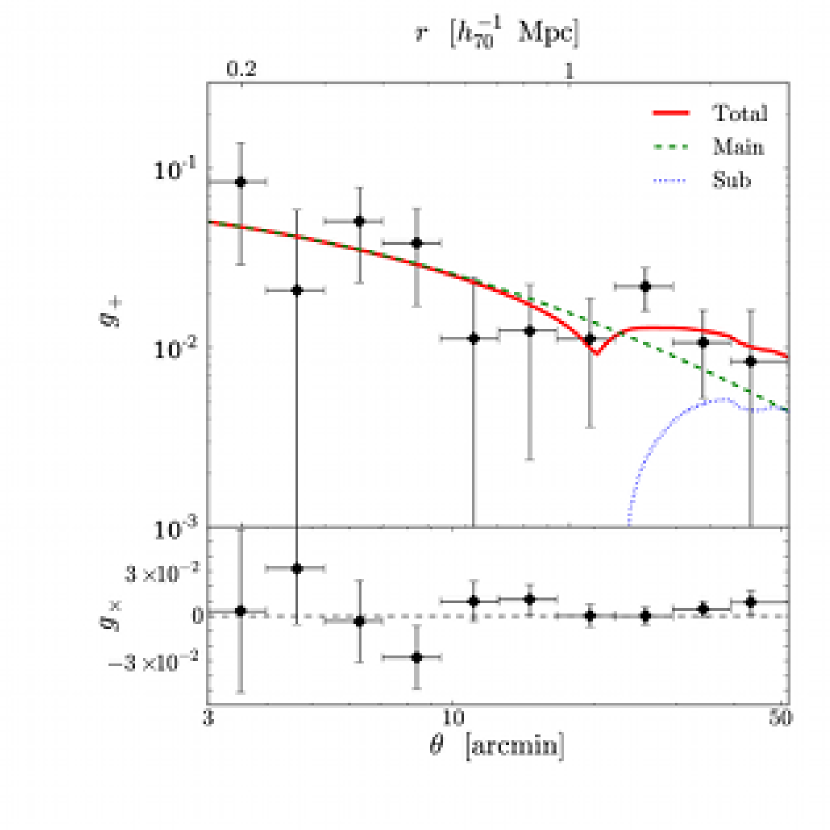
Although this is a preliminary result, the derived dark matter mass can be compared with that evaluated from the XMM-Newton data-set. To this aim, we computed the YX mass proxy, defined as the product of gas mass Mgas,500 and average temperature (Kravtsov et al., 2006). As described in Bourdin & Mazzotta (2008), we inverted a gas mass profile from the radially average surface brightness of A 3558, then iterated about the YX-M500 scaling relation calibrated from hydrostatic mass estimates in a nearby sample of clusters observed with XMM-Newton (Arnaud et al., 2010). Note that the surface brightness of A 3558 has been evaluated within an angular sector excluding the eastern filament connecting A 3558 to SC 1327-312. This yielded estimates of gas mass MM⊙, average temperature keV, and total mass MM⊙ within r kpc, which is consistent with the WL estimate. Previous X-ray mass estimates based on ROSAT data gave for M500: 8.7M⊙ (Ettori et al., 1997); 6.09M⊙ (Reisenegger et al., 2000); 8.4M⊙ (30% uncertainty, Muñoz & Loeb, 2008). The dynamical mass derived by Bardelli et al. (1998) of A 3558 and listed in Table 1 turns out to be a factor 1.7 higher than the WL mass, but also a factor 3 higher than X-ray mass determination previously available as the authors stated in their work. Ragone et al. (2006) computed the dynamical mass inside the virial radius obtaining Mvir=6.7M⊙.
8 Summary and conclusions
The Shapley Supercluster Survey (ShaSS) aims to assess the role of cluster-scale mass assembly on galaxy evolution searching for possible connections between the properties of the cosmological structures (density, dynamical status, hot-gas content, dark and luminous matter distribution) and those of the associated galaxies (morphology, internal structure, star formation, nuclear activity). This requires that we extend the investigation from the cluster cores to their outskirts, to the infalling galaxies and groups along the filaments in a dynamically-bound network. The centre (3 deg radius) of the Shapley supercluster at is the optimal target to undertake such a study enclosing a massive and dynamically active structure showing signs of cluster-cluster mergers, enhancing the probability to observe evidence of environmental effects on galaxy evolution, but also providing an extraordinary variety of environments concentrated in a small survey volume.
ShaSS includes nine Abell clusters (A 3552, A 3554, A 3556, A 3558, A 3559, A 3560, A 3562, AS 0724, AS 0726) and two groups (SC 1327-312, SC 1329-313) covering a region of 260 Mpc2. The survey includes the following data-sets.
- -
-
Optical () imaging acquired with the VLT Survey Telescope (PI P. Merluzzi) provides a galaxy catalogue complete down to (SNR10, limit for star/galaxy separation as measured from the collected data) corresponding to m⋆+8.3 at the supercluster redshift. The multi–band catalogue is complete to m⋆+7.1 and the -band catalogue to m⋆+6.7. The achieved SNRs allow to study the galaxy population down to m⋆+6 and derive morphological parameters (CAS+MG, see Sect. 6) in band to the same depth. The VST-ACCESS survey is ongoing.
- -
-
Near-infrared () imaging acquired with the Visible and Infrared Survey Telescope for Astronomy (PI C. P. Haines) reaching the depth of (m⋆+7.9 at the supercluster redshift) allows to study the galaxy population down to the magnitude limit of the optical catalogue. The survey started in April 2014.
- -
-
The spectroscopic survey with AAOmega at the Anglo-Australian Telescope (PI P. Merluzzi) collected 4037 new redshifts across 21 deg2 of ShaSS. Together with the already available redshifts the spectroscopic sample is now 80% complete down to (m⋆+3 at the supercluster redshift).
- -
-
The above dedicated surveys are complemented by near/mid-infrared data from the Wide-field Infrared Survey Explorer (WISE) in four bands (W1-W4) 3.4, 4.6, 12 and 22 m. Over the ShaSS area, we reach W1=16.96 (Vega magnitude) and W3=11.12 mag (1.0 mJy) at SNR=10 corresponding to m⋆+5 and SFR of 0.46 M⊙yr-1, respectively, for galaxies in the supercluster.
For the central 2-3 deg2, XMM-Newton, Spitzer/MIPS 24m and 70m, GALEX near-ultraviolet and far-ultraviolet data are also available, as well as targeted observations of single galaxies providing H imaging with the Maryland-Magellan Tunable Filter on the Magellan-Baade 6.5m telescope at the Las Campanas Observatory in Chile and integral-field spectroscopy with WiFeS on the Australian National University 2.3m telescope at Siding Spring in Australia.
In this first article we derived the stellar mass density distribution based on supercluster members weighted by the W1 flux. This first quantitative characterization of the environment for the whole region covered by ShaSS shows a clumpy structure both in the SSCC and the surrounding clusters with several substructures, most of them already identified in previous works. All the clusters in the ShaSS area are embedded in a common network. This was suggested, but only for the SSCC where supercluster galaxies continuously populate the core following the gas filaments connecting the Abell clusters as mapped by X-ray observations (Kull & Böhringer, 1999). We estimate the mean overdensity across the SSCC being with respect to the cosmic total stellar mass density for galaxies in the local Universe ().
Some new substructures with respect to previous works have been identified in the ShaSS density map such as those associated with A 3560 N from the cluster centre in the direction of A 3558, towards which also the X-ray emission is elongated (Venturi et al., 2013). The most important new feature is however the filament connecting the SSCC and the cluster A 3559 as well as the less pronounced overdensity extending from the SSCC towards A 3560.
The other environment indicator analyzed here is the dark matter distribution derived from the weak-lensing analysis of VST imaging. Using this approach, we studied the central 1 deg2 field including A 3558 and SC 1327-312. The derived WL map shows that the dark matter is concentrated in two peaks which correspond to the rich cluster and the group, although the centres seem slightly offset with respect to the X-ray emission and the galaxy density. This can be due to the lower resolution of the WL map and/or ascribed to the complex dynamical state of the SSCC. The estimated mass of A 3558 is , consistent with the X-ray estimate of MM⊙. We notice that the WL mass determination will be improved extending the analysis to a larger region of the supercluster as planned in the ShaSS project.
We conclude pointing out that the VST imaging is the first CCD photometry covering homogeneously and continuously such a large portion of the Shapley supercluster, with this depth and resolution (corresponding to 0.75 kpc at the supercluster redshift). Taking advantage of the -band and WISE W1 photometry, the AAOmega survey has been designed and carried out to obtain a magnitude-limited redshift sample, which was never achieved before (e.g. Quintana et al., 2000; Drinkwater et al., 2004; Proust et al., 2006). With these characteristics, ShaSS will build up the first multi-band homogeneous data-set of a vast region of the Shapley supercluster and provide a fundamental local counterpart to the supercluster surveys at higher redshifts.
Acknowledgments
This work was conceived in the framework of the collaboration of the FP7-PEOPLE-IRSES-2008 project ACCESS. Based on data collected with i) the ESO - VLT Survey Telescope with OmegaCAM (ESO Programmes 088.A-4008, 089.A-0095, 090.A-0094, 091.A-0050) and the ESO - Visible and Infrared Survey Telescope for Astronomy with VIRCAM (ESO Programme 093A-0465) at the European Southern Observatory, Chile and ii) Anglo-Australian Telescope and 2dF+AAOmega at the Australian Astronomical Observatory, Australia (OPTICON proposal 2013A/014). The optical imaging is collected at the VLT Survey Telescope using the Italian INAF Guaranteed Time Observations. The research leading to these results has received funding from the European Community’s Seventh Framework Programme (FP7/2007-13) under grant agreement number 312430 (OPTICON; PI: P. Merluzzi) and PRIN-INAF 2011 ‘Galaxy evolution with the VLT Surveys Telescope (VST)’ (PI A. Grado). CPH was funded by CONICYT Anillo project ACT-1122. N.Okabe is supported by a Grant-in-Aid from the Ministry of Education, Culture, Sports, Science, and Technology of Japan (26800097) and by World Premier International Research Center Initiative (WPI Initiative), MEXT, Japan. PM and GB would like to thank A. M. Hopkins for his support during the spectroscopic observations at the Australian Astronomical Observatory and the Universidad de Chile for the hospitality and support during their staying. PM thanks M. Petr-Gotzens for her support in the VST observations. The authors thank Prof. L. Campusano for his helpful comments to the manuscript. This publication makes use of data products from the Wide-field Infrared Survey Explorer, which is a joint project of the University of California, Los Angeles, and the Jet Propulsion Laboratory/California Institute of Technology, funded by the National Aeronautics and Space Administration. The author thank the anonymous referee for her/his constructive comments and suggestions.
References
- Abell et al. (1989) Abell G. O., Corwin H. G. J., Olowin R. P., 1989, ApJS, 70, 1
- Abraham et al. (2003) Abraham R. G., van den Bergh S., Nair P., 2003, ApJ, 588, 218
- Akimoto et al. (2003) Akimoto F., Kondou K., Furuzawa A., Tawara Y., Yamashita K., 2003, ApJ, 596, 170
- Annunziatella et al. (2013) Annunziatella M., Mercurio A., Brescia M., Cavuoti S., Longo G., 2013, PASP, 125, 68
- Arnaud et al. (2010) Arnaud M., Pratt G. W., Piffaretti R., Böhringer H., Croston J. H., Pointecouteau E., 2010, A&A, 517, A92
- Ashman et al. (1994) Ashman K. M., Bird C. M., Zepf S. E., 1994, AJ, 108, 2348
- Bahé et al. (2013) Bahé Y. M., McCarthy I. G., Balogh M. L., Font A. S., 2013, MNRAS, 430, 3017
- Baldry et al. (2006) Baldry I. K., Balogh M. L., Bower R. G., Glazebrook K., Nicol R. C., Bamford S. P., T. B., 2006, MNRAS, 373, 469
- Baldry et al. (2012) Baldry I. K., Driver S. P., Loveday J., Taylor E. N., Kelvin L. S., et al. 2012, MNRAS, 421, 621
- Balogh et al. (2004) Balogh M. L., Eke V., Miller C., Lewis I., Bower R., et al. 2004, MNRAS, 348, 1355
- Barazza et al. (2009) Barazza F. D., Wolf C., Gray M. E., Jogee S., Balogh M., et al. 2009, A&A, 508, 665
- Bardelli et al. (1998) Bardelli S., Pisani A., Ramella M., Zucca E., Zamorani G., 1998
- Bardelli et al. (2002) Bardelli S., Venturi T., Zucca E., De Grandi S., Ettori S., Molendi S., 2002, A&A, 396, 65
- Bardelli et al. (1996) Bardelli S., Zucca E., Malizia A., Zamorani G., Scaramella R., Vettolani G., 1996, A&A, 305, 435
- Bardelli et al. (1994) Bardelli S., Zucca E., Vettolani G., Zamorani G., Scaramella R., Collin C. A., MacGillivray H. T., 1994, MNRAS, 267, 665
- Bardelli et al. (2000) Bardelli S., Zucca E., Zamorani G., Moscardini L., Scaramella R., 2000, MNRAS, 312, 540
- Bardelli et al. (1998) Bardelli S., Zucca E., Zamorani G., Vettolani G., Scaramella R., 1998
- Barnes & Hernquist (1991) Barnes J. E., Hernquist L. E., 1991, ApJ, 370, 65L
- Bekki (1999) Bekki K., 1999, ApJ, 510, L15
- Bekki (2001) Bekki K., 2001, ApJ, 546, 189
- Bekki et al. (2010) Bekki K., Owers M. S., Couch W. J., 2010, ApJ, 718, 27L
- Berrier et al. (2009) Berrier J. C., Stewart K. R., Bullock J. S., Purcell C. W., Barton E. J., Wechsler R. H., 2009, ApJ, 690, 1292
- Bershady et al. (2000) Bershady M. A., Jangren A., Conselice C. J., 2000, AJ, 119, 2645
- Bertin (2006) Bertin E., 2006, ASPC, 351, 112
- Bertin & Arnouts (1996) Bertin E., Arnouts S., 1996, A&AS, 117, 393
- Bertin et al. (2002) Bertin E., Y. M., M. R., G. M., P. D., B. M., 2002, ASPC, 281, 228
- Bhattacharya et al. (2013) Bhattacharya S., Habib S., Heitmann K., Vikhlinin A., 2013, ApJ, 766, 32
- Blanton et al. (2005) Blanton M. R., Eisenstein D., Hogg D. W., Schlegel D. J., Brinkmann J., 2005, ApJ, 629, 143
- Blanton & Roweis (2007) Blanton M. R., Roweis S., 2007, AJ, 133, 734
- Bösch et al. (2013) Bösch B., Böhm A., Wolf C., Aragón-Salamanca A., Barden M., Gray M. E., Ziegler B. L., Schindler S., Balogh M., 2013, A&A, 549, 142
- Boselli & Gavazzi (2006) Boselli A., Gavazzi G., 2006, PASP, 118, 517
- Bourdin & Mazzotta (2008) Bourdin H., Mazzotta P., 2008, A&A, 479, 307
- Boylan-Kolchin et al. (2009) Boylan-Kolchin M., Springel V., White S. D. M., Jenkins A., Lemson G., 2009, MNRAS, 398, 1150
- Breen et al. (1994) Breen J., Raychaudhury S., Forman W., Jones 1994, ApJ, 424, 59
- Bruzual & Charlot (2003) Bruzual G., Charlot S., 2003, MNRAS, 344, 1000
- Butcher & Oemler (1984) Butcher H., Oemler Jr. A., 1984, ApJ, 285, 426
- Byrd & Valtonen (1990) Byrd G., Valtonen M., 1990, ApJ, 350, 89
- Cannon et al. (2006) Cannon R., Drinkwater M., Edge A., Eisenstein D., Nichol R., Outram P., Pimbblet K., et al. 2006, MNRAS, 372, 425
- Catinella et al. (2013) Catinella B., Schiminovich D., Cortese L., Fabello S., Hummels C. B., Moran S. M., Lemonias J. J., Cooper A. P., Wu R., Heckman T. M., Wang J., 2013, MNRAS, 436, 34
- Christlein & Zabludoff (2004) Christlein D., Zabludoff A. I., 2004, ApJ, 616, 192
- Christodoulou et al. (2012) Christodoulou L., Eminian C., Loveday J., Norberg P., Baldry I. K., Hurley P. D., Driver S. P., Bamford S. P., Hopkins A. M., et al. 2012, MNRAS, 425, 1527
- Chung et al. (2009) Chung A., van Gorkom J. H., Kenney J. D. P., Crowl H., Vollmer B., 2009, AJ, 138, 1741
- Chung et al. (2011) Chung S. M., Eisenhardt P. R., Gonzalez A. H., Stanford S. A., Brodwin M., Stern D., Jarrett T., 2011, ApJ, 743, 34
- Colless et al. (2001) Colless M., Dalton G., Maddox S., Sutherland W., Norberg P., Cole S., et al. 2001, MNRAS, 328, 1039
- Conselice (2003) Conselice C. J., 2003, ApJS, 147, 1
- Conselice et al. (2000) Conselice C. J., Bershady M. A., Jangren A., 2000, ApJ, 529, 886
- Cowie & Songalia (1977) Cowie L. L., Songalia A., 1977, Nature, 266, 501
- Crowl & Kenney (2008) Crowl H. H., Kenney J. D. P., 2008, AJ, 136, 1623
- David et al. (1999) David L. P., Forman W., C. J., 1999, AJ, 519, 533
- De Filippis et al. (2005) De Filippis E., Schindler S., T. E., 2005, A&A, 444, 387
- Donoso et al. (2012) Donoso E., Yan L., Tsai C., Eisenhardt P., Stern D., Assef R. J., Leisawitz D., Jarrett T. H., Stanford S. A., 2012, ApJ, 748, 80
- Dopita et al. (2007) Dopita M., Hart J., McGregor P., Oates P., Bloxham G., Jones D., 2007, ApSS, 310, 255
- Dressler (1980) Dressler A., 1980, ApJ, 236, 351
- Dressler & Shectman (1988) Dressler A., Shectman S. A., 1988, AJ, 95, 985
- Dressler et al. (1985) Dressler A., Thompson I. B., Shectman S. A., 1985, ApJ, 288, 481
- Drinkwater et al. (2010) Drinkwater M. J., Jurek R. J., Blake C., Woods D., Pimbblet K. A., et al. 2010, MNRAS, 401, 1429
- Drinkwater et al. (2004) Drinkwater M. J., Parker Q., Proust D., Slezak E., Quintana H., 2004, PASA, 21, 89
- Driver et al. (2011) Driver S. P., Hill D. T., Kelvin L. S., Robotham A. S. G., Liske J., Norberg P., et al. 2011, MNRAS, 413, 971
- Ettori et al. (2000) Ettori S., Bardelli S., De Grandi S., Molendi S., Zamorani G., Zucca E., 2000, MNRAS, 318, 239
- Ettori et al. (1997) Ettori S., Fabian A. C., A. W. A., 1997, MNRAS, 289, 787
- Fabian (1991) Fabian A. C., 1991, MNRAS, 253, 19L
- Fadda et al. (2008) Fadda D., Biviano A., Marleau F. R., Storrie-Lombardi L. J., Durret F., 2008, ApJ, 672, L9
- Fadda et al. (1996) Fadda D., Girardi M., Giuricin G., Mardirossian F., Mezzetti M., 1996, ApJ, 473, 670
- Feindt et al. (2013) Feindt U., Kerschhaggl M., Kowalski M., Aldering G., Antilogus P., Aragon C., et al. 2013, A&A, 560, A90
- Finoguenov et al. (2004) Finoguenov A., Henriksen M. J., Briel U. G., de Plaa J., Kaastra J. S., 2004, ApJ, 611, 811
- Fukugita et al. (1995) Fukugita M., Shimasaku K., Ichikawa T., 1995, PASP, 107, 945
- Gao et al. (2012) Gao L., Navarro J. F., Frenk C. S., Jenkins A., Springel V., White S. D. M., 2012, MNRAS, 425, 2169
- Garilli et al. (1999) Garilli B., Maccagni D., Andreon S., 1999, A&A, 342, 408
- Giacintucci et al. (2005) Giacintucci S., Venturi T., Brunetti S., Bardelli S., Dallacasa D., Ettori S., Finoguenov A., Rao A. P., Zucca E., 2005, A&A, 440, 867
- Girardi et al. (1996) Girardi M., Fadda D., Giuricin G., Mardirossian F., Mezzetti M., Biviano A., 1996, ApJ, 457, 61
- Goto et al. (2003) Goto T., Yamauchi C., Fujita Y., Okamura S., Sekiguchi M., Smail I., Brnardi M., Gomez P. L., 2003, MNRAS, 346, 601
- Grado et al. (2012) Grado A., Capaccioli M., Limatola L., Getman F., 2012, Mem. SAIt, 19, 362
- Gray et al. (2009) Gray M. E., Wolf C., Barden M., Peng C. Y., et al. 2009, MNRAS, 393, 1275
- Gunn & Gott (1972) Gunn J. E., Gott J. R. I., 1972, ApJ, 176, 1
- Haines et al. (2011a) Haines C. P., Busarello G., Merluzzi P., Smith R. J., Raychaudhury S., Mercurio A., Smith G. P., 2011a, MNRAS, 412, 127
- Haines et al. (2011b) Haines C. P., Busarello G., Merluzzi P., Smith R. J., Raychaudhury S., Mercurio A., Smith G. P., 2011b, MNRAS, 412, 145
- Haines et al. (2007) Haines C. P., Gargiulo A., La Barbera F., Mercurio A., Merluzzi P., Busarello G., 2007, MNRAS, 381, 7
- Haines et al. (2006) Haines C. P., La Barbera F., Mercurio A., Merluzzi P., Busarello G., 2006, ApJ, 647, 21L
- Haines et al. (2011) Haines C. P., Merluzzi P., Busarello G., Dopita M. A., Smith G. P., La Barbera F., Gargiulo A., Raychaudhury S., Smith R. J., 2011
- Haines et al. (2006) Haines C. P., Merluzzi P., Mercurio A., Gargiulo A., Krusanova N., Busarello G., La Barbera F., Capaccioli M., 2006, MNRAS, 371, 55
- Haines et al. (2012) Haines C. P., Pereira M. J., Sanderson A. J. R., Smith G. P., Egami E., Babul A., Edge A. C., Finoguenov A., Moran S. M., Okabe N., 2012, ApJ, 754, 97
- Haines et al. (2013) Haines C. P., Pereira M. J. J., Smith G. P. E. E., Sanderson A. J. R., Babul A., Finoguenov A., Merluzzi P., Busarello G., Rawle T. D., Okabe N., 2013, ApJ, 775, 126
- Haines et al. (2009) Haines C. P., Smith G. P., Egami E., Ellis R. S., Moran S. M., Sanderson A. J. R., Merluzzi P., Busarello G., Smith R. J., 2009, ApJ, 704, 126
- Haines et al. (2009) Haines C. P., Smith G. P., Egami E., Okabe N., Takada M., Ellis R. S., Moran S. M., Umetsu K., 2009, MNRAS, 396, 1297
- Hanami et al. (1999) Hanami H., Tsuru T., Shimasaku K., Yamauchi S., Ikebe Y., Koyama K., 1999, ApJ, 521, 90
- Häussler et al. (2007) Häussler B., McIntosh D. H., Barden M., Bell E. F., Rix H.-W., Borch A., Beckwith S. V. W., Caldwell J. A. R., Heymans C., Jahnke K., Jogee S., Koposov S. E., Meisenheimer K., Sánchez S. F., Somerville R. S., Wisotzki L., Wolf C., 2007, ApJS, 172, 615
- Holwerda et al. (2014) Holwerda B. W., Muñoz-Mateos J.-C., Comerón S., Meidt S., Sheth K., Laine S., et al. 2014, ApJ, 781, 12
- Irwin et al. (2004) Irwin M. J., Lewis J., Hodgkin S., Bunclark P., Evans D., McMahon R., Emerson J. P., Stewart M., Beard S., 2004, in Quinn P. J., Bridger A., eds, Optimizing Scientific Return for Astronomy through Information Technologies Vol. 5493 of Society of Photo-Optical Instrumentation Engineers (SPIE) Conference Series, VISTA data flow system: pipeline processing for WFCAM and VISTA. pp 411–422
- Jarrett et al. (2013) Jarrett T. H., Masci F., Tsai C. W., Petty S., Cluver M. E., Assef R. J., et al. 2013, AJ, 145, 6
- Johnston-Hollit et al. (2008) Johnston-Hollit M., Sato M., Gill J. A., Fleenor M. C., Brick A.-M., 2008, MNRAS, 390, 289
- Kaiser & Squires (1993) Kaiser N., Squires G., 1993, ApJ, 404, 441
- Kaiser et al. (1995) Kaiser N., Squires G., Broadhurst T., 1995, ApJ, 449, 460
- Kapferer et al. (2009) Kapferer W., Sluka C., Schindler S., Ferrari C., Ziegler B., 2009, A&A, 499, 87
- Kent (1985) Kent S. M., 1985, ApJS, 59, 115
- Kleiner et al. (2014) Kleiner D., Pimbblet K. A., Owers M. S., Jones D. H., Stephenson A. P., 2014, MNRAS, 439, 2755
- Kocevski et al. (2004) Kocevski D. D., Mullis C. R., Ebeling H., 2004, ApJ, 608, 721
- Kravtsov et al. (2006) Kravtsov A. V., Vikhlinin A., Nagai D., 2006, ApJ, 650, 128
- Kronberger et al. (2008) Kronberger T., Kapferer W., Unterguggenberger S., Schindler S., Ziegler B. L., 2008, A&A, 483, 783
- Kull & Böhringer (1999) Kull A., Böhringer H., 1999, A&A, 341, 23
- Larson et al. (1980) Larson R. B., Tinsley B. M., Caldwell C. M., 1980, ApJ, 237, 692
- Le Floc’h et al. (2005) Le Floc’h E., Papovich C., Dole H., Bell E. F., Lagache G., Rieke G. H., et al. 2005, ApJ, 632, 169
- Lewis et al. (2002) Lewis I., Balogh M., De Propris R., Couch W., Bower R., et al. 2002, MNRAS, 334, 673
- Lietzen et al. (2012) Lietzen H., Tempel E., Heinämäki P., Nurmi P., Einasto M., Saar E., 2012, A&A, 545, A104
- Lotz et al. (2011) Lotz J. M., Jonsson P., Cox T. J., Croton D., Primack J. R., Somerville R. S., Stewart K., 2011, ApJ, 742, 103
- Lotz et al. (2008) Lotz J. M., Jonsson P., Cox T. J., Primack J. R., 2008, MNRAS, 391, 1137
- Lotz et al. (2004) Lotz J. M., Primack J., Madau P., 2004, AJ, 128, 163
- Lubin et al. (2009) Lubin L. M., Gal R. R., Lemaux B. C., Kocevski D. D., Squires G. K., 2009, AJ, 137, 4867
- Luparello et al. (2013) Luparello H. E., Lares M., Yaryura C. Y., Paz D., Padilla N., Lambas D. G., 2013, MNRAS, 432, 1367
- Mahajan et al. (2011) Mahajan S., Haines C. P., Raychaudhury S., 2011, MNRAS, 412, 1098
- Marcolini et al. (2003) Marcolini A., Brighenti F., D’Ercole A., 2003, MNRAS, 345, 1329
- Martig et al. (2009) Martig M., Bournard F., Teyssier R., Dekel A., 2009, ApJ, 707, 250
- Martig & Bournaud (2008) Martig M., Bournaud F., 2008, MNRAS, 385, L38
- Mauduit & Mamon (2007) Mauduit J. C., Mamon G. A. P., 2007, A&A, 475, 169
- McGaugh & Schombert (2014) McGaugh S., Schombert J., 2014, arXiv:1407.1839
- McGee et al. (2009) McGee S. L., Balogh M. L., Bower R. G., Font A. S., McCarthy I. G., 2009, MNRAS, 400, 937
- Mei et al. (2012) Mei S., Stanford S. A., Holden B. P., Raichoor A., Postman M., Nakata F., Finoguenov A., et al. 2012, ApJ, 754, 141
- Meidt et al. (2014) Meidt S. E., Schinnerer E., van de Ven G., Zaritsky D., Peletier R., et al. 2014, ApJ, 788, 144
- Melnick & Moles (1987) Melnick J., Moles M., 1987, RMxAA, 14, 72
- Mercurio et al. (2006) Mercurio A., Merluzzi P., Haines C. P., Gargiulo A., Krusanova N., Busarello G., La Barbera F., Capaccioli M., Covone G., 2006, MNRAS, 368, 109
- Merluzzi et al. (2013) Merluzzi P., Busarello G., Dopita M. A., Haines C. P., Steinhauser D., Mercurio A., Rifatto A., Smith R. J., Shindler S., 2013, MNRAS, 429, 174
- Merluzzi et al. (2010) Merluzzi P., Mercurio A., Haines C. P., Smith R. J., Busarello G., Lucey J. R., 2010, MNRAS, 402, 753
- Metcalfe et al. (1994) Metcalfe N., Godwin J. G., Peach J. V., 1994, MNRAS, 267, 431
- Miller (2005) Miller N. A., 2005, AJ, 130, 2541
- Moore et al. (1996) Moore B., Katz N., Lake G., Dressler A., Oemler A., 1996, Nature, 379, 613
- Moran et al. (2005) Moran S. M., Ellis R. S., Treu T., Smail I., DRessler A., Coil A. L., Smith G. P., 2005, ApJ, 634, 977
- Moran et al. (2007) Moran S. M., Miller N., Treu T., Ellis R. S., Smith G. P., 2007, ApJ, 659, 1138
- Moss (2006) Moss C., 2006, MNRAS, 373, 167
- Muñoz & Loeb (2008) Muñoz J. A., Loeb A., 2008, MNRAS, 391, 1341
- Muñoz-Mateos et al. (2009) Muñoz-Mateos J. C., Gil de Paz A., Zamorano J., Boissier S., Dale D. A., Pérez-González P. G., Gallego J., Madore B. F., Bendo G., Boselli A., Buat V., Calzetti D., Moustakas J., Kennicutt Jr. R. C., 2009, ApJ, 703, 1569
- Navarro et al. (1996) Navarro J. F., Frenk C. S., White S. D. M., 1996, ApJ, 462, 563
- Navarro et al. (1997) Navarro J. F., Frenk C. S., White S. D. M., 1997, ApJ, 490, 493
- Nulsen (1982) Nulsen P. E. J., 1982, MNRAS, 192, 1007
- Okabe et al. (2011) Okabe N., Bourdin H., Mazzotta P., Maurogordato S., 2011, ApJ, 741, 116
- Okabe et al. (2014) Okabe N., Futamase T., Kajisawa M., Kuroshima R., 2014, ApJ, 784, 90
- Okabe et al. (2013) Okabe N., Smith G. P., Umetsu K., Takada M., Futamase T., 2013, ApJ, 769, L35
- Okabe & Umetsu (2008) Okabe N., Umetsu K., 2008, PASJ, 60, 345
- Owen et al. (2005) Owen F. N., Ledlow M. J., Keel W. C., Wang Q. D., Morrison G. E., 2005, AJ, 129, 31
- Owers et al. (2012) Owers M. S., Couch W. J., Nulsen P. E. J., Randall S. W., 2012, ApJ, 750, L23
- Pandey & Bharadwaj (2006) Pandey B., Bharadwaj S., 2006, MNRAS, 372, 827
- Pearson & Batuski (2013) Pearson D. W., Batuski D. J., 2013, MNRAS, 436, 796
- Pimbblet et al. (2006) Pimbblet K. A., Smail I., Edge A. C., O’Hely E., Couch W. J., Zabludoff A. I., 2006, MNRAS, 366, 645
- Planck Collaboration et al. (2013) Planck Collaboration Ade P. A. R., Aghanim N., Armitage-Caplan C., Arnaud M., Ashdown M., Atrio-Barandela F., Aumont J., Aussel H., Baccigalupi C., et al. 2013, arXiv:1303.5089
- Plionis & Valdarnini (1991) Plionis M., Valdarnini R., 1991, MNRAS, 249, 46
- Popesso et al. (2012) Popesso P., Biviano A., Rodighiero G., Baronchelli I., Salvato M., Saintonge A., et al. 2012, A&A, 537, A58
- Porter et al. (2008) Porter S. C., Raychaudhury S., Pimbblet K. A., Drinkwater M. J., 2008, MNRAS, 388, 1152
- Pozzetti et al. (2010) Pozzetti L., Bolzonella M., Zucca E., Zamorani G., Lilly S., et al. 2010, A&A, 523, 13
- Proust et al. (2006) Proust D., Quintana H., Carrasco E. R., Reisenegger A., Slezak E., Muriel H., Dünner R., Sodré L. J., Drinkwater M. J., Parker Q., Ragone C. J., 2006, A&A, 447, 133
- Quintana et al. (2000) Quintana H., Carrasco E. R., Reisenegger A., 2000, AJ, 120, 511
- Quintana et al. (1997) Quintana H., Melnick J., Proust D., Infante L., 1997, A&ASS, 125, 247
- Quintana et al. (1995) Quintana H., Ramirez A., Melnick J., Raychaudhury S., Slezak E., 1995, AJ, 110, 463
- Radovich et al. (2004) Radovich M., Arnaboldi M., Ripepi V., Massarotti M., McCracken H. J., et al. 2004, A&A, 417, 51
- Ragone et al. (2006) Ragone C. J., Muriel H., Proust D., Reisenegger A., Quintana H., 2006, A&A, 445, 819
- Rasmussen et al. (2012) Rasmussen J., Mulchaey J. S., Bai L., Ponman T. J., Raychaudhury S., Dariush A., 2012, ApJ, 757, 122
- Raychaudhury (1989) Raychaudhury S., 1989, Nature, 342, 251
- Raychaudhury et al. (1991) Raychaudhury S., Fabian A. C., Edge A. C., Jones C., Forman W., 1991, MNRAS, 248, 101
- Reisenegger et al. (2000) Reisenegger A., Quintana H., Carrasco E. R., Maze J., 2000, AJ, 120, 523
- Roediger & Hensler (2005) Roediger E., Hensler G., 2005, A&A, 433, 875
- Rossetti et al. (2005) Rossetti M., Ghizzardi S., Molendi S., Finoguenov A., 2005, A&A, 463, 839
- Salim et al. (2007) Salim S., Rich R. M., Charlot S., Brinchmann J., Johnson B. D., Schiminovich D., et al. 2007, ApJS, 173, 267
- Scaramella et al. (1989) Scaramella R., Baiesi-Pillastrini G., Chincarini G., Vettolani G., 1989, Nature, 338, 562
- Scarlata et al. (2007) Scarlata C., Carollo C. M., Lilly S., Sargent M. T., Feldmann R., Kampczyk P., et al. 2007, ApJS, 172, 406
- Schipani et al. (2012) Schipani P., Capaccioli M., Arcidiacono C., Argomedo J., Dall’Ora M., D’Orsi S., Farinato J., Magrin D., Marty L., Ragazzoni R., Umbriaco G., 2012, SPIE, 8444, 1
- Shapley (1930) Shapley H., 1930, Harward Coll. Obs. Bull., 874, 9
- Sheth & Diaferio (2011) Sheth R. K., Diaferio A., 2011, MNRAS, 412, 2938
- Smith et al. (2009) Smith R. J., Lucey J. R., Hudson M. J., Allanson S. P., Bridges T., Hornschemeier A. E., Marzke R. O., Miller N. A., 2009, MNRAS, 392, 1265
- Toomre & Toomre (1972) Toomre A., Toomre J., 1972, ApJ, 178, 623
- van Dokkum (2005) van Dokkum P. G., 2005, ApJ, 130, 2747
- Veilleux et al. (2010) Veilleux S., Weiner B. J., Rupke D. S. N., McDonald M., Birk C., Bland-Hawthorn J., Dressler A., Hare T., Osip D., Pietraszewski C., Vogel S. N., 2010, AJ, 139, 145
- Venturi et al. (2003) Venturi T., Bardelli S., Dallacasa D., Brunetti S., Giacintucci S., Humstead R. W., Morganti R., 2003, A&A, 402, 913
- Venturi et al. (2000) Venturi T., Bardelli S., Morganti R., Humstead R. W. a., 2000, MNRAS, 314, 594
- Venturi et al. (2013) Venturi T., Rossetti M., Bardelli S., Giacintucci S., Dallacasa D., Cornacchia M., Kantharia N. G., 2013, A&A, 558, A146
- Weinmann et al. (2006) Weinmann S. M., van den Bosch F. C., Yang X., Mo H. J., 2006, MNRAS, 366, 2
- Wetzel et al. (2012) Wetzel A. R., Tinker J. L., Conroy C., 2012, MNRAS, 424, 232
- Wilman et al. (2009) Wilman D. J., Oemler A. J., Mulchaey J. S., McGee S. L., Balogh M. L., Bower R. G., 2009, ApJ, 692, 298
- Woo et al. (2013) Woo J., Dekel A., Faber S. M., Noeske K., Koo D. C., Gerke B. F., Cooper M. C., Salim S., Dutton A. A., Newman J., Weiner B. J., Bundy K., Willmer C. N. A., Davis M., Yan R., 2013, MNRAS, 428, 3306
- Wright et al. (2010) Wright E. L., Eisenhardt P. R. M., Mainzer A. K., Ressler M. E., Cutri R. M., et al., 2010, AJ, 140, 1868
- Yaryura et al. (2011) Yaryura C. Y., Baugh C. M., Angulo R. E., 2011, MNRAS, 413, 1311
- Ziparo et al. (2014) Ziparo F., Popesso P., Finoguenov A., Biviano A., Wuyts S., et al. 2014, MNRAS, 437, 458
- Zucca et al. (1993) Zucca E., Zamorani G., Scaramella R., Vettolani G., 1993, ApJ, 407, 470