Gas physical conditions and kinematics of the giant outflow Ou4 ††thanks: Based on observations, obtained under Director’s Discretionary Time of the Spanish Instituto de Astrofí sica de Canarias, with the 2.5m INT and the 4.2m WHT telescopes operated on the island of La Palma by the Isaac Newton Group of Telescopes in the Spanish Observatorio of the Roque de Los Muchachos.
Abstract
Context. Ou4 is a recently discovered bipolar outflow with a projected size of more than one degree in the plane of the sky. It is apparently centred on the young stellar cluster – whose most massive representative is the triple system HR 8119 – inside the H ii region Sh 2-129. The driving source, the nature, and the distance of Ou4 are not known.
Aims. The basic properties of Ou4 and its environment are investigated in order to shed light on the origin of this remarkable outflow.
Methods. Deep narrow-band imagery of the whole nebula at arcsecond resolution was obtained to study its detailed morphology. Long-slit spectroscopy of the tips of the bipolar lobes was secured to determine the gas ionization mechanism, physical conditions, and line-of-sight velocities. An estimate of the proper motions at the tip of the south lobe using archival plate images is attempted. The existing multi-wavelength data for Sh 2-129 and HR 8119 are also comprehensively reviewed.
Results. The observed morphology of Ou4, its emission-line spatial distribution, line flux ratios, and the kinematic modelling developed adopting a bow-shock parabolic geometry, illustrate the expansion of a shock-excited fast collimated outflow. The observed radial velocities of Ou4 and its reddening are consistent with those of Sh 2-129 and HR 8119. The improved determination of the distance to HR 8119 (composed of two B0 V and one B0.5 V stars) and Sh 2-129 is 712 pc. We identify in WISE images a -radius (1 pc at the distance above) bubble of emission at 22 m emitted by hot (107 K) dust grains, located inside the central part of Ou4 and corresponding to several [O iii] emission features of Ou4.
Conclusions. The apparent position of Ou4 and the properties studied in this work are consistent with the hypothesis that Ou4 is located inside the Sh 2-129 H ii region, suggesting that it was launched some 90,000 yrs ago by HR 8119. The outflow total kinetic energy is estimated to be ergs. However, the alternate possibility that Ou4 is a bipolar planetary nebula, or the result of an eruptive event on a massive AGB or post–AGB star not yet identified, cannot be ruled out.
Key Words.:
ISM: individual objects: Ou4 – ISM: jets and outflows – (ISM:) HII regions – (ISM:) planetary nebulae: general Stars: winds, outflows – Stars: early-type1 Introduction
The remarkable nebula Ou4 was discovered by the French amateur astronomer Nicolas Outters while imaging the Sh 2-129 nebula in June 2011 by means of a 12.5 hour CCD exposure with a F/5 106mm-diameter refractor (resulting in a plate scale of pix-1) and a narrow (30 Å FWHM) [O iii] filter. It is a clear example of the relevant science that can be done with very small telescopes: the long integrations that can be obtained by dedicated amateur astronomers allow very faint detection levels to be reached, which are sometimes difficult to achieve with professional telescopes given the limited amount of time available111Note that the detection limit per resolution element of an extended, uniform source does not depend on the telescope size, but only on its focal ratio..
Ou4 was introduced and discussed by Acker et al. (2012). Its highly bipolar morphology is mainly visible in the [O iii] 5007 Å light. The total length of the nebula is on the sky. The driving source, the nature, and the distance of Ou4 are not known. Acker et al. (2012) discussed several possibilities, including the one that Ou4 is a very nearby planetary nebula (PN).
Motivated by the impressive size and remarkable morphology of Ou4, we have obtained new optical images and spectra with the aim to shed light on its origin. In Sect. 2, we describe the relative position in the sky of Ou4 and the H ii region Sh 2-129, and discuss the distance to the latter. Our imaging and spectroscopic observations are presented in Sect. 3. We analyse these results in Sect. 4, and discuss the nature of Ou4 in Sect. 5.
2 Ou4 and the Sh 2-129 nebula
2.1 Multi-wavelength view of the Sh 2-129 nebula
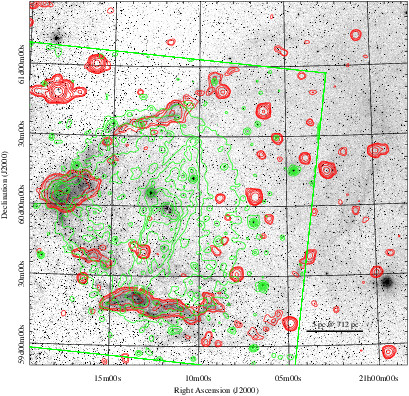
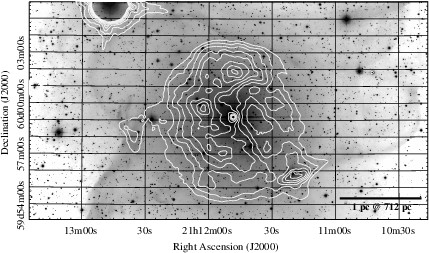
A multi-wavelength view of the Sh 2-129 H ii region is presented in Fig. 1. The -band DDS2 image mainly shows the H line emission. This defines the boundary of this ionised region, which consists of a bright semicircle on the east side and a fainter elongated bubble protruding towards the north-west direction. This morphology is typical of an evolved H ii region in the Champagne phase (Tenorio-Tagle 1979): the ionising flux of a hot young star originally embedded near the edge of a molecular cloud produced an expanding spherical H ii region which pierced the cloud surface producing a flow of ionised gas (e.g., Yorke et al. 1983).
The Green Bank 6 cm survey (Condon et al. 1994; red contour map in Fig. 1) shows the free-free continuum emission from the border of this blister H ii region. In a large field-of-view [O iii] image of Sh 2-129222The original image was obtained by another French amateur astronomer, Stéphane Zoll, on August 2012 by means of a 7.3 hour CCD-exposure with a F/3.6 106mm-diameter refractor (plate scale of pix-1) and a narrow (50 Å FWHM) [O iii] filter, and posted on www.astrosurf.com . We used Aladin (Bonnarel et al. 2000) to register it to the DSS2 image. (green contour map) the [O iii] emission of Ou4 appears as superposed and centred on the fainter emission from the hot gas that fills the semi-spherical H ii region of Sh 2-129 and cools within the Champagne flow.
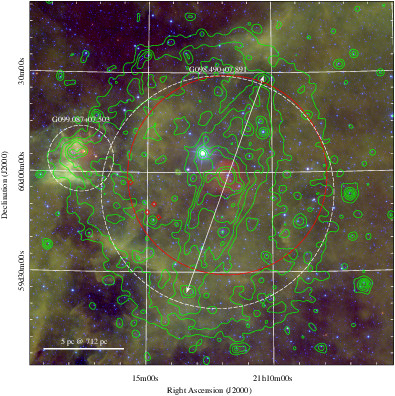
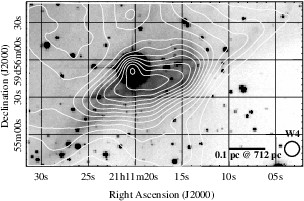
Infrared images obtained with the Wide-field Infrared Survey Explorer (WISE; Wright et al. 2010) unveil the dust emission in this area (Fig. 2). Bright dust pillars are present at the eastern border of the bubble, but they are associated to a smaller H ii region according to Anderson et al. (2014). This small H ii region and dust pillars are typical of star-forming region. This star-forming region may have been triggered by the expansion of Sh 2-129. In the central part of Sh 2-129 a -radius bubble of emission at 22 m shows up. Such an emission is usually observed inside H ii regions where the central hot star heats dust grains (e.g., Deharveng et al. 2010); for instance, the dust pillars of the smaller H ii region are also surrounded by 22-m emission. The morphology of the Sh 2-129 mid-infrared bubble and its relation with Ou4 will be discussed in Sect. 4.5.
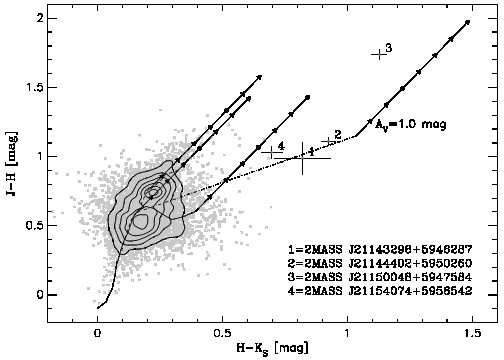
We used 2MASS (Skrutskie et al. 2006) to identify young star candidates in the central part of Sh 2-129, in a radius of from HR 8119. We selected only sources with good photometry (AAA flag) to build a colour-colour near-infrared diagram in the 2MASS photometric system (Fig. 3). The comparison with the locus of classical T Tauri stars (CTTSs) in this diagram333We use the colour transformations for the final 2MASS data release at http://www.astro.caltech.edu/jmc/2mass/v3/transformations .. allows us to identify four CTTS candidates by their infrared-excess. There is no source with stronger infrared-excess in this area, i.e., no protostars. These CTTS candidates are not located in the vicinity of HR 8119, but close to the east border of our selection area; one object has an optical extinction of about 7 mag, whereas the other sources do not have an optical extinction larger than 1 mag.
2.2 The distance to HR 8119 and Sh 2-129
Georgelin & Georgelin (1970) identified the hot (spectral type B0 V, Hiltner 1956) star HR 8119 (a.k.a. HD 202214) as the ionising source of Sh 2-129. Consequently, HR 8119 and Sh 2-129 must be located at the same distance. We also note that HR 8119 is the star with the earliest spectral type in the stellar group that is visible at the centre of this blister H ii region according to SIMBAD. This young star is a member of the Cepheus OB2 massive stars association (see, e.g., Fig. 3 of Patel et al. 1998)444Note in particular that HR 8119 cannot belong to the Trumpler 37 stellar cluster which is located inside the IC 1396 H ii region (a.k.a. Sh 2-131) at an angular distance of east from Sh 2-129.. HR 8119 also lies in the central part of Ou4, as noted by Acker et al. (2012).
Acker et al. (2012) estimated the distance of HR 8119 to be 870 pc by assuming no foreground extinction and an absolute magnitude for main-sequence stars, but the distance mostly used in the literature for Sh 2-129 is 400 pc. This latter value is the spectrophotometric distance derived by Georgelin & Georgelin (1970) assuming that HR 8119 is a single star. However, HR 8119 is a triple system, where the separations obtained from speckle interferometry between the primary and the Ab and B components were and , respectively, at epoch 2005.8654 (Mason et al. 2009). We improve the distance determination by combining the dynamical mass of HR 8119A with evolutionary tracks of massive stars with solar metallicity (Bertelli et al. 1994)555The CMD 2.5 web interface available at: http://stev.oapd.inaf.it/cgi-bin/cmd was used.. The orbital elements of the HR 8119Aa and Ab components were published by Zirm & Rica (2012) and flagged as reliable in the Sixth Catalog of Orbits of Visual Binary Stars666Catalog available on-line at: http://www.usno.navy.mil/USNO/astrometry/optical-IR-prod/wds/orb6 .. From the orbit semi-major axis () and the period ( yr), the following dynamical mass is obtained for HR 8119A: , where is the distance to HR 8119. The following observational constraints are used: the spectral type B0 V for the primary component, which corresponds to an effective temperature of 31,500 K (Pecaut & Mamajek 2013); the differential -band magnitude between the Ab and Aa components ( mag) in The Washington Visual Double Star Catalog (Mason et al. 2001); and the Tycho-2 magnitudes of HR 8119A and B, and 6.864 mag, and and 6.768 mag, respectively (Høg et al. 2000), which are converted to and 6.838 mag, and and 6.757 mag, respectively, using the filter transformations of Mamajek et al. (2002). Comparison of these photometric data with the evolutionary tracks provides a best-fit age of 3.7 Myr, which gives a total mass of 32.0 for HR 8119A777For the Aa, Ab, and B components, respectively: the masses are 17.8, 14.2, and 16.7 ; the effective temperatures are 31500, 29100, and 30800 K (corresponding to B0 V, B0.5 V, and B0 V spectral types according to Pecaut & Mamajek 2013; the luminosities are 41370, 20398, and 33595 ; the intrinsic colours are , , and ; the observed -band magnitudes are 6.579, 7.179, and 6.757 mag., a distance of 712 pc, and a foreground visual extinction of 1.1 mag. The latter is consistent with the computed colour excess of HR 8119B (adopting ). The age determination is consistent with the rather evolved evolutionary status of this H ii region and the lack of 2MASS sources (Skrutskie et al. 2006) with near-infrared excess (i.e., accretion circumstellar disc) in the vicinity of HR 8119. Therefore, we adopt a distance of 712 pc to HR 8119 and Sh 2-129.
3 Observations
 |
 |
 |
3.1 Imaging of Ou4
The imaging was carried out on 18 August 2012 at the F/3.3 2.5m Isaac Newton Telescope (INT) at the Observatorio del Roque de los Muchachos (ORM), La Palma, Spain. Images were taken with the Wide Field Camera (WFC) in three filters: a narrow-band [O iii] filter, with a central wavelength of 5008 Å and a bandpass of 100 Å; a narrow-band H filter, with a central wavelength of 6568 Å and a bandpass of 95 Å, thus including the [N ii] doublet around H; and a broadband Sloan filter, with a central wavelength of 4846 Å and a bandpass of 1285 Å. The plate scale is pix-1, and the seeing varied from to during of the night. As the field of view of the WFC is 3434 arcmin2, in order to cover the totality of Ou4 and the gaps between CCDs in the detector mosaic, six different telescope offsets, with generous overlapping among them, were adopted: at each of them, we exposed for a total of between 15 min and 45 min in [O iii], 5 and 15 min in H, and 90 sec in the filter. The night was dark: any significant moonlight would prevent detection of the nebula over the background given its very low surface brightness (see Sect. 4).
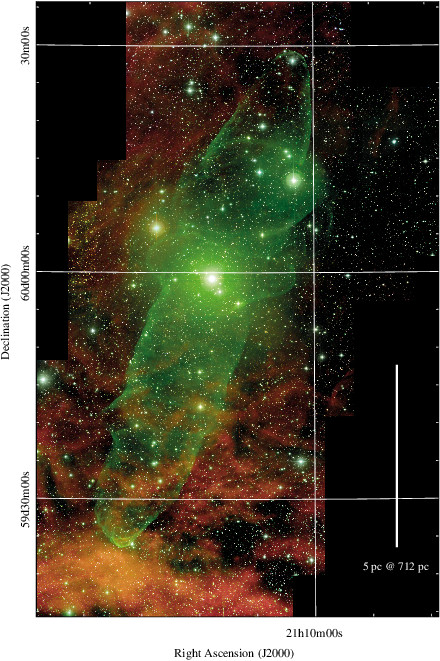
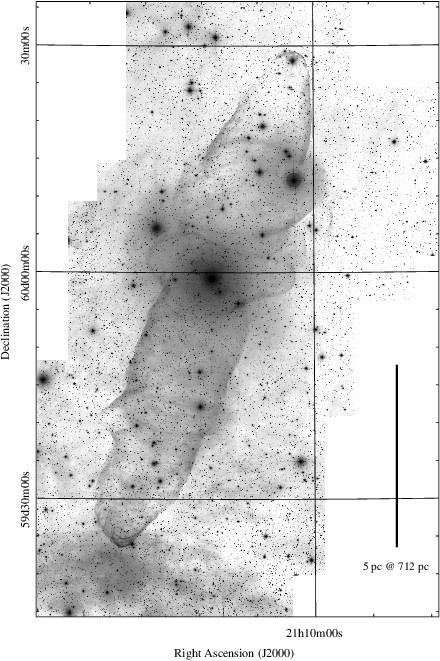
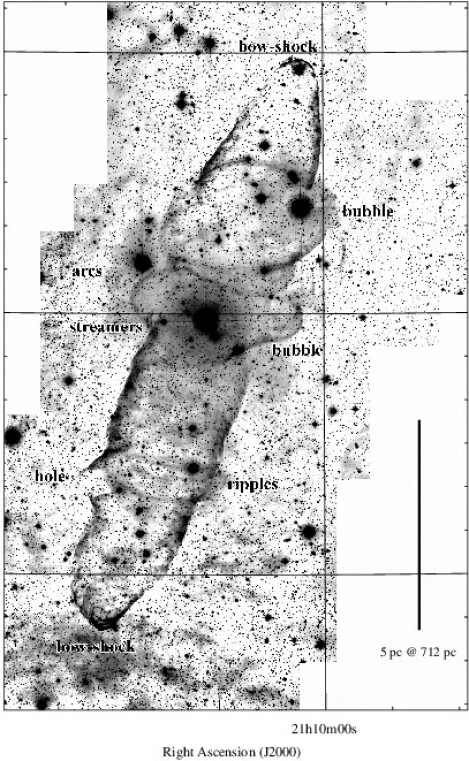
Images were reduced using the INT+WFC pipeline in Cambridge (CASU). Precise astrometric solution allowed a careful combination of all images using the swarp software (Bertin et al. 2002). The final mosaic has a field of view of roughly . As Ou4 and the surrounding H ii region Sh 2-129 cover the whole field of view of the camera, accurate background subtraction proved to be difficult and had to be carefully tuned. Figure 4 shows the colour-composite INT image of Ou4, while Fig. 5 shows the [O iii] and H+[N ii] images with labels on the most relevant morphological features discussed below.
3.2 Spectroscopy of the lobe tips
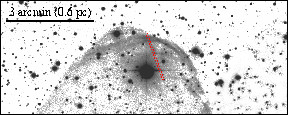
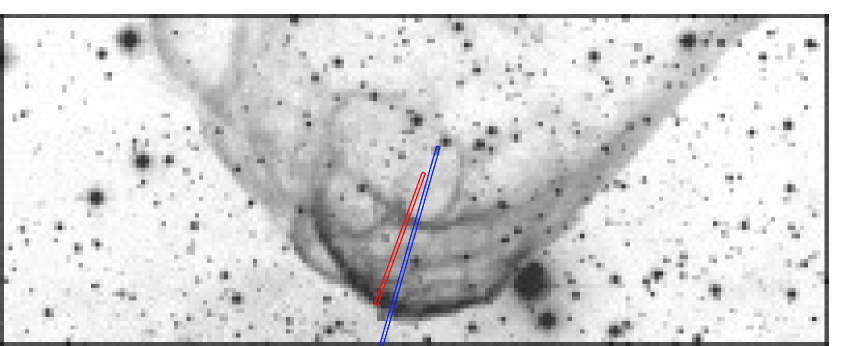
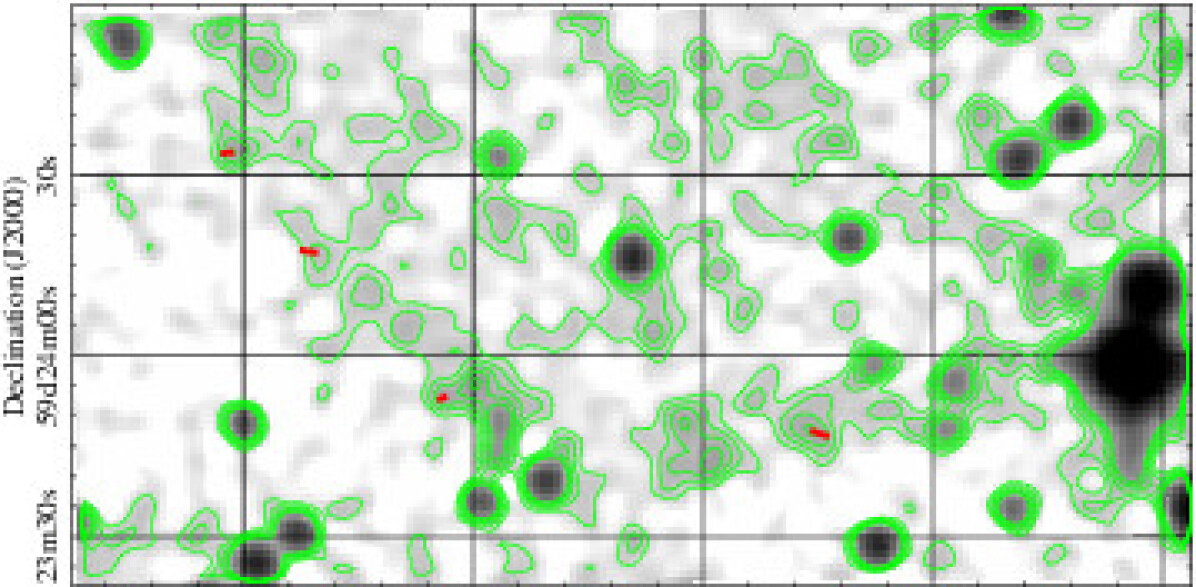
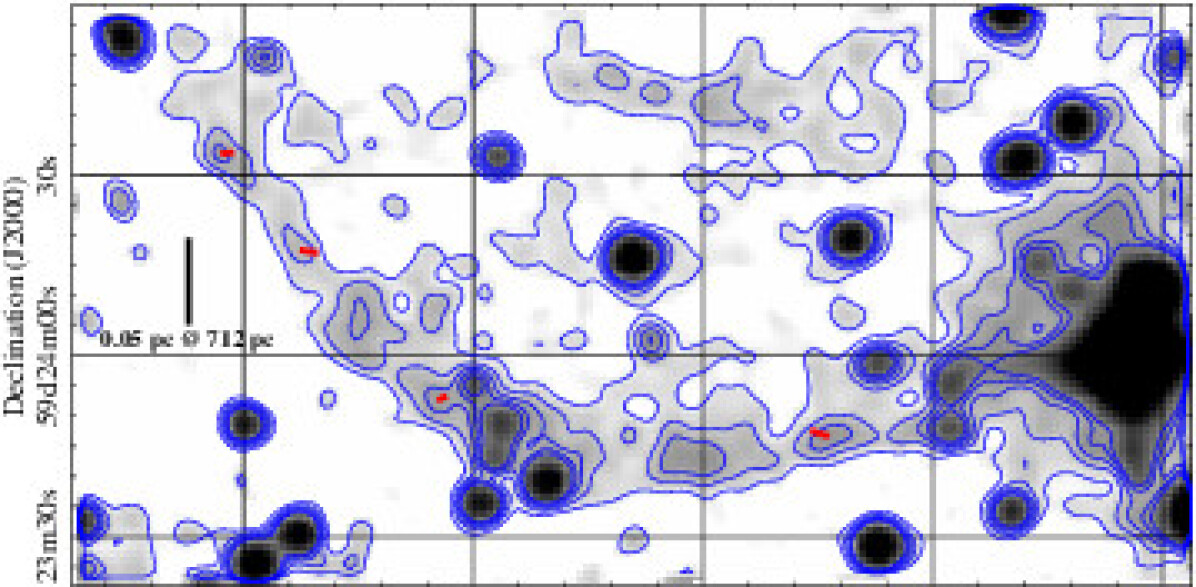
Spectra of Ou4 were obtained on 17 August 2012 with the 4.2m WHT telescope and the double-arm ISIS spectrograph. The long slit of ISIS was opened to 1″-width and positioned in the southern tip of the nebula at P.A.=344, crossing the bright ridge of the nebula at coordinates R.A.= and Dec= (J2000.0), as indicated in Fig. 7 by the long blue slit.
In the blue arm of ISIS, grating R300B was used, providing a dispersion of 1.7 Å per (binned 2) pixel, a resolution of 3.5 Å, and a spectral coverage from 3600 to 5200 Å. In the red arm, grating R158R gave a dispersion of 1.84 Å pix-1, a resolution of 3.5 Å, and a spectral coverage from 5400 to 7800 Å. Total exposure times was 2 hours. The spatial scale was per binned pixel in the blue, and in the red. Seeing was . The spectrophotometric standard BD+28 4211 from Oke (1990) was observed during the night for flux calibration.
In order to determine the basic kinematic properties of the outflow, spectra at a higher resolution were also obtained on 24 October and 25 December 2012 using the same instrument but grating 1200B. Useful data are limited to the [O iii] 5007 Å line, at which a spectral dispersion of 0.22 Å pix-1 and a resolution of 0.84 Å was achieved with the adopted slit width. The slits, also indicated in Fig. 7 in red, cross the south and north tips of the lobes of Ou4 at positions , (J2000) at P.A.=340, and , at P.A.=20, respectively. Total exposure times were 40 min in the south lobe, and 80 min in the fainter north lobe.
Spectra were reduced with the standard procedure using the longslit package of iraf V2.16888Iraf is distributed by the National Optical Astronomy Observatory, which is operated by the Association of Universities for Research in Astronomy (AURA) under cooperative agreement with the National Science Foundation..
4 Analysis
4.1 Overall morphology of Ou4
The bipolar nebula is mainly visible in the [O iii] 5007 light (green colour in Fig. 4, and left and middle panels of Fig. 5), whose surface brightness ranges from a few 10-16 erg cm-2 s-1 arcsec-2 (tip of southern lobe, see Sect. 4.3) down to the detection limit of our images of several 10-17 erg cm-2 s-1 arcsec-2 (in regions not contaminated by the diffraction halo of bright stars).
As described in Acker et al. (2012), Ou4 is mainly composed of two collimated lobes with arc-shaped tips of enhanced [O iii] emission. Their extremities recall the bow-shocks observed in collimated stellar outflows such as Herbig-Haro objects in the outflows from Young Stellar objects (Reipurth & Bally 2001), or in high velocity bipolar PNe. The south lobe, of cylindrical shape, is longer than the northern one, which instead has a more conical overall morphology. Neither lobe can be easily followed back to the central region, where a large distorted “bubble” is visible. This prevents a safe association of the nebula with one of the stars near its symmetry centre. Only the eastern ridge of the south lobe extends back enough to provide some useful indication. The lobe is wide till close to centre, where its edge is bowl shaped and bends toward a direction approximately pointing to HR 8119 (Fig. 7). However, detection of the faint emission from the lobe at distances smaller than from HR 8119 are prevented by the bright diffraction halo of this star. This marked lobe curvature near the centre is similar, for instance, to that of the inner lobes of the bipolar PN Mz 3 (Santander-García et al. 2004) or of several proto-PN such as Hen 401 (Sahai et al. 1999; Balick et al. 2013). The overall morphology of Ou4 is very similar to that of the giant bipolar PN KjPn 8 (López et al. 1995), which has a size of pc pc for the kinematically-determined distance of kpc (Boumis & Meaburn 2013).
Compared to the discovery image, the INT mosaic reveals a wealth of new details. In addition to the above-mentioned central bubble, another elliptical bubble breaks the inner regions of the northern lobe. Also, in the central region of the south lobe a “hole” is visible as well as “ripples” directed perpendicularly to its long-axis. East of the central distorted bubble, additional features in the form of “streamers” and “arcs” can be identified (Fig. 5). Finally, the tips of the lobes, and in particular the southern one, are composed of complex systems of multiple arcs (see also Fig. 7). The main properties of Ou4 determined in this work are summarised in Table 1.
In the H+[N ii] filter (red colour in Fig. 4, and right panel of Fig. 5), emission is dominated by ambient gas belonging to the H ii region Sh 2-129 with little contribution from Ou4 except at specific regions like the south and north bow-shocks.
| Ou4 | ||
| Lobe angular size | ||
| Linear size | 14.4 pc 2.5 pc | (712 pc) |
| Centre∗ | Equ. J2000 | |
| HR 8119 | Equ. J2000 | |
| Gal. J2000 | ||
| Tip of the South lobe | ||
| Optical extinction | 1.10.4 mag | |
| ([O iii], [O ii]) | 55,000 K, 20,000 K | See §4.3 |
| ([S ii]) | 50–100 cm-3 | See §4.3 |
| Proper motion | yr-1 tentative | See §4.4.2 |
| RV range† | — km s-1 | |
| Velocity | 112 km s-1 | See §4.4.3 |
| Tip of the North lobe | ||
| RV range† | — km s-1 | |
| Velocity | 83 km s-1 | See §4.4.3 |
∗ Approximate symmetry centre of the Ou4 nebula.
† Heliocentric, determined in the region covered by the slit (see Fig. 9).
4.2 Emission line distribution in the tip of the south lobe
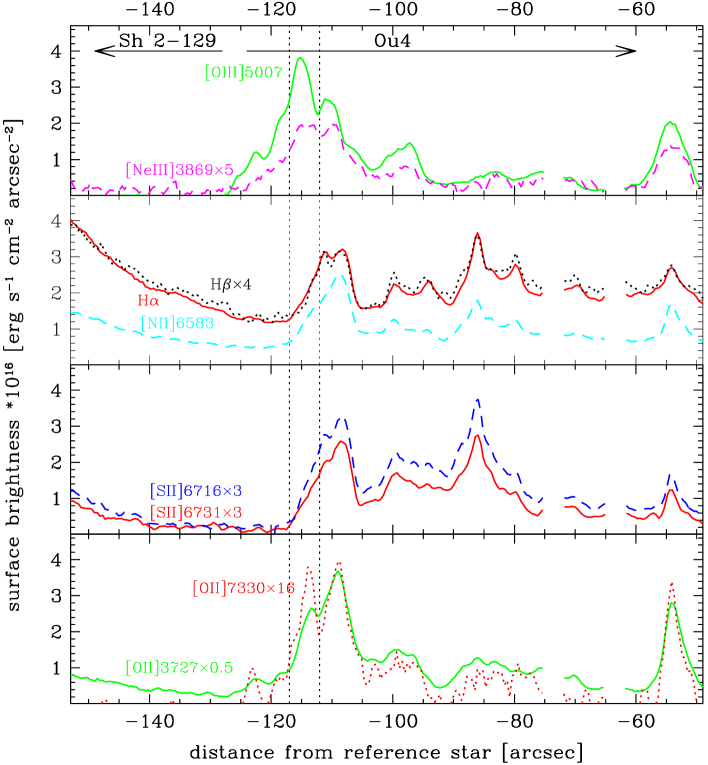
Insights into the excitation and dynamics of the nebula are gained by looking at the spatial distribution of different ions. This is shown in Fig. 8 for the lower resolution ISIS spectrum cutting the tip of the southern lobe approximately south-north (cf. bottom panel of Fig. 7). The upper panel of Fig. 8 shows the spatial distribution of representative lines with the highest ionisation potential, such as [O iii] 5007 and [Ne iii] 3869, while the middle and bottom panels present those with lower ionisation potential (H, [N ii], [S ii], and [O ii]). Profiles were smoothed with a boxcar filter size of 3 spatial pixels (). The field star 2MASS J21131972+5925365, visible at the upper end of the long blue slit in the bottom panel of Fig. 7, was used to anchor the blue and red spectra and define the zero–point of the spatial scale. Negative distances refer to positions south of the reference star.
The sharp edge of the southern lobe corresponds to the peak in the [O iii] 5007 emission at a distance . [Ne iii] has a similar behaviour, though the main peak is not equally pronounced. Ahead of the [O iii] peak (i.e., at ), significant H and [N ii], and to less extent [O ii] and [S ii] emission, can be associated with the H ii region Sh 2-129. These lower ionisation ions also contribute to the emission of Ou4, as shown by the several peaks at , but their overall distribution is obviously shifted to the north (i.e., “inside” the lobe) compared to [O iii]. In particular, [O ii] 3727, which is at least as bright as [O iii] 5007 (even taking into account mixing with the emission of Sh 2-129), peaks about two arcseconds north of [O iii]. Some faint [O i] 6300 emission, not shown in Fig. 8, is also detected inside the lobe. No significant differences are seen in the profiles of other lines not shown in Fig. 8, and in particular [O iii] 4363 is similar to [O iii] 5007, H to H, and [S ii] 6731 to [S ii] 6716.
This overall distribution, with the higher ionisation ions outward and the lower ionisation ones progressively inward, is a first indication that the gas in the tip of the south lobe of Ou4 is shock-excited. Photoionisation from a central source would instead produce an opposite stratification with the higher ionisation ions inwards.
4.3 Gas physical conditions from emission line ratios
Line fluxes for the Ou4 outflow were measured in the low-resolution spectrum crossing the tip of south lobe. A precise background subtraction is limited by the overlapping emission of the H ii region Sh 2-129, which surface brightness is highly variable at different spatial scales as it can be seen in the right panel of Fig. 5 and in Fig. 4. We have done several tests, and finally adopted a background (night sky + Sh 2-129) determined using the portion of the spectrum of the northernmost part of the slit, near the adopted reference star (Fig. 7). This is likely to leave some small contamination by Sh 2-129. Note that, however, the main conclusions of the analysis presented below are not affected by a different choice of the region used for background subtraction.
The ionisation stratification discussed in the previous section makes the line ratios highly dependent on the selected spatial region over which flux is integrated. We present in Table 2 line fluxes measured in the shocked gas between ″ and ″ from the reference star in the south lobe, around the main peak of the [O iii] emission. These integration limits are indicated by the vertical dotted lines in Fig. 8, and do not include the cooling region of lower excitation behind the shock.
In order to derive physical quantities from these fluxes, the nebular extinction is required. The logarithmic extinction constant has been determined from the Balmer decrement by averaging the results from the observed H/H and H/H ratios in our long-slit spectra. The theoretical Balmer line ratios were adopted from Brocklehurst (1971) for electron temperatures between 10000 and 20000 K and a low density regime (, see below). Rather than using only the narrow spatial region of the shocked gas around the [O iii] peak, to determine an average value of the extinction of the south lobe of Ou4 (which can be patchy at these relatively large angular sizes) we have considered a broader area between ″ and ″ from the reference star, where most of the Balmer line emission in the region covered by our long slit is produced (see Fig. 8). This also includes part of the cooling region behind the shock. We derive a value of =0.50.2 using the reddening law of Fitzpatrick (1999) and 3.1. This corresponds to =1.10.4 mag. The same value, within the errors, is found for the emission from Sh 2-129 ahead of the shock. This value was adopted to deredden the fluxes in Table 2. This foreground extinction value is also similar to the one that we found for HR 8119 in Sect. 2.
| Line identification | Flux | |
|---|---|---|
| Observed | Dereddened | |
| [O ii] 3726+3729 | 883.1 | 1262.3 |
| [Ne iii] 3869 | 72.5 | 99.3 |
| [Ne iii] 3968+H | 35.9 | 47.7 |
| H 4101 | 18.9 | 24.1 |
| H 4340 | 45.7 | 53.8 |
| [O iii] 4363 | 55.4 | 64.7 |
| H 4861 | 100.0 | 100.0 |
| [O iii] 4959 | 237.8 | 231.1 |
| [O iii] 5007 | 717.5 | 687.5 |
| [N ii] 6548 | 94.3 | 63.1 |
| H 6563 | 503.7 | 336.1 |
| [N ii] 6583 | 308.3 | 205.0 |
| [S ii] 6716 | 114.4 | 74.2 |
| [S ii] 6731 | 87.0 | 56.3 |
| [O ii] 7319 | 51.8 | 30.6 |
| [O ii] 7330 | 53.7 | 31.7 |
Physical conditions in the gas (electron density and temperature) were then computed using the nebular package within iraf, based on the five-level atom program originally published by De Robertis et al. (1987), and further developed by Shaw & Dufour (1995). From the [S ii] doublet, we obtain an electron density of between 50 cm-3 and 100 cm-3 depending on the adopted temperature. This is a lower limit for the gas density in the tip of the south lobe of Ou4, as the [S ii] emission mainly comes from the inside boundary of the selected region of the spectrum (see Fig. 8) and therefore traces a different nebular zone than [O iii]. In addition, non-negligible residual contribution of [S ii] emission from the overlapping low-density Sh 2-129 could be present. The electron temperature derived from the [O iii](5007+4959)/4363 line ratio is as large as 55,000 K for this density. This is a very high , which could be reduced to values typical of photoionised nebulae only if had the value of 107 cm-3 in the O2+ emitting region. On the other hand, [O ii] is expected to be produced in the same region as [S ii] (but note the additional emission peak of [O ii]7330 in Fig. 8), and therefore the [S ii] density can be adopted to compute from the [O ii](3726+3729)/(7320+7330) line ratio. The latter ratio also suggests a high electron temperatures (20,000 K), even though at low densities the [O ii] indicator runs into its asymptotic value.
Such a , too high to be produced by photoionisation, is another proof that the gas at the tip of the lobes of Ou4 is ionised by shocks. This conclusion is further supported by standard shock excitation diagnostic line ratios. In this nebular region, (H/[N ii]6548+6583) and (H/[S ii]6716+6731), which locates Ou4 together with shock-excited sources such as Herbig–Haro objects (see e.g. Viironen et al. 2009). The same conclusion is reached by analysing other portions of the slit. The lower-excitation emission inside the lobes is therefore expected to be the recombining/cooling region behind the shock. Integrating the [N ii](6548+6583)/5755 between slit positions -117″ and -105″, including the main [N ii] emission peak, we consistently obtain a lower temperature, 14,400 K.
The electron density of gas in the relatively bright region of Sh 2-129 ahead of the bow-shock (from -150″ to -130″ from reference star), determined from the [S ii]6716,6731 doublet, is =55 cm-3 assuming a typical for H ii regions of 10,000 K. Because this emission region is located on the ionized boundary of the H ii region, this electronic density is the one of the molecular cloud.
To estimate the electronic density inside the H ii region we use the H emission measure along the line-of-sight, , which can be computed from the H surface brightness corrected from extinction, , with the following formula: , which is valid for temperature between 5,000 and 10,000 K, and where is one Rayleigh, i.e., ergs cm-2 s-1 sr-1 at the H wavelength (Reynolds 1977). We assume for the H ii region a typical temperature of 10,000 K. From the Virginia Tech Spectral line Survey (VTSS; Finkbeiner 2003), which mapped the north-west half-part of Sh 2-129 in H with (FWHM) resolution, we obtain the radial profile from HR 8119 for a position angle of of the H intensity in unit, and deredden it using =1.1 mag and the extinction law of Fitzpatrick (1999). This intensity is modeled with a uniform intensity of 22.3 plus a constant-density (hemi-)spherical shell geometry to reproduce the limb brightening (e.g., Nazé et al. 2002), and convolved with a -FWHM Gaussian. To reproduce the external profile we need a shell-radius of (i.e., 9.4 pc at a distance of 712 pc), a shell-thickness of , and a shell-density of 5.1 cm-3. The constant-density inside the shell is estimated to about 1.7 cm-3. This lower electronic density of the blister H ii region compared to the molecular cloud is the result of the ionization and heating by the central early-type B stars, which have produced the Champagne flow.
If Ou4 is embedded in Sh 2-129, the pre-shock gas density is the electronic density inside this H ii region. Since this shock is radiative, the gas behind the shock relaxes to the H ii region temperature and if there is no magnetic field the shock compression ratio scales as Mach-number squared (Draine & McKee 1993). Taking for the ratio of specific heat and for the mean molecular weight inside the H ii region, the sound velocity is 14 km s-1 and a shock velocity of 112 km s-1 (see below Sect. 4.4.3) gives a Mach number of 8.0, which leads to a compression ratio of 64. Therefore, the post-shock gas density is estimated to 110 cm-3.
4.4 Kinematics of the lobe tips
4.4.1 Radial velocities
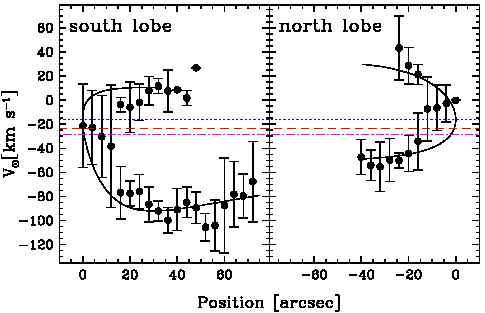
Heliocentric line-of-sight velocities in regions at the tip of each lobe were computed from the Doppler shift of the [O iii] 5007 line in the higher resolution spectra described in Sect. 3.2. The slit locations are indicated in Fig. 7. Wherever possible, two Gaussians were fitted to the spectra at different slit positions, binning the information every 4 arcseconds to increase the S/N. The resulting position velocity plot is presented in Fig. 9. Accuracy in the double-Gaussian fitting is mainly limited by the separation and shape of the profiles of the two line components. At the positions where they cannot be resolved, only a single Gaussian could be measured with generally large FWHM resulting by the blending of the two components. For this reason, we indicate in Fig. 9 the FWHM of the Gaussian line fits rather than the (smaller) formal error of the fitting.
The plot shows that there is only a small overall velocity difference between the two bow-shocks, indicating that the outflow is likely to be oriented near the plane of the sky. The north lobe would recede from us, and the south one approach us. Right inside each lobe, the [O iii] emission can be split into two components which are separated by up to about 100 km s-1 in the small fraction of the lobe length covered by these observations. Therefore a lower limit for the lobe “transverse” velocity can be set to 50 km s-1.
In Fig. 9, the radial velocities of HR 8119 and Sh 2-129 are also shown. The former ( km s-1, blue dotted line) is from Wilson (1953). The H average velocity of Sh 2-129 ( km s-1) obtained using Perot-Fabry measurements by Georgelin & Georgelin (1970) is indicated by the dashed red line, while the dashed-dotted magenta line represents the CO peak located east of HR 8119 on the border of Sh 2-129 ( km s-1; Blitz et al. 1982). The velocity of the two lobes is symmetrically located with respect to the massive star and the H ii region, further supporting their possible association with Ou4.
4.4.2 Proper motions
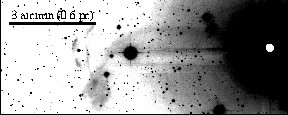
We identify the tip of the south lobe in two -band digitised plates obtained at two different epochs separated by nearly 41 years (Fig. 10). We use the imwcs software999The imwcs software is available at: http://tdc-www.harvard.edu/wcstools/imwcs . and the SExtractor software (Bertin & Arnouts 1996) to register these -band POSS1 and POSS2 images of Ou4 and our [O iii] INT image to the 2MASS reference frame (Skrutskie et al. 2006).
However, the modest spatial resolution and the weak S/N ratio prevent us to safely track any emission features between the POSS1 and POSS2 epochs. Our tentative pairing of a few emission features leads to a proper motion upper-limit of yr-1 (or a tangential velocity of km s-1 if Ou4 is located at the distance of HR 8119), where the proper motion error includes the error of the image registration and the determination of the features position.
4.4.3 Bow-shock kinematic model
The edges of the brightest working-surfaces of the south- and north-lobe tips (Fig. 7) can be fitted with a parabola. Assuming axisymmetry (see Fig. 1 of Hartigan et al. 1987), we can then argue that the intrinsic shape of the working surface is a paraboloid, as the projection onto the plane of the sky of such a geometric figure for any inclination angle is a parabola (see appendix of Hartigan et al. 1990). The actual 3D shape can then be computed for a given inclination of the bow shock along the line-of-sight.
In the shock rest frame, the parallel component of the velocity of the incoming gas does not change through the working surface, whereas the perpendicular component of the velocity is strongly decreased (by a factor of 4 by the shock and about 10 by cooling; see Hartigan et al. 1987). Therefore, in the observer frame the velocity of the emitting post-shock material, which fills a rather thin shell behind the working surface, is nearly perpendicular to the paraboloid surface, its intensity is maximum at the paraboloid vertex (i.e., equal to the shock velocity) and decreases from this position. The observed bow-shock size is directly controlled by the threshold value of the perpendicular component of the velocity that is required to produce the line emission conditions. For high inclinations the radial velocities derived by long-slit spectroscopy have a characteristic ”hook” shape in a velocity-position diagram, where the observed range of radial velocities is of the order of the actual bow-shock velocity (see Fig. 6 of Hartigan et al. 1990).
We build a toy model of this paraboloid bow-shock with the shape and the size measured from our images where we can vary the systemic radial velocity, the bow-show velocity and inclination along the line of sight, and compute the resulting radial velocities of the emitting post-shock material along our long-slit positions. The systemic radial velocity is estimated by averaging the first four (unresolved) radial velocity measurements at the bow-shock heads, and is fixed to this value ( km s-1) in our simulations. We also assume the same minimum perpendicular component of the velocity of the incoming gas in the shock rest-frame. These simulated velocity-position diagrams are then compared with the observed gas kinematic.
We show in Fig. 9 our best match for the south and north bow-shocks which is obtained for an inclination of and (where is a bow-shock directed towards us), and a shock velocity of 112 and 83 km s-1, respectively. The lower velocity of the north bow-shock may explain why it is fainter than the south one. This toy models allows us to reproduce the global properties of the observed gas kinematic.
With these shock velocities the minimum value of the perpendicular component of the velocity of the incoming gas in the shock rest-frame is 55 km s-1. The minimum perpendicular velocity needed to observe [O iii] is usually supposed to be equal to 90–100 km s-1, based on plane-parallel simulation of shock emission (e.g., Hartigan et al. 1987). However, if Ou4 is located inside the Sh 2-129 H ii region the pre-shocked gas already contains O+2 (see Fig. 1), and the perpendicular velocity needed to produce bright [O iii] may be lower. Confirming this hypothesis would require detailed emission modelling of the bow-shock and the H ii region which is well beyond the scope of this article.
These south and north bow-shock velocities correspond to proper motions of and yr-1, respectively, and to kinematical time scales of and yr, respectively. The poorly constrained proper motion of the south bow shock obtained in the previous section prevent us to derive a secure kinematic distance to Ou4. However, we can likely exclude any distance lower than about 133 pc which should lead to an apparent expansion of the lobe tips larger than our proper motion estimate plus 3 times our uncertainty.
4.5 The central part of Ou4: [O iii] emission vs. mid-infrared bubble
4.5.1 Morphology of the mid-infrared bubble
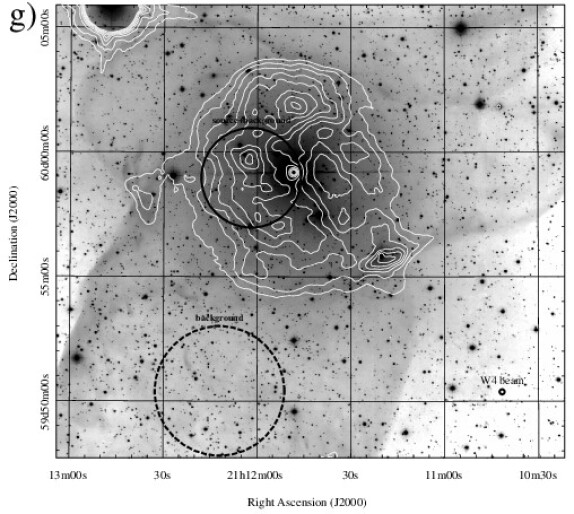
Figure 12 shows a contour map of the mid-infrared bubble detected in the WISE -filter image in the central region of Ou4 overlaid on the [O iii] image. The angular resolution of the -filter image is (FWHM). The central point-like source is the mid-infrared counterpart of HR 8119. The -radius extended emission is asymmetric, with a surface brightness which is on average about 3 times higher on the eastern-side than on the western-side. There are two peaks of emission, located at -east and -north from HR 8119. The north and south extensions of the mid-infrared bubble match the limit of the [O iii] bubbles (see also the middle-left panel of Fig. 13 for the full range of the intensity). A weak extension of the infrared bubble towards the East of HR 8119 corresponds to the base of the [O iii] streamers. A ridge of mid-infrared emission is located on the south-west border of the mid-infrared bubble. Fig. 12 is an enlargement of this region. The mid-infrared counterpart of the star HD 239597 (K2 spectral type in the Henry Draper catalogue and extension) is barely resolved from the ridge emission. This ridge emission corresponds to the [O iii] filaments that defines the southern-limit of the Ou4 bubble.
 |
 |
 |
 |
 |
 |
 |
4.5.2 Spectral energy distribution of the mid-infrared bubble
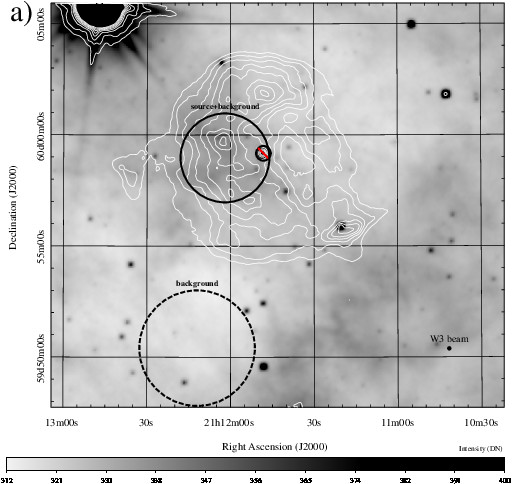
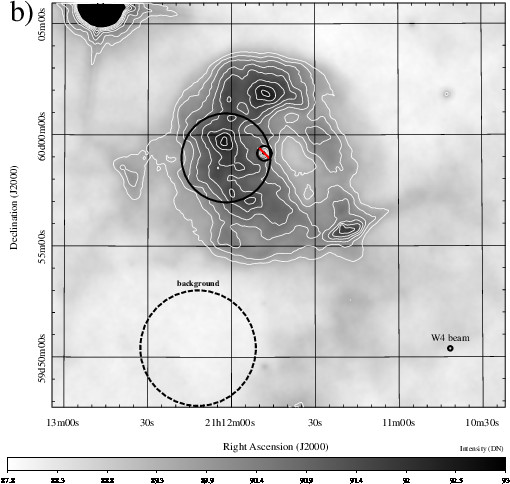
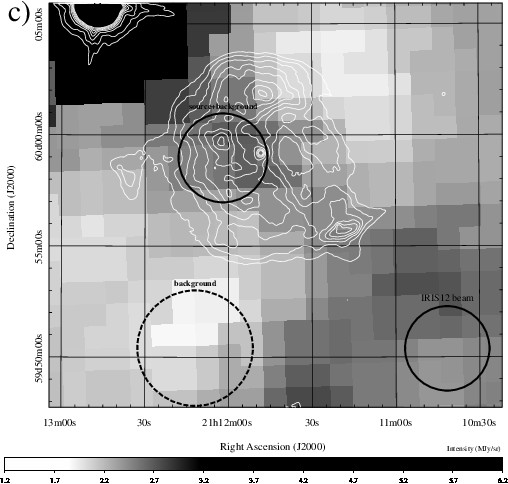
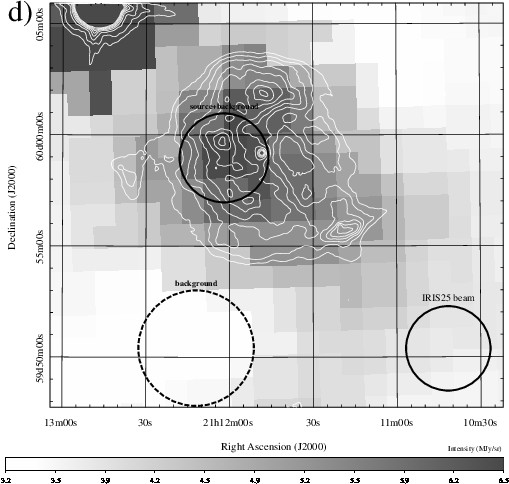
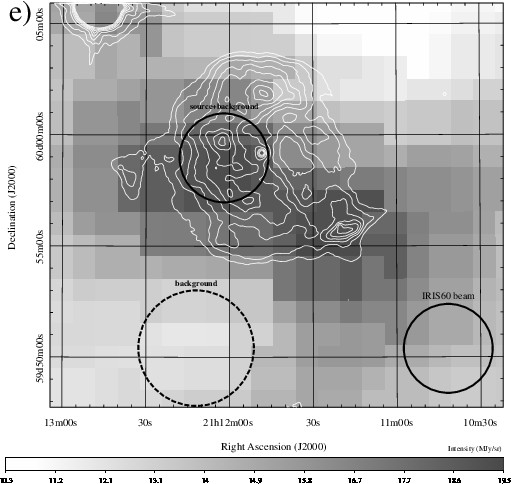
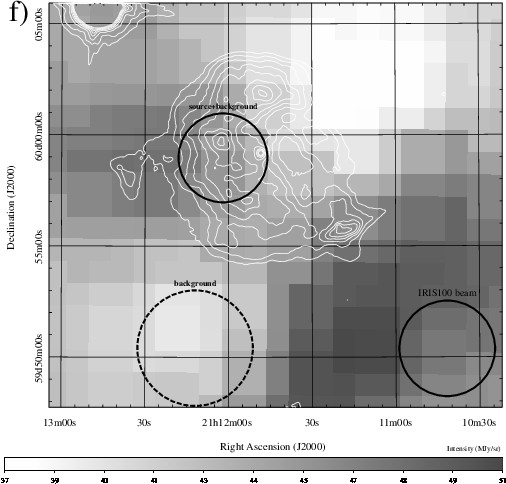
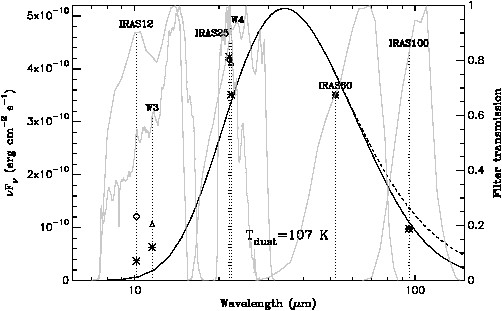
The location of the mid-infrared bubble inside the [O iii] emission may suggest line emission from hotter oxygen gas (e.g., [O iv] at m) rather than continuum emission from dust grains. Therefore to constrain the nature of the mid-infrared bubble we build a spectral energy distribution (SED) of the brightest emission peak by combining WISE (11.56 and 22.09 m) and IRAS (10.15, 21.73, 51.99, and 95.30 m) photometry. We use the WISE All-Sky Atlas images (Cutri et al. 2012) and the Improved Reprocessing of the IRAS Survey (IRIS; Miville-Deschênes & Lagache 2005) which provide us an angular resolution of , , , , , and (FWHM) at 12, 22, 12, 25, 60, and 100 m, respectively.
Despite the lower angular resolution of IRAS, the east-side of the mid-infrared bubble is detected in the IRIS 25-m image (see the middle-right panel of Fig. 13). We use a custom IDL program to perform circular-aperture photometry using a procedure adapted from DAOPHOT. In all images, the sourcebackground area is centred on (, ; J2000) with a radius of to match the angular resolution of IRIS images, and the background area is centred on (, ; J2000) with a radius of (Fig. 13). We subtract from the extended-source fluxes in the , , IRAS12, and IRASS25 bands the resolved fluxes of HR 8119 in the WISE All-Sky catalog (Cutri et al. 2012).
The resulting SED (Figure 14) shows significant flux emission in all bands, which is consistent with continuum emission from dust grains. Assuming that all grains have the same size distribution and composition, the dust emission is a single-temperature modified black-body emission, i.e., a black-body emission multiplied by the dust emissivity (e.g., Draine 2004): where is a solid angle, is the black-body of temperature , and is the optical depth. The dust optical depth along the line of sight is defined by: , where is the dust opacity, and is the dust mass-density. We use the dust opacity corresponding to the Milky Way dust with , computed for the carbonaceous/silicate dust model (Weingartner & Draine 2001; Draine 2003). The low foreground-extinction can be neglected. We convolve with the transmission profiles of the broad-band filters101010We use the Filter Profile Service of the Virtual Observatory available at http://svo2.cab.inta-csic.es/svo/theory/fps3/ .. We fit only the IRIS data points to mitigate the variation of angular resolution with wavelength. Our best fit111111The two other physical parameters are: the diameter of the black-body region () of 89 AU for a distance, , of 712 pc; and the dust surfacic mass () of 0.054 g cm-2. is obtained for a dust temperature of 107 K. The decrease of dust emissivity with wavelength affects only the fluxes in the and bands (see dashed line in Figure 14). The excess of emission in the and bands may be due to additional emission from the background cloud. The excess of emission observed in the band compared to the model prediction is likely due to the better angular resolution of WISE compared to IRIS. Our model predicts a maximum of dust emission around 34 m.
In conclusion, the overall SED is typical of continuum emission from hot dust grains.
5 Discussion and conclusions
Summarising, one of the main results of this study is that the tip of the south lobe of Ou4 is shock ionised. This is clearly indicated by the spatial distribution of the atomic emission, with the higher ionisation species outwards and the lower excitation, cooling post-shock gas inward, as well as by the observed line ratios and gas physical conditions.
The fact that this region is ionised by collisions rather than by photons, does not require that the central source at the origin of the outflow has the high temperature which would be needed to excite, e.g., O2+. Removing this constraint on the temperature of the central source may weaken the hypothesis that Ou4 is a PN. However, we do not have information about the ionisation mechanism of the inner regions of Ou4. It may well be that, in addition to shocks in the outermost regions outflow, a small photoioinised core is present, such as in the case of the PN KjPn 8 (López et al. 1995).
We estimate the probability of an apparent association between H ii regions and PNe by cross-correlating the WISE catalogue of H ii region (Anderson et al. 2014), which provides H ii angular radii from to , with the catalogue of Galactic PNe of Kohoutek (2001). We identify 29 on 1510 PNe (i.e., 1.6%) that are located inside H ii regions in projection. The mean and standard deviation of their Galactic latitudes is and , respectively, with a maximum angular distance from the Galactic plane of . Therefore, lucky association of H ii regions and PNe only occurs close to the Galactic plane due to the high spatial-density of both kind of objects in this region of the sky. Since the Galactic latitude of Sh 2-129 is high (), a fortuitous alignment with a PN appears as unlikely.
Given the apparent location of Ou4 in the sky, aligned with the young stellar cluster at the centre of the H ii region Sh 2-129 and the striking correspondence between the 22 m and [O iii] emission, it is reasonable to suppose that Ou4 is an outflow launched some 90,000 yr ago from the massive triple system HR 8119. The location of the outflow, its radial velocities and extinction values are all consistent with such an hypothesis. Further support might come from the fact that the south bow-shock has an enhanced brightness in correspondence with a bright portion of Sh 2-129, as expected if it were impinging on a denser zone at the border of the H ii region.
For comparison purpose, we estimate the kinetic energy of the Ou4 outflow. With lobe size of 2.5 pc 14.4 pc in extent, for a mean H ii density of 1.7 cm-3 and , the displaced mass is . With a shock propagating at 100 km s-1 the kinetic energy of the outflow is ergs, i.e., much lower than SNe. If the bipolar-cavity was created by an episodic, collimated, bipolar jet/wind propagating at 2,500 km s-1 (e.g., Steffen & López 1998), the conservation of the kinetic-energy would imply a mass ejected by the driving source of about . With a dynamical-time of 88,000 yr, the required mass-loss rate would be therefore yr-1. This value can be compared with the mass-loss rate from the radiatively-driven winds of the central massive stars. From the physical parameters of the stellar components Aa, Ab, and B of HR 8119 in Sect. 2.2 we estimate using the theoretical recipe of Vink et al. (2000) the mass-loss rates of , , and yr-1 with terminal velocities of 2515, 2508, and 2517 km s-1, respectively. Therefore, the two-most massive stars of HR 8119 with combined mass-loss rate of yr-1 and high terminal velocity can easily provide the required kinetic energy to drive Ou4. The larger separation of component Aa and B may explain the episodic phenomenon, whereas the close Ab companion could play a role in the outflow collimation.
In the alternative scenario that Ou4 is a PN, its overall morphology would likely be the result of the expansion of a fast collimated wind from a yet unidentified central source through a relatively dense circumstellar medium. If the cooling time of the shocked material (fast wind and/or ambient medium) is long enough, the fast collimated wind can inflate the observed thin lobes. The morphology of these lobes depends on several factors, mainly the opening angle of the fast outflow (Soker 2004). In addition, as discussed by Sahai et al. (1999) for the pre-PN Hen 401, the ambient density should decrease significantly with distance from the source in order to produce the cylindrical nebular morphology of the southern lobe. The presence of bow-shocks and the “bowl” shape of the base of the southern lobe star are also consistent with models considering the inflation of bipolar lobes by fast collimated outflows seen nearly edge-on (Soker 2002; Balick et al. 2013).
The study of this kind of collimated outflows in PNe and related objects often suggests an eruptive nature of the phenomenon, and that the central source is a binary system. The possibility that the outflow of Ou4 is produced in an outburst powered by mass accretion in a binary system, leading to a phenomenon such as an intermediate-luminosity optical transient (ILOT) as proposed for e.g. KjPn 8 (Boumis & Meaburn 2013), other bipolar PNe (Soker & Kashi 2012), or for massive (6–10 ) carbon-rich AGB, super-AGB, or post-AGB stars (Prieto et al. 2009), is an appealing one.
Concluding, it is clear that the stellar source at the origin of the Ou4 outflow should be better constrained. A crucial information in this respect is its distance. In the future, we aim at a precise measurement of the proper motions of the outflow which, combined with the line-of-sight velocities and kinematical modelling, would provide a sound distance determination. A more sensitive imaging of the vicinity of the bright star HR 8119 with narrower filters centred on emission lines would be also valuable to detect the origin of the outflow. In addition, extension of this study to other wavelength domains is planned to better constraint the nature of this unique giant outflow.
Acknowledgements.
We thank the referee John Bally and the editor Malcolm Walmsley for many useful suggestions that helped to improve our manuscript. We are grateful to the time allocation committee (CAT) for awarding us IAC Director Discretionary Time at the WHT and INT. The higher resolution spectra was secured during ING service time. We thank the ING staff, and in particular Javier Mendez, Raine Karjalainen, and the ING students for imaging attempted on an additional night, which could not be used due to the strong moonlight which prevented detection of the faint nebula. RLMC acknowledges funding from the Spanish AYA2007-66804 and AYA2012-35330 grants. We thank Stéphane Zoll for his [O iii] image of Ou4. Finally, we are very grateful to Gabriel Perez at the IAC for the careful edition of the colour image in Fig. 4. This research has made use of Aladin, and of the SIMBAD database, operated at CDS, Strasbourg, France. This publication makes use of data products from the Wide-field Infrared Survey Explorer, which is a joint project of the University of California, Los Angeles, and the Jet Propulsion Laboratory/California Institute of Technology, funded by the National Aeronautics and Space Administration.References
- Acker et al. (2012) Acker, A., Boffin, H. M. J., Outters, N., et al. 2012, Rev. Mexicana Astron. Astrofis., 48, 223
- Anderson et al. (2014) Anderson, L. D., Bania, T. M., Balser, D. S., et al. 2014, ApJS, 212, 1
- Balick et al. (2013) Balick, B., Frank, A., Huarte-Espinosa, M., et al. 2013, ApJ, in preparation
- Bertelli et al. (1994) Bertelli, G., Bressan, A., Chiosi, C., Fagotto, F., & Nasi, E. 1994, A&AS, 106, 275
- Bertin & Arnouts (1996) Bertin, E. & Arnouts, S. 1996, A&AS, 117, 393
- Bertin et al. (2002) Bertin, E., Mellier, Y., Radovich, M., et al. 2002, in Astronomical Society of the Pacific Conference Series, Vol. 281, Astronomical Data Analysis Software and Systems XI, ed. D. A. Bohlender, D. Durand, & T. H. Handley, 228
- Bessell & Brett (1988) Bessell, M. S. & Brett, J. M. 1988, PASP, 100, 1134
- Blitz et al. (1982) Blitz, L., Fich, M., & Stark, A. A. 1982, ApJS, 49, 183
- Bonnarel et al. (2000) Bonnarel, F., Fernique, P., Bienaymé, O., et al. 2000, A&AS, 143, 33
- Boumis & Meaburn (2013) Boumis, P. & Meaburn, J. 2013, MNRAS, 430, 3397
- Brocklehurst (1971) Brocklehurst, M. 1971, MNRAS, 153, 471
- Cohen et al. (1981) Cohen, J. G., Persson, S. E., Elias, J. H., & Frogel, J. A. 1981, ApJ, 249, 481
- Condon et al. (1994) Condon, J. J., Broderick, J. J., Seielstad, G. A., Douglas, K., & Gregory, P. C. 1994, AJ, 107, 1829
- Cutri et al. (2012) Cutri, R. M., Wright, E. L., Conrow, T., et al. 2012, Explanatory Supplement to the WISE All-Sky Data Release Products, Tech. rep.
- De Robertis et al. (1987) De Robertis, M. M., Dufour, R. J., & Hunt, R. W. 1987, JRASC, 81, 195
- Deharveng et al. (2010) Deharveng, L., Schuller, F., Anderson, L. D., et al. 2010, A&A, 523, A6
- Draine (2003) Draine, B. T. 2003, ApJ, 598, 1026
- Draine (2004) Draine, B. T. 2004, in The Cold Universe, ed. A. W. Blain, F. Combes, B. T. Draine, D. Pfenniger, & Y. Revaz (Springer), 213
- Draine & McKee (1993) Draine, B. T. & McKee, C. F. 1993, ARA&A, 31, 373
- Finkbeiner (2003) Finkbeiner, D. P. 2003, ApJS, 146, 407
- Fitzpatrick (1999) Fitzpatrick, E. L. 1999, PASP, 111, 63
- Georgelin & Georgelin (1970) Georgelin, Y. P. & Georgelin, Y. M. 1970, A&AS, 3, 1
- Hartigan et al. (1987) Hartigan, P., Raymond, J., & Hartmann, L. 1987, ApJ, 316, 323
- Hartigan et al. (1990) Hartigan, P., Raymond, J., & Meaburn, J. 1990, ApJ, 362, 624
- Hiltner (1956) Hiltner, W. A. 1956, ApJS, 2, 389
- Høg et al. (2000) Høg, E., Fabricius, C., Makarov, V. V., et al. 2000, A&A, 355, L27
- Kohoutek (2001) Kohoutek, L. 2001, A&A, 378, 843
- López et al. (1995) López, J. A., Vázquez, R., & Rodríguez, L. F. 1995, ApJ, 455, L63
- Mamajek et al. (2002) Mamajek, E. E., Meyer, M. R., & Liebert, J. 2002, AJ, 124, 1670
- Mason et al. (2009) Mason, B. D., Hartkopf, W. I., Gies, D. R., Henry, T. J., & Helsel, J. W. 2009, AJ, 137, 3358
- Mason et al. (2001) Mason, B. D., Wycoff, G. L., Hartkopf, W. I., Douglass, G. G., & Worley, C. E. 2001, AJ, 122, 3466
- Meyer et al. (1997) Meyer, M. R., Calvet, N., & Hillenbrand, L. A. 1997, AJ, 114, 288
- Miville-Deschênes & Lagache (2005) Miville-Deschênes, M.-A. & Lagache, G. 2005, ApJS, 157, 302
- Nazé et al. (2002) Nazé, Y., Chu, Y.-H., Guerrero, M. A., et al. 2002, AJ, 124, 3325
- Oke (1990) Oke, J. B. 1990, AJ, 99, 1621
- Patel et al. (1998) Patel, N. A., Goldsmith, P. F., Heyer, M. H., Snell, R. L., & Pratap, P. 1998, ApJ, 507, 241
- Pecaut & Mamajek (2013) Pecaut, M. J. & Mamajek, E. E. 2013, ApJS, 208, 9
- Prieto et al. (2009) Prieto, J. L., Sellgren, K., Thompson, T. A., & Kochanek, C. S. 2009, ApJ, 705, 1425
- Reipurth & Bally (2001) Reipurth, B. & Bally, J. 2001, ARA&A, 39, 403
- Reynolds (1977) Reynolds, R. J. 1977, ApJ, 216, 433
- Sahai et al. (1999) Sahai, R., Bujarrabal, V., & Zijlstra, A. 1999, ApJ, 518, L115
- Santander-García et al. (2004) Santander-García, M., Corradi, R. L. M., Balick, B., & Mampaso, A. 2004, A&A, 426, 185
- Shaw & Dufour (1995) Shaw, R. A. & Dufour, R. J. 1995, PASP, 107, 896
- Skrutskie et al. (2006) Skrutskie, M. F., Cutri, R. M., Stiening, R., et al. 2006, AJ, 131, 1163
- Soker (2002) Soker, N. 2002, ApJ, 568, 726
- Soker (2004) Soker, N. 2004, A&A, 414, 943
- Soker & Kashi (2012) Soker, N. & Kashi, A. 2012, ApJ, 746, 100
- Steffen & López (1998) Steffen, W. & López, J. A. 1998, ApJ, 508, 696
- Tenorio-Tagle (1979) Tenorio-Tagle, G. 1979, A&A, 71, 59
- Viironen et al. (2009) Viironen, K., Greimel, R., Corradi, R. L. M., et al. 2009, A&A, 504, 291
- Vink et al. (2000) Vink, J. S., de Koter, A., & Lamers, H. J. G. L. M. 2000, A&A, 362, 295
- Weingartner & Draine (2001) Weingartner, J. C. & Draine, B. T. 2001, ApJ, 548, 296
- Wilson (1953) Wilson, R. E. 1953, General catalogue of stellar radial velocities, Vol. 601 (Carnegie Institution of Washington, Washington D.C.)
- Wright et al. (2010) Wright, E. L., Eisenhardt, P. R. M., Mainzer, A. K., et al. 2010, AJ, 140, 1868
- Yorke et al. (1983) Yorke, H. W., Tenorio-Tagle, G., & Bodenheimer, P. 1983, A&A, 127, 313
- Zirm & Rica (2012) Zirm, A. & Rica, F. 2012, Inf. Circ. IAU Double Stars, 176