11email: moriyatk@astro.uni-bonn.de 22institutetext: Department of Physics, Faculty of Science and Engineering, Konan University, 8-9-1 Okamoto, Kobe, Hyogo 658-8501, Japan 33institutetext: Kavli Institute for the Physics and Mathematics of the Universe (WPI), Todai Institutes for Advanced Study, The University of Tokyo, 5-1-5 Kashiwanoha, Kashiwa, Chiba 277-8583, Japan 44institutetext: Hamamatsu Professor 55institutetext: Institute for Theoretical and Experimental Physics, Bolshaya Cheremushkinskaya 25, 117218 Moscow, Russia 66institutetext: Sternberg Astronomical Institute, M.V. Lomonosov Moscow State University, Universitetski pr. 13, 119992 Moscow, Russia
Electron-capture supernovae exploding within
their progenitor wind
The most massive stars on the asymptotic giant branch (AGB), so called super-AGB stars, are thought to produce supernovae triggered by electron captures in their degenerate O+Ne+Mg cores. Super-AGB stars are expected to have slow winds with high mass-loss rates, so their circumstellar density is high. The explosions of super-AGB stars are therefore presumed to occur in this dense circumstellar environment. We provide the first synthetic light curves for such events by exploding realistic electron-capture supernova progenitors within their super-AGB winds. We find that the early light curve, i.e. before the recombination wave reaches the bottom of the hydrogen-rich envelope of supernova ejecta (the plateau phase), is not affected by the dense wind. However, after the luminosity drop following the plateau phase, the luminosity remains much higher when the super-AGB wind is taken into account. We compare our results to the historical light curve of SN 1054, the progenitor of the Crab Nebula, and show that the explosion of an electron-capture supernova within an ordinary super-AGB wind can explain the observed light curve features. We conclude that SN 1054 could have been a Type IIn supernova without any extra extreme mass loss which was previously suggested to be necessary to account for its early high luminosity. We also show that our light curves match Type IIn supernovae with an early plateau phase (so-called ‘Type IIn-P’) and suggest that they are electron-capture supernovae within super-AGB winds. Although some electron-capture supernovae can be bright in the optical spectral range due to the large progenitor radius, their X-ray luminosity from the interaction does not necessarily get as bright as other Type IIn supernovae whose optical luminosities are also powered by the interaction. Thus, we suggest that optically-bright X-ray-faint Type IIn supernovae can emerge from electron-capture supernovae. Optically-faint Type IIn supernovae, such as SN 2008S, can also originate from electron-capture supernovae if their hydrogen-rich envelope masses are small. We argue that some of them can be observed as ‘Type IIn-b’ supernovae due to the small hydrogen-rich envelope mass.
Key Words.:
stars: massive – stars: mass-loss – supernovae: general – supernovae: individual (SN 1054, SN 2009kn)1 Introduction
Massive stars are known to explode as supernovae (SNe) because of the central core collapse. Stars with the zero-age main-sequence mass above around 10 trigger the core collapse after the formation of an Fe core. However, it has been suggested that massive stars whose mass is slightly smaller than the mass required to form the Fe core can still make an electron degenerate O+Ne+Mg core which can trigger core collapse through the electron-capture reactions (e.g., Miyaji et al., 1980; Nomoto et al., 1982; Nomoto, 1984, 1985, 1987; Miyaji & Nomoto, 1987). Core-collapse SNe triggered by the electron-capture reactions are called electron-capture SNe (ecSNe).
The ecSN progenitors are super-asymptotic giant branch (super-AGB) stars at the onset of the core collapse if they are single stars. Since there are many uncertainties in thermal pulses, mass loss, etc., in the evolution of super-AGB stars, the exact mass range of ecSN progenitors, or even the existence of them, is theoretically not well-constrained (e.g., Langer, 2012; Poelarends et al., 2008; Siess, 2007, 2010; Jones et al., 2013; Takahashi et al., 2013). It is also suggested that the binary evolution can help a star exploding as an ecSN (Podsiadlowski et al., 2004; Nomoto, 1985). While the exact mass range or the existence of ecSN progenitors remains uncertain, several first-principle numerical simulations of the O+Ne+Mg core collapse succeeded in predicting the observational properties of ecSNe. The ecSNe are predicted to have small explosion energy ( erg) and small production ( ) by the neutrino-driven explosion (Kitaura et al., 2006; Burrows et al., 2007; Janka et al., 2008; Hoffman et al., 2008; Wanajo et al., 2009).
Several SNe have been related to ecSNe based on the predicted ecSN properties (e.g.. Botticella et al., 2009; Thompson et al., 2009; Pumo et al., 2009; Kawabata et al., 2010). The most famous SN related to an ecSN is SN 1054 or the Crab Nebula (see Section 4.1). However, while several numerical simulations of the explosions of ecSNe have been performed by using the realistic progenitor model, there is little theoretical study on the LC properties of ecSNe. Recently, Tominaga et al. (2013, TBN13 hereafter) performed numerical LC calculations by using realistic ecSN progenitor model and provided the LC properties of ecSNe. They have shown that ecSNe can be bright ( mag in optical bands) in spite of the small predicted explosion energy because of the large progenitor radius and the small H-rich envelope mass. Super-AGB stars are known to have high mass-loss rates ( , e.g., Poelarends et al. 2008) and the ecSN progenitors can lose a large fraction of their H-rich envelope as a result of the large mass loss during the super-AGB phase, which is quite distinct from a-little-more massive stars causing the Fe core collapse.
An important characteristics of ecSNe which TBN13 did not consider is the existence of the super-AGB wind around the ecSN progenitors. The ecSN progenitors should be within the circumstellar medium (CSM) created by the super-AGB wind when they explode if they are single stars. In addition to the high mass-loss rates, the wind velocities of super-AGB stars are , making the CSM density as high as those expected for Type IIn SNe (SNe IIn) in which we see the effect of the CSM interaction in their observational properties (e.g., Kiewe et al. 2012; Taddia et al. 2013; Fransson et al. 2013; Moriya et al. 2014; see Section 2.1.2). It is even suggested that most of SNe IIn may come from the low mass stars which are consistent with ecSNe (Habergham et al., 2014; Anderson et al., 2012).
The fact that ecSNe can be bright despite the small explosion energy was already suggested by van Veelen (2010) by modeling the interaction between ecSN ejecta and expected dense CSM. Smith (2013) also discussed the effect of dense CSM on ecSN LCs. He suggested that the early large luminosity of SN 1054 from an ecSN indicates the existence of confined dense CSM from eruptive mass loss (see Section 4.1 for the discussion of SN 1054). However, as is shown by TBN13; van Veelen (2010), ecSNe can be as bright as SN 1054 in spite of the low explosion energy because of the expected large progenitor radius and small mass of the H-rich envelope.
The previous numerical simulations of ecSN LCs do not take either the realistic ecSN progenitor model (van Veelen, 2010) or the existence of the dense CSM around the ecSN progenitors (TBN13) into account. In this paper, we combine the two previous LC studies of ecSNe and perform the numerical LC simulation of ecSNe exploding in the super-AGB wind. We provide realistic ecSN LCs to compare with observations.
The rest of this paper is organized as follows. At first, in Section 2.1, we explain the progenitors and their CSM we use for our LC modeling of ecSNe as well as the properties of the SN explosions. Then, we show the synthesized LCs in Section 3. The LCs are compared to observed SN LCs with special focus on SN 1054 and so-called ‘Type IIn-P’ SNe in Section 4. We conclude this paper in Section 5.
2 Initial conditions
2.1 Progenitors and circumstellar media
2.1.1 Electron-capture SN progenitors
The super-AGB ecSN progenitors we use in this work is the same as those presented in TBN13. The progenitor models are constructed by attaching a H-rich envelope (Nomoto & Sugimoto, 1972) to the thin He layer on the 1.377 O+Ne+Mg ecSN progenitor obtained by Nomoto et al. (1982); Nomoto (1984, 1987). TBN13 constructed several ecSN progenitors with different envelope masses () and hydrogen fractions (). In this work, we take the model with and as a fiducial model. The LC from the model was compare to that of SN 1054 in TBN13. The hydrogen fraction is rather low in the model. The hydrogen fraction affects the early plateau length in LCs, but the differences between the plateau lengths of the models and the models are less than 20 days (TBN13). The plateau luminosity is not strongly affected by the composition. The radius and luminosity of the model are cm ( ) and ( ), respectively. See TBN13 for the detailed properties of the progenitors.
2.1.2 Circumstellar media
We put the CSM expected from super-AGB winds outside the aforementioned ecSN progenitors. However, the mass loss from super-AGB stars is uncertain. Poelarends et al. (2008) adopted several mass-loss prescriptions to follow the super-AGB evolution and found that the differences in the mass-loss prescriptions do not significantly affect the final results. The mass-loss rates are around (Poelarends et al., 2008). We adopt three mass-loss rates in our LC calculations, i.e., , , and . Although we construct the CSM assuming that the mass-loss rates are constant, super-AGB stars experience thermal pulses and the mass-loss rates can alter significantly in a short timescale (e.g., Jones et al., 2013; Lau et al., 2012).
Another important quantity we need to know to estimate the CSM density is the wind velocity . The escape velocity of our fiducial progenitor is 41 . The actual terminal wind velocity is, again, uncertain. van Veelen (2010) argued that the wind velocity can be as low as 30% of the escape velocity based on the formulation of Eldridge et al. (2006). Here, we take as a representative wind velocity as was assumed in van Veelen (2010).
Given the mass-loss rate () and wind velocity (), the CSM density is set as
| (1) |
where is radius. The super-AGB phase is assumed to continue for years (e.g., Poelarends et al., 2008) and the dense CSM should reach cm in the super-AGB phase. However, the CSM radius boundary is arbitrarily set at cm in the initial condition of the numerical simulations we performed. Thus, the effect of the dense CSM on the LCs is expected to last longer than we obtain, as will be discussed in the following sections.
It is an important feature that the CSM density of the super-AGB wind is similar to those estimated in the CSM of typical SNe IIn. The CSM density is proportional to (Eq. 1). The typical CSM properties of SNe IIn are estimated to be with (e.g., Kiewe et al., 2012; Taddia et al., 2013; Fransson et al., 2013; Moriya et al., 2014). While the mass-loss rates of the super-AGB stars ( ) are about one order of magnitude smaller than those estimated for SNe IIn, the wind velocity is also one order of magnitude smaller. Thus, the CSM density from the super-AGB wind is presumed to be high enough to affect the LCs and spectra of ecSNe as much as we observe in SNe IIn.
2.2 Explosion properties and light curve calculations
The explosions of super-AGB stars are followed in the same way as in TBN13. The explosions of the ecSN progenitors are numerically followed with a one-dimensional multigroup radiation hydrodynamics code STELLA (e.g., Blinnikov et al., 2006; Blinnikov et al., 1998). The explosions are initiated by putting thermal energy at the center. The explosion energy is set as erg, which is based on the numerical simulations performed with the first principles (Kitaura et al., 2006), unless otherwise mentioned. STELLA does not follow the explosive nucleosynthesis and we need to provide the chemical yields from the explosive nucleosynthesis to obtain the opacity and the energy input from the nuclear decay of . We use the chemical yields from a nucleosynthesis calculation of the self-consistent ecSN explosion performed with the same O+Ne+Mg core (Model ST in Wanajo et al. 2009). of is produced in the model. We assume the envelope is not affected by the explosive nucleosynthesis. Finally, TBN13 investigated the effect of the central pulsar to the LC but we do not take it into account in this paper.
3 Light curve properties
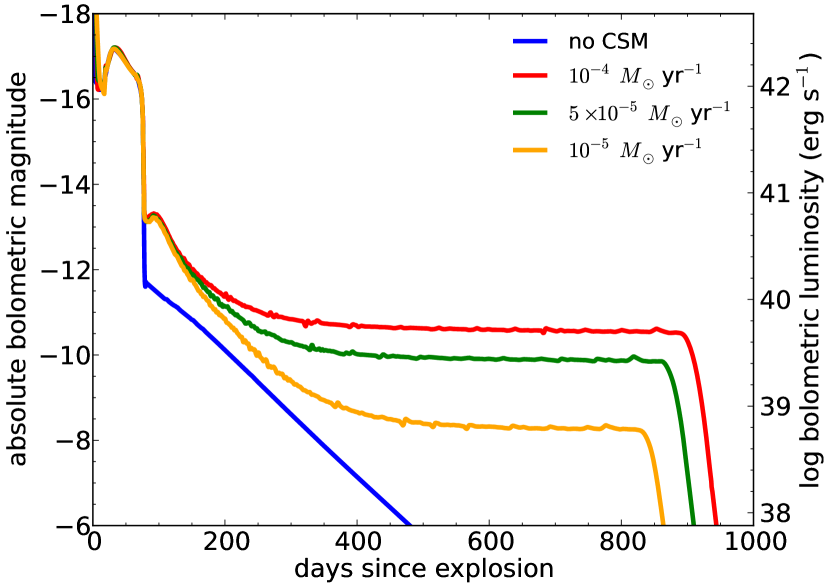
Synthetic bolometric LCs are presented in Fig. 1. The LC without CSM is the one already presented in TBN13. It stays bright until the photosphere located at the hydrogen recombination front resides in the H-rich envelope. This early phase is essentially the same as the plateau phase of Type IIP SNe. As is already shown by TBN13, the plateau phase is bright in spite of the low explosion energy. This is because of the large progenitor radius and the small H-rich envelope mass expected for super-AGB SN progenitors (cf. Kasen & Woosley, 2009; Young, 2004). The length of the plateau phase depends on the mass and composition of the H-rich envelope and it can be longer than 100 days (TBN13). The luminosity drops by about two orders of magnitudes at the end of the plateau and the LC starts to follow the decay of if there is no CSM.
Even if we take the effect of the CSM interaction into account, the early LCs during the plateau phase are still dominated by the light from the SN ejecta. The effect of the super-AGB wind on the LCs starts to appear after the plateau.
The effect of the interaction on the LCs is examined in detail in Fig. 2. In addition to the models with no CSM and presented in Fig. 1, the analytic bolometric LC models based on Moriya et al. (2013b) are shown (AN1 and AN2). The analytic LC is expressed as
| (2) |
where
| (3) |
is the time since the explosion, is the SN kinetic energy, is the SN ejecta mass, is the outer density slope of the SN ejecta (), is the inner density slope of the SN ejecta (), and is the conversion efficiency from kinetic energy to radiation. We refer Moriya et al. (2013b) for further details. In this paper, we set and to compare the model with that of van Veelen (2010) below but the LC does not strongly depend on the choice of and within the reasonable range ( and ). All the analytic models shown in Fig. 2 assume and . The AN1 model in Fig. 2 assumes erg and . As will be discussed below, the conversion efficiency is uncertain in both the numerical and analytic models. in AN1 is chosen to match the later luminosity of the numerical model ().
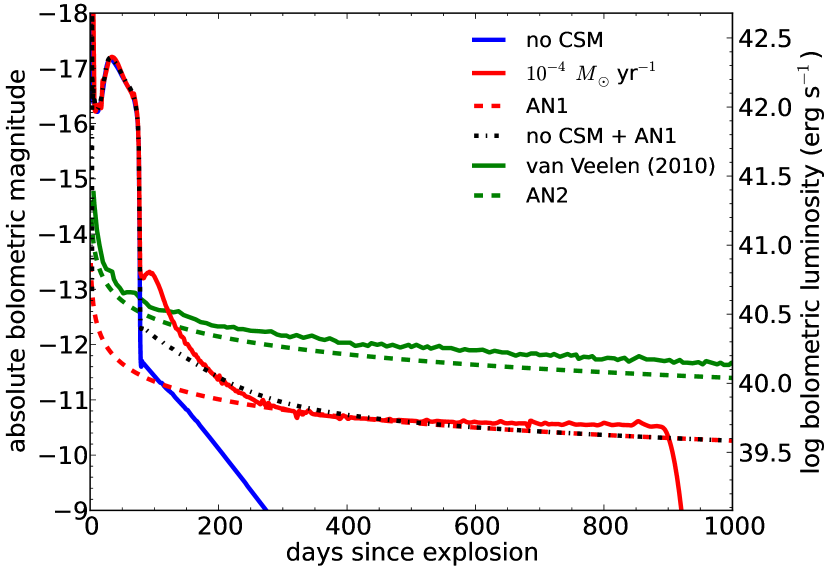
The analytic model represents the contribution of the luminosity from the interaction. In Fig. 2, we also present a model in which the luminosities of the numerical no CSM model and the analytic AN1 model are added. This model can roughly explain the bolometric luminosity evolution of the numerical model with the super-AGB wind. Large differences between the numerical model and the added model appear in two phases, i.e., (i) just after the plateau phase at around 100 days and (ii) around 900 days when the numerical LC drops significantly. The earlier luminosity discrepancy (i) is caused by the higher photospheric temperature in the numerical interacting model. The similar kind of smooth transition is also found in the explosion modeling of red supergiants within dense CSM (Moriya et al., 2011). The later sudden decline (ii) appears because the shock goes out of the dense CSM whose radius is arbitrarily set at cm. If the super-AGB phase continues for years with the wind speed of 20 , the dense CSM should actually be extended up to cm. This means that the interaction should actually continue further and the LC continues to be bright as we see in the analytic model.
In Fig. 2, we also show the numerical bolometric LC for the interaction between ecSN ejecta and dense CSM obtained by van Veelen (2010). The bolometric LC is obtained with the hydrodynamics code ZEUS-MP combined with a cooling function which is applicable to the optically thin system. The method is similar to that adopted by van Marle et al. (2010). The homologous SN ejecta is assumed to have two density components with and . The hydrodynamical calculation is performed in two dimensions. The SN ejecta mass is 3.15 and the kinetic energy is erg, respectively. These parameters are almost the same as in our model. The SN ejecta is connected to the dense CSM with and at cm.
Since the numerical interaction model of van Veelen (2010) does not take account of the recombination process in the SN ejecta, the early LC evolution is different from what we obtained. However, even at the epochs when our LC model is dominated by the luminosity from the interaction, there remains the difference in the luminosity by a factor of about 3. The difference is likely to stem from the uncertainty in the conversion efficiency . We plot another analytic LC of Moriya et al. (2013b) (Eq. 2) with and erg in Fig. 2 (AN2). The analytic model AN2 matches the numerical model of van Veelen (2010) well. The and in AN2 are almost the same as in AN1. The main difference between AN1 and AN2 is that the conversion efficiency is increased to 0.5 in AN2 from 0.1 in AN1. Thus, the main reason for the discrepancy in the two numerical models is the difference in the conversion efficiency achieved in these simulations.
The conversion efficiency is a parameter which is still not well-constrained. It is usually assumed to be in the literature. The maximum conversion efficiency is because of the conservation of momentum. In the one-dimensional code STELLA, the conversion efficiency is artificially reduced. The motivation for the reduction in the code is that the multi-dimensional instabilities may initiate additional motion in the dense shell and more energy may remain as kinetic energy if the dimension is larger (Blinnikov et al. 1998; Moriya et al. 2013a). A recent multi-dimensional radiation hydrodynamics calculation of a pulsational pair-instability SN model of Woosley et al. (2007) by Chen et al. (2014) showed that the resulting luminosity is similar to that obtained by STELLA with the artificial reduction of the conversion efficiency. In the multi-dimensional simulations by van Veelen (2010), however, it is found that the Rayleigh-Taylor fingers formed by multi-dimensional instabilities make the density ahead of the shock higher and thus the luminosity is higher by a factor of 1.8 in the two-dimensional simulations. In summary, the artificial reduction in the conversion efficiency in STELLA and the larger effective conversion efficiency in multi-dimensional simulations by van Veelen (2010) due to the Rayleigh-Taylor fingers cause the difference in the conversion efficiency. We still do not know clearly how the multi-dimensionality affects the conversion efficiency. One possibility is that the conversion efficiency depends on the CSM density. The numerical simulations by Chen et al. (2014) are performed with the denser CSM than those in van Veelen (2010) which are closer to ours. In this case, the conversion efficiency may also be time dependent since the CSM density reduces as the shock propagates outward. Another possible reason for the difference is that the radiation is not coupled to hydrodynamics in the simulations by van Veelen (2010) while it is coupled in the simulations by Chen et al. (2014). The effect of the multi-dimensionality in SN IIn luminosity needs to be investigated more.
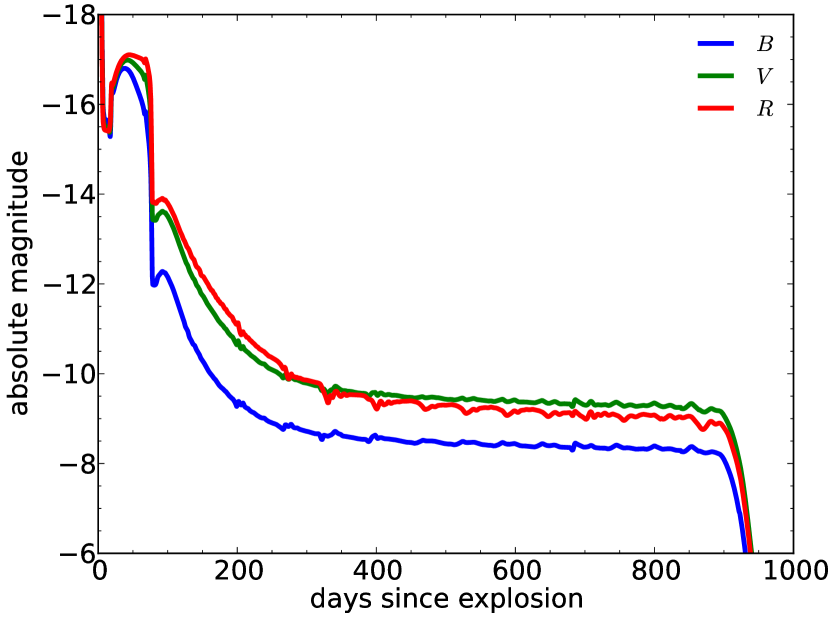
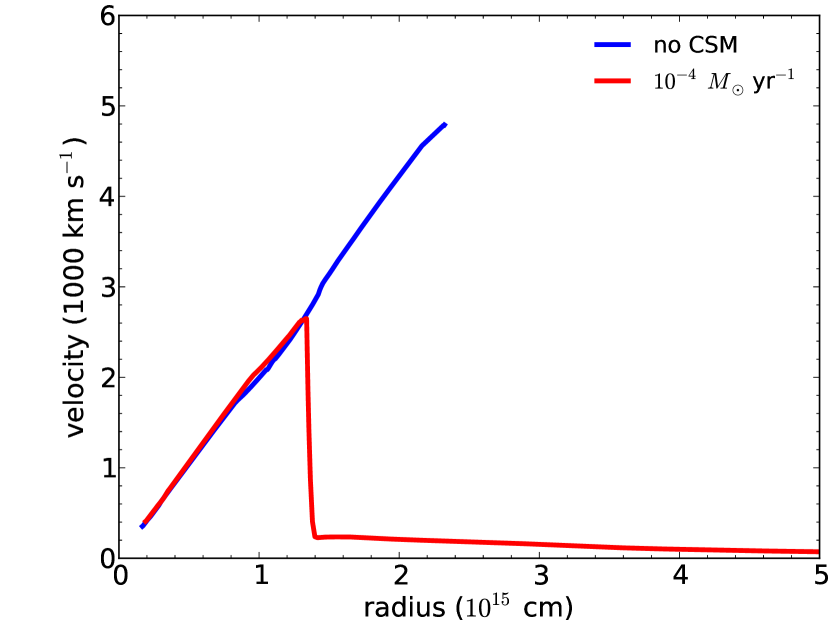
Fig. 3 shows the multicolor LC of our numerical model with . The evolution during the early plateau phase is consistent with those of SNe IIP. After the early plateau, the evolution of multicolor LCs is similar to each other but the magnitudes depend on the bands. The evolution of the optical LCs is similar to that of the bolometric LC in Fig. 1. This is because when the shock is radiation-dominated (when the ratio of the radiation pressure to the gas pressure is above ), the shock temperature does not become very high because of the large heat capacity of photons and optical photons are mainly emitted from the shock (Weaver, 1976; Blinnikov & Tolstov, 2011; Tolstov et al., 2013). Even when the shock is not radiation-dominated, the high-energy photons produced at the shock are efficiently thermalized due to the large CSM density and photons can be emitted in the optical wavelengths (cf. Chevalier & Irwin, 2012).
Finally, we show the velocity structures of the models with and without CSM in Fig. 4 at around the middle of the plateau phase ( days). The entire velocity in the model without CSM is homologous while only the unshocked SN ejecta is homologous in the model with CSM. The photosphere is located at cm in the no CSM model and it is located at cm in the model with the CSM. The photospheric velocity is almost the same in the two models. The model with CSM has the velocity drop at cm where the SN ejecta collides to the CSM. The material in SN ejecta which exists beyond this radius in the no CSM model is accumulated in the cold dense shell at cm in the model with CSM.
4 Comparison with observations
In this section, we compare our ecSN LC models presented in the previous section to the observations which may be related to ecSNe.
4.1 SN 1054 (Crab Nebula)
SN 1054 was a ‘guest star’ which is recorded mainly in Chinese and Japanese literature (see Stephenson & Green 2002 for a summary of the historical records). The proximity of the ‘guest star’ in the historical records to the Crab Nebula (M 1 or NGC 1952) was first pointed out by Lundmark (1921). The expansion of the Crab Nebula which was discovered by Lampland (1921); Duncan (1921) is consistent with the explosion occurring in 1054 (Hubble 1928; Rudie et al. 2008, but see also Trimble 1968; Wyckoff & Murray 1977; Nugent 1998). Thus, the Crab Nebula is quite likely the remnant of SN 1054.
The Crab Nebula is one of the best observed SN remnants (see Hester 2008; Davidson & Fesen 1985 for summaries). The observed chemical abundances (e.g., MacAlpine & Satterfield, 2008; Satterfield et al., 2012) suggest that the Crab Nebula is a remnant of an ecSN (e.g., Nomoto et al., 1982). In addition, the estimated small ejecta mass (, Fesen et al. 1997) and small kinetic energy ( erg, e.g., Frail et al. 1995; Smith 2013) match the theoretical predictions of ecSN properties (e.g., Nomoto et al., 1982; Kitaura et al., 2006; Burrows et al., 2007). The above properties of the Crab Nebula suggest that SN 1054 was likely an ecSN.
SN LCs are an important clue to investigate their progenitors. The LC of SN 1054 deduced from the ancient records (see below) has been extensively discussed by many authors (e.g., Minkowski, 1971; Chevalier, 1977; Wheeler, 1978). It has been argued that the LC of SN 1054 may be inconsistent with those expected from ecSNe. Sollerman et al. (2001) pointed out that the last observational record of SN 1054 is incompatible with the small amount of production expected in ecSNe. Recently, Smith (2013) suggested that the relatively high early luminosity of SN 1054 is hard to be explained by the small explosion energy expected for ecSNe. However, TBN13 showed that the small explosion energy is consistent with the early high luminosity of SN 1054 because of the progenitor’s large radius and the small H-rich envelope mass in ecSNe. Sollerman et al. (2001) proposed that the later high luminosity of SN 1054 was powered by energy input from the central pulsar or the CSM interaction. TBN13 took the energy input from the pulsar into account. They found that the energy input from the pulsar can potentially explain the late luminosity, although their model with one-group radiation transport predicted a lower luminosity. We here compare our ecSN LC models with super-AGB winds with that of SN 1054 to show that ecSN exploded within super-AGB winds can actually explain the LC properties of SN 1054.
In Fig. 5, we compare our LC models with the LC of SN 1054 deduced from the historical records. The recorded brightness of SN 1054 at three epochs which were observed with human eyes are adopted (Stephenson & Green, 2002):
-
1.
The ‘guest star’ appeared on AD 1054 July 4 (JD 2106219)111 The star was recorded to appear in late May in 1054 in Japanese literature (Meigetsuki) but it is likely that there is an error in the recorded month and the actual date is one month later which is consistent with the Chinese records (Stephenson & Green, 2002). and it was as bright as Venus ( mag).
-
2.
It was able to observe during the daytime for 23 days. Thus, the star was as bright as the sky in the daytime at 23 days since the discovery (JD 2106232), i.e., mag.
-
3.
It disappeared from the sky on AD 1056 April 6 (JD 2106858). We assume that SN 1054 became mag at this time.
The errors, especially in the magnitudes, are expected to be large. For example, the Japanese record reports that the star was as bright as Jupiter ( mag), rather than Venus (Stephenson & Green, 2002). We assign one magnitude error to the deduced magnitudes. The recorded date also has uncertainty. In addition, the star may not have been seen for a while because of the bad weather. Thus, we assign the error of 10 days in the recorded dates. The estimated observed magnitudes are corrected to the absolute ones with the distance of 2 kpc (Trimble, 1973; Davidson & Fesen, 1985) and the extinction of mag (Miller, 1973).

Our LC models show that the explosion of an ecSN within super-AGB wind can explain the major characteristics of SN 1054. As has already been shown by TBN13, the early high luminosity of SN 1054 can be explained by the ecSN model. Smith (2013) suggested that a confined dense shell is required to explain the early high luminosity of SN 1054 with a low energy explosion of ecSNe but this is not necessarily the case (TBN13). The early luminosity can be solely explained by ecSNe without any confined dense shell. No extreme mass loss of the super-AGB star shortly before the explosion is required.
An essential difference between our models and those of TBN13 is the existence of the super-AGB wind in our models. As was discussed by Sollerman et al. (2001), the late luminosity of SN 1054 requires about 0.06 of , which is incompatible with the expected small production of ecSNe ( ). TBN13 invoked the luminosity input from the central pulsar to explain the late high luminosity. Our models including the luminosity from the interaction with dense CSM whose existence is naturally expected in the explosion of super-AGB stars can explain the later luminosity of SN 1054 without invoking the energy input from the pulsar. This possibility was proposed already by Sollerman et al. (2001) and we confirmed it. Both the pulsar and interaction may contribute to the late time luminosity.
The difference in observational properties of the pulsar and interaction models appears in the spectra. The interaction is presumed to make SN 1054 Type IIn. The luminosity from the interaction dominates after the early plateau phase but the strong narrow emission lines may have made SN 1054 Type IIn from early on. Observations of light echoes may be able to distinguish them as was suggested by Smith (2013). However, detection of SN IIn spectra does not necessarily indicate that SN 1054 was powered by the interaction from the earliest time as is shown here.
A remaining concern about our LC models for SN 1054 is the final observational record. The final LC point is based on the Chinese record that the ‘guest star’ vanished at that epoch. However, the SN luminosity of our models stays constant. One can, of course, doubt the accuracy of the record and the luminosity may have stayed more or less similar for longer time. Another possible interpretation is that the shock had gone through the dense part of the CSM at this time and the LC declined suddenly as seen at around JD 2107000 in Fig. 5 in our models whose dense CSM radius is cm. The disappearance at JD 2106858 can be explained if the dense CSM only extends to cm. In this case, the super-AGB progenitor should have undergone the high mass-loss rate starting from 240 years before the explosion, assuming . This may be possible if the mass loss from super-AGB stars is related to many thermal pulses of He shell burning, thus being strongly time-dependent.
4.2 Type IIn supernovae with LC plateau (‘Type IIn-P’)
Some SNe IIn are known to be characterized by an early LC plateau followed by the sudden LC decline as seen in SNe IIP. They have been suggested to be related to ecSNe because of the low estimated mass (e.g., SN 1994W, Sollerman et al. 1998; SN 2009kn, Kankare et al. 2012; SN 2011ht, Mauerhan et al. 2013). This kind of SNe IIn is also called ‘Type IIn-P’ SNe by some authors because of the LC plateau (e.g., Mauerhan et al., 2013).
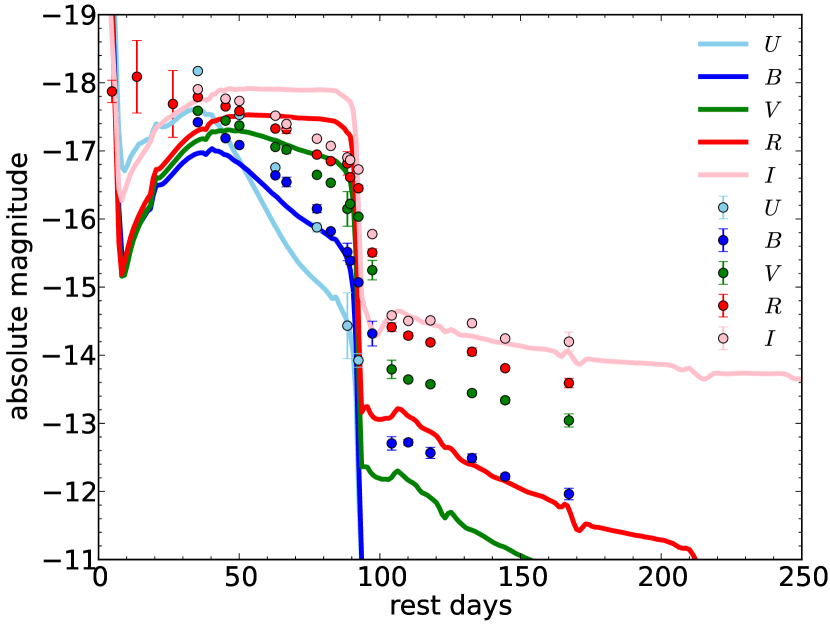
In Fig. 6, we compare the ecSN LC model interacting with a super-AGB wind with the LC of SN 2009kn (Kankare et al., 2012). The progenitor model is constructed by attaching the and wind on top of the and progenitor presented in TBN13. The explosion energy is increased to erg to match the plateau luminosity of SN 2009kn. The mass is the same as in the previous models ( ) for simplicity.
The overall LC properties of SN 2009kn are reproduced by the numerical model. The -band brightness of the first three observed epochs is higher than the numerical LC. However, the multicolor LCs of the later plateau phase are consistent with the observations. The luminosities after the plateau are lower than observed ones. This may indicate that the mass-loss rate of the progenitor was larger than and/or the wind velocity was smaller than .
For the LC drop after the plateau, two reasons have been suggested. (i) Chugai et al. (2004) suggested that the drop appears when the blast wave leaves the dense part of CSM. The major power input from the interaction terminates when the blast wave leaves the dense part of the CSM and the LC drop is observed. (ii) Dessart et al. (2009) related the drop to the recombination. Our model is close to the latter idea. In our model, however, the LC plateau is not related to the interaction as considered in Dessart et al. (2009), but caused by exactly the same reason as in SNe IIP, i.e., the recombination in the H-rich layers of the SN ejecta.
As the emission from the early phase is dominated by the emission from the SN ejecta, one may expect to see SN IIP spectral features in these epochs. However, the photospheric velocity during the plateau phase is as low as (Section 3 and Fig. 4). Thus, the spectral features from the SN ejecta can be strongly diluted by the intermediate narrow-line components usually observed in SNe IIn which typically have the width of . The dense shell may also smear out the spectral features from the SN ejecta.
One observational property of these SNe IIn which may not prefer our ecSN model is the observed velocities of the narrow P-Cygni profiles. The small velocities of the narrow P-Cygni profiles in SNe IIn are generally related to the wind velocity of the progenitors. The velocities of the narrow components in the SNe IIn with the LC plateau are typically (e.g., Chugai et al., 2004; Kankare et al., 2012; Mauerhan et al., 2013). This is inconsistent with the small wind velocities of the super-AGB wind. One possibility is that those features may come from the slowly-moving SN ejecta and there exist other unobserved much slower P-Cygni components in the spectra. In addition, the detailed line formation mechanisms of SNe IIn are not well-understood and the detailed spectral modeling is required to see if the super-AGB model is able to explain the spectral properties.
Finally, one of the SNe IIn with the LC plateau, SN 2011ht, is found to have brightened a year before the major luminosity increase in 2011 (Fraser et al., 2013). If SN 2011ht is associated with a super-AGB star, the pre-outburst could be related to the thermal pulses of He-shell burning in the super-AGB progenitor. Several possible pre-burst events have been reported (Ofek et al., 2014) and some of them may be related to the AGB activities.
4.3 Other supernovae
Other SNe IIn which have been suggested to be ecSNe are faint from early times. For example, the peak bolometric magnitude of SN 2008S was about mag ( erg, e.g., Botticella et al. 2009) and the progenitor was found to be around 10 (Prieto et al., 2008). Our LC models, however, predict that ecSNe are not faint at early times. One possible way to make the early ecSN LCs faint is to reduce the mass of H-rich envelope. Then, the early bright phase gets as short as those in SNe IIb and the subsequent luminosity is dominated by the interaction from early times because of the small 56Ni mass. The luminosities only from the interaction in our models are comparable to those of faint SNe IIn which have been suggested to be ecSNe like SN 2008S (Fig. 2). The H-rich envelope may become small enough depending on the amount of mass loss from the progenitors if they are single stars. ecSNe from binary stars can also lose large amount of mass due to the binary evolution (cf. Podsiadlowski et al., 2004). Without the super-AGB wind, faint SNe IIn, such as SN 2008S, may have been observed as SNe IIb from ecSNe with very small mass H-rich envelopes. In some cases, the SN IIb features may be observed at early times and ecSNe with little H-rich envelope may be observed as ‘Type IIn-b’.
X-ray observations of SNe IIn can play an important role to identify the SNe IIn of the ecSN origin. Although our ecSN LCs with the plateau phase are optically bright at early times, the high luminosity is not due to the interaction. This means that X-ray luminosities which are mainly from the interaction can be very low compared to other SNe IIn with similar optical luminosities which are powered mainly by the interaction in the optical range as well. For example, the X-ray luminosities of in keV at one year since the explosion is expected in our model with the formalism of Fransson et al. (1996). SN IIn 2005ip, which had a similar optical luminosity to our ecSN model at the early plateau (Stritzinger et al., 2012), had the X-ray luminosity of in keV at one year after the explosion (Katsuda et al., 2014). Thus, optically-bright but X-ray-faint SNe IIn can be promising candidates for ecSNe. However, if SN ejecta mass is small due to the mass loss or binary evolution, the luminosity from the interaction can be high (van Veelen 2010, see Eq. 2). In other words, the luminosities of ecSNe with little H-rich envelope would be dominated by the interaction from early times and their X-ray luminosities can be as bright as those expected from the optical luminosities. Then, the corresponding SNe IIn can also be X-ray bright for a long time as is observed in, e.g., SN 1988Z (van Veelen, 2010). Radio observations may also be used to trace the shock properties but the radio luminosity can be low because of the strong free-free absorption by the dense CSM (cf. Chevalier, 1998).
5 Conclusions
We performed numerical LC calculations of ecSNe exploding within super-AGB winds and obtained the following results. The early bolometric LCs at the plateau phase are not affected by the dense CSM and they are the same as those from the models without the dense CSM (TBN13). As is shown by TBN13, the early LCs of ecSNe can be as luminous as mag in the optical bands in spite of the small explosion energy ( erg) because of the large radius and the small H-rich envelope mass of super-AGB stars. The effect of the super-AGB CSM on the LCs starts to appear after the plateau phase. If there is no CSM, the LCs start to follow the 56Co decay () after the plateau. However, if there exists a dense CSM from the super-AGB stars, the interaction between the SN ejecta and the dense super-AGB CSM provides additional energy to illuminate ecSNe. The bolometric LCs decline much slower than the decay (, where is the outer density slope of SN ejecta, , with ).
SN 1054 (Crab Nebula) has been suggested to be an ecSN. However, several observational properties have been argued to be difficult to be explained by ecSNe. Sollerman et al. (2001) argued that the final observational record at days after the discovery indicates that SN 1054 was too bright to be an ecSN which does not produce enough 56Ni. We confirmed that the interaction with the dense CSM expected from the super-AGB stars can explain the last observational record. Smith (2013) argued that the early luminosity is also too bright to be ecSNe. However, it was shown by TBN13 as well as in this work that the luminosity is consistent with ecSNe.
We also compare our LC model to the LCs of a subclass of SNe IIn which show the LC plateau in the early phase (‘Type IIn-P’). We show that our LC model is consistent with them and suggest that they are ecSNe exploding within the dense super-AGB CSM. Faint SNe IIn can be ecSNe with the dense CSM but with little H-rich envelope. They may be observed as ‘Type IIn-b’.
We show that SNe IIn with the LC plateau from ecSNe can be bright in optical at early times even if the CSM is not dense enough to power the early optical luminosity by the interaction. Thus, their X-ray luminosities from the interaction can be faint in spite of the large optical luminosities in the SNe IIn. As a result, some ecSNe can be observed as optically-bright but X-ray-faint SNe IIn. Since the luminosities of ecSNe with little H-rich envelope are dominated by the interaction from early on, their X-ray luminosities can be as bright as those expected from the optical luminosities.
Acknowledgements.
TJM is supported by Japan Society for the Promotion of Science Postdoctoral Fellowships for Research Abroad (26·51). KN is supported by the Grant-in-Aid for Scientific Research (23224004, 23540262, 26400222) from the Japan Society for the Promotion of Science. Numerical computations were carried out on computers at Center for Computational Astrophysics, National Astronomical Observatory of Japan. This research is also supported by World Premier International Research Center Initiative (WPI Initiative), MEXT, Japan. The work in Russia was supported by RF Government grant 11.G34.31.0047, grants for supporting Scientific Schools 5440.2012.2 and 3205.2012.2, and joint RFBR-JSPS grant 13–02–92119.References
- Anderson et al. (2012) Anderson, J. P., Habergham, S. M., James, P. A., & Hamuy, M. 2012, MNRAS, 424, 1372
- Blinnikov et al. (1998) Blinnikov, S. I., Eastman, R., Bartunov, O. S., Popolitov, V. A., & Woosley, S. E. 1998, ApJ, 496, 454
- Blinnikov et al. (2006) Blinnikov, S. I., Röpke, F. K., Sorokina, E. I., et al. 2006, A&A, 453, 229
- Blinnikov & Tolstov (2011) Blinnikov, S. I., & Tolstov, A. G. 2011, Astronomy Letters, 37, 194
- Botticella et al. (2009) Botticella, M. T., Pastorello, A., Smartt, S. J., et al. 2009, MNRAS, 398, 1041
- Burrows et al. (2007) Burrows, A., Dessart, L., & Livne, E. 2007, Supernova 1987A: 20 Years After: Supernovae and Gamma-Ray Bursters, 937, 370
- Chen et al. (2014) Chen, K.-J., Woosley, S., Heger, A., Almgren, A., & Whalen, D. 2014, arXiv:1402.4134
- Chevalier (1977) Chevalier, R. A. 1977, Supernovae, 66, 53
- Chevalier (1998) Chevalier, R. A. 1998, ApJ, 499, 810
- Chevalier & Irwin (2012) Chevalier, R. A., & Irwin, C. M. 2012, ApJ, 747, L17
- Chugai et al. (2004) Chugai, N. N., Blinnikov, S. I., Cumming, R. J., et al. 2004, MNRAS, 352, 1213
- Davidson & Fesen (1985) Davidson, K., & Fesen, R. A. 1985, ARA&A, 23, 119
- Dessart et al. (2009) Dessart, L., Hillier, D. J., Gezari, S., Basa, S., & Matheson, T. 2009, MNRAS, 394, 21
- Duncan (1921) Duncan, J. C. 1921, Proceedings of the National Academy of Science, 7, 179
- Eldridge et al. (2006) Eldridge, J. J., Genet, F., Daigne, F., & Mochkovitch, R. 2006, MNRAS, 367, 186
- Fesen et al. (1997) Fesen, R. A., Shull, J. M., & Hurford, A. P. 1997, AJ, 113, 354
- Frail et al. (1995) Frail, D. A., Kassim, N. E., Cornwell, T. J., & Goss, W. M. 1995, ApJ, 454, L129
- Fransson et al. (2013) Fransson, C., Ergon, M., Challis, P. J., et al. 2013, arXiv:1312.6617
- Fransson et al. (1996) Fransson, C., Lundqvist, P., & Chevalier, R. A. 1996, ApJ, 461, 993
- Fraser et al. (2013) Fraser, M., Magee, M., Kotak, R., et al. 2013, ApJ, 779, L8
- Habergham et al. (2014) Habergham, S. M., Anderson, J. P., James, P. A., & Lyman, J. D. 2014, MNRAS, 441, 2230
- Hester (2008) Hester, J. J. 2008, ARA&A, 46, 127
- Hoffman et al. (2008) Hoffman, R. D., Müller, B., & Janka, H.-T. 2008, ApJ, 676, L127
- Hubble (1928) Hubble, E. P. 1928, Leaflet of the Astronomical Society of the Pacific, 1, 55
- Janka et al. (2008) Janka, H.-T., Müller, B., Kitaura, F. S., & Buras, R. 2008, A&A, 485, 199
- Jones et al. (2013) Jones, S., Hirschi, R., Nomoto, K., et al. 2013, ApJ, 772, 150
- Kankare et al. (2012) Kankare, E., Ergon, M., Bufano, F., et al. 2012, MNRAS, 424, 855
- Kasen & Woosley (2009) Kasen, D., & Woosley, S. E. 2009, ApJ, 703, 2205
- Katsuda et al. (2014) Katsuda, S., Maeda, K., Nozawa, T., Pooley, D., & Immler, S. 2014, ApJ, 780, 184
- Kawabata et al. (2010) Kawabata, K. S., Maeda, K., Nomoto, K., et al. 2010, Nature, 465, 326
- Kiewe et al. (2012) Kiewe, M., Gal-Yam, A., Arcavi, I., et al. 2012, ApJ, 744, 10
- Kitaura et al. (2006) Kitaura, F. S., Janka, H.-T., & Hillebrandt, W. 2006, A&A, 450, 345
- Lampland (1921) Lampland, C. O. 1921, PASP, 33, 79
- Langer (2012) Langer, N. 2012, ARA&A, 50, 107
- Lau et al. (2012) Lau, H. H. B., Gil-Pons, P., Doherty, C., & Lattanzio, J. 2012, A&A, 542, A1
- Lundmark (1921) Lundmark, K. 1921, PASP, 33, 225
- MacAlpine & Satterfield (2008) MacAlpine, G. M., & Satterfield, T. J. 2008, AJ, 136, 2152
- Mauerhan et al. (2013) Mauerhan, J. C., Smith, N., Silverman, J. M., et al. 2013, MNRAS, 431, 2599
- Miller (1973) Miller, J. S. 1973, ApJ, 180, L83
- Minkowski (1971) Minkowski, R. 1971, The Crab Nebula, 46, 241
- Miyaji & Nomoto (1987) Miyaji, S., & Nomoto, K. 1987, ApJ, 318, 307
- Miyaji et al. (1980) Miyaji, S., Nomoto, K., Yokoi, K., & Sugimoto, D. 1980, PASJ, 32, 303
- Moriya et al. (2013a) Moriya, T. J., Blinnikov, S. I., Tominaga, N., et al. 2013a, MNRAS, 428, 1020
- Moriya et al. (2014) Moriya, T. J., Maeda, K., Taddia, F., et al. 2014, MNRAS, 439, 2917
- Moriya et al. (2013b) Moriya, T. J., Maeda, K., Taddia, F., et al. 2013b, MNRAS, 435, 1520
- Moriya et al. (2011) Moriya, T., Tominaga, N., Blinnikov, S. I., Baklanov, P. V., & Sorokina, E. I. 2011, MNRAS, 415, 199
- Nomoto (1987) Nomoto, K. 1987, ApJ, 322, 206
- Nomoto (1985) Nomoto, K. 1985, The Crab Nebula and Related Supernova Remnants, ed. M.C. Kafatos & R.B.C. Henry (Cambridge University Press, London), p.97-113
- Nomoto (1984) Nomoto, K. 1984, ApJ, 277, 791
- Nomoto & Sugimoto (1972) Nomoto, K., & Sugimoto, D. 1972, Progress of Theoretical Physics, 48, 46
- Nomoto et al. (1982) Nomoto, K., Sugimoto, D., Sparks, W. M., et al. 1982, Nature, 299, 803
- Nugent (1998) Nugent, R. L. 1998, PASP, 110, 831
- Ofek et al. (2014) Ofek, E. O., Sullivan, M., Shaviv, N. J., et al. 2014, ApJ, 789, 104
- Poelarends et al. (2008) Poelarends, A. J. T., Herwig, F., Langer, N., & Heger, A. 2008, ApJ, 675, 614
- Podsiadlowski et al. (2004) Podsiadlowski, P., Langer, N., Poelarends, A. J. T., et al. 2004, ApJ, 612, 1044
- Prieto et al. (2008) Prieto, J. L., Kistler, M. D., Thompson, T. A., et al. 2008, ApJ, 681, L9
- Pumo et al. (2009) Pumo, M. L., Turatto, M., Botticella, M. T., et al. 2009, ApJ, 705, L138
- Rudie et al. (2008) Rudie, G. C., Fesen, R. A., & Yamada, T. 2008, MNRAS, 384, 1200
- Satterfield et al. (2012) Satterfield, T. J., Katz, A. M., Sibley, A. R., MacAlpine, G. M., & Uomoto, A. 2012, AJ, 144, 27
- Siess (2010) Siess, L. 2010, A&A, 512, A10
- Siess (2007) Siess, L. 2007, A&A, 476, 893
- Smith (2013) Smith, N. 2013, MNRAS, 434, 102
- Sollerman et al. (1998) Sollerman, J., Cumming, R. J., & Lundqvist, P. 1998, ApJ, 493, 933
- Sollerman et al. (2001) Sollerman, J., Kozma, C., & Lundqvist, P. 2001, A&A, 366, 197
- Stephenson & Green (2002) Stephenson, F. R., & Green, D. A. 2002, Historical supernovae and their remnants, by F. Richard Stephenson and David A. Green. International series in astronomy and astrophysics, vol. 5. Oxford: Clarendon Press, 2002, ISBN 0198507666, 5,
- Stritzinger et al. (2012) Stritzinger, M., Taddia, F., Fransson, C., et al. 2012, ApJ, 756, 173
- Taddia et al. (2013) Taddia, F., Stritzinger, M. D., Sollerman, J., et al. 2013, A&A, 555, A10
- Takahashi et al. (2013) Takahashi, K., Yoshida, T., & Umeda, H. 2013, ApJ, 771, 28
- Thompson et al. (2009) Thompson, T. A., Prieto, J. L., Stanek, K. Z., et al. 2009, ApJ, 705, 1364
- Tolstov et al. (2013) Tolstov, A. G., Blinnikov, S. I., & Nadyozhin, D. K. 2013, MNRAS, 429, 3181
- Tominaga et al. (2013) Tominaga, N., Blinnikov, S. I., & Nomoto, K. 2013, ApJ, 771, L12 (TBN13)
- Trimble (1973) Trimble, V. 1973, PASP, 85, 579
- Trimble (1968) Trimble, V. 1968, AJ, 73, 535
- van Marle et al. (2010) van Marle, A. J., Smith, N., Owocki, S. P., & van Veelen, B. 2010, MNRAS, 407, 2305
- van Veelen (2010) van Veelen, B. 2010, Ph.D. Thesis, Utrecht University, the Netherlands
- Vos (1978) Vos, J. J. 1978, Color Research & Application, 3, 125
- Wanajo et al. (2009) Wanajo, S., Nomoto, K., Janka, H.-T., Kitaura, F. S., Müller, B. 2009, ApJ, 695, 208
- Weaver (1976) Weaver, T. A. 1976, ApJS, 32, 233
- Wheeler (1978) Wheeler, J. C. 1978, ApJ, 225, 212
- Woosley et al. (2007) Woosley, S. E., Blinnikov, S., & Heger, A. 2007, Nature, 450, 390
- Wyckoff & Murray (1977) Wyckoff, S., & Murray, C. A. 1977, MNRAS, 180, 717
- Young (2004) Young, T. R. 2004, ApJ, 617, 1233