kxl014 \gridframeN \cropmarkY
Characterizing the folding core of the cyclophilin A — cyclosporin A complex I: hydrogen exchange data and rigidity analysis
Abstract
The determination of a “folding core” can help to provide insight into the structure, flexibility, mobility and dynamics, and hence, ultimately, function of a protein — a central concern of structural biology. Changes in the folding core upon ligand binding are of particular interest because they may be relevant to drug-induced functional changes. Cyclophilin A is a multi-functional ligand-binding protein and a significant drug target.
It acts principally as an enzyme during protein folding, but also as the primary binding partner for the immunosuppressant drug cyclosporin A (CsA).
Here, we have used hydrogen-deuterium exchange (HDX) NMR spectroscopy to determine the folding core of the CypA-CsA complex.
We also use the rapid computational tool of rigidity analysis, implemented in First, to determine a theoretical folding core of the complex.
In addition we generate a theoretical folding core for the unbound protein and compare this with previously published HDX data.
The First method gives a good prediction of the HDX folding core, but we find that it is not yet sufficiently sensitive to predict the effects of ligand binding on CypA.
, compiled *Correspondence: jack.heal@bristol.ac.uk
Address reprint requests to Jack Heal, University of Bristol, School of Chemistry, Cantock’s Close, Bristol, BS8 1TS, UK.
INTRODUCTION
The protein folding problem has been a prevalent question during the past years as the emerging protein structure crucially determines flexibility, mobility and, ultimately, function (1). The two principal competing theories on how protein folding initiates are diffusion-collision (2) and nucleation-condensation (3). Indeed, it may well be that both are valid depending on which protein is being investigated (4). Intuitively, residues which “collapse early during folding” (5), might be particularly important to the overall folding process and are usually referred to as defining a folding core. However, this set of residues is difficult to ascertain precisely. One way of defining a folding core experimentally is through -value analysis (6). This approach focuses on the folding process by using point mutations to determine the impact of particular residues on the energy of the transition state in a one-step folding process. An alternative is to study the dynamics of the folded structure through hydrogen-deuterium exchange (HDX) NMR experiments. For the examples of barnase and chymotrypsin inhibitor 2, it has been shown that the two definitions are consistent in that slowly exchanging residues in HDX have high -values (7).
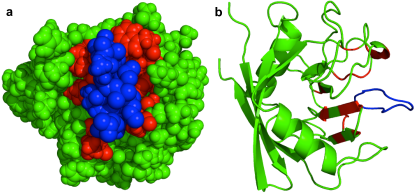
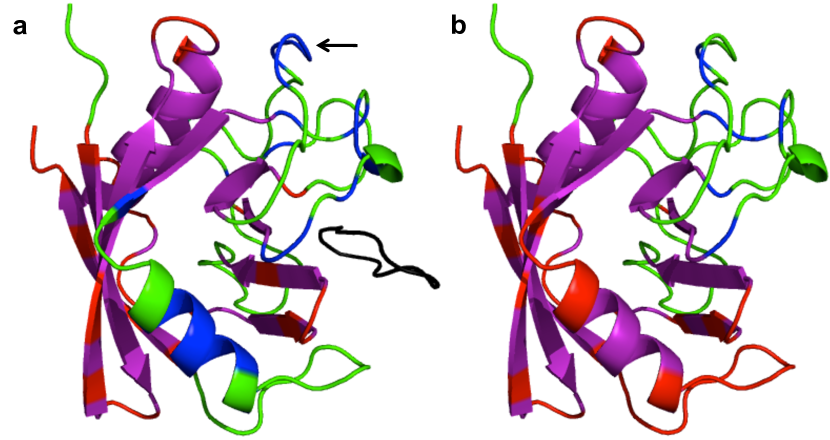
We have selected cyclophilin A (CypA), a multifunctional 18 kDa protein with 165 residues, as the basis protein for our study since it is large enough to exhibit complex folding behaviour while at the same time it is readily investigated by HDX. Furthermore, among the large class of ligand-binding proteins, it is known to bind strongly to the immunosuppressant drug cyclosporin A (CsA) (8, 9, 10), with dissociation constant nM (11). CypA acts as a peptidyl-prolyl cis-trans isomerase in addition to performing other roles when binding to different molecules such as the HIV-1 capsid protein (12, 13, 14). The structure of the CypA-CsA complex is shown in Figure 1 with the binding site residues highlighted (15).
Most commonly used to suppress organ rejection following a transplant, CsA has also been administered to treat ulcerative colitis, cardiac disease and a number of autoimmune diseases (17, 18, 19). It is the CypA-CsA complex which binds to and inhibits the T-cell activator calcineurin (CN) and thus has an immunosuppressant effect (20, 21).
Here, we experimentally study the HDX behaviour of unbound CypA and also its complex with CsA. Using these HDX data, we establish the resulting folding cores. Our results compare very well with previously published HDX data on unbound CypA (22) and also elucidate the effect of ligand binding in the CypA-CsA complex. NMR has been used to solve the structure of CypA (10) as well as the CypA-CsA complex (8, 9). HDX experiments on unbound CypA have previously been conducted (22) but the CypA-CsA complex has not previously been studied in this way.
Establishing folding cores through -value analysis or HDX provides valuable insight into protein folding and dynamics, but also involves extensive experimental work. For this reason, the prediction of HDX folding cores through rapid computational methods is of ongoing interest (4, 23, 24, 25, 26, 27). One method for predicting HDX folding cores uses rigidity analysis and is implemented in the First software package (4, 23). Having found the HDX folding core in our experiments, we next apply First to unbound CypA and to the CypA-CsA complex. We compare the resulting predicted folding cores with the HDX results.
MATERIALS AND METHODS
Protein expression and purification
A derivative of the pQE-70 plasmid encoding for human CypA was expressed in E. coli (JM109, New England BioLabs) grown at 37∘C in minimal medium containing 1 g/L (15NH4)2SO4 (Cambridge Isotope Laboratories). When the growth cultures reached an optical density of 0.5 at 600 nm, protein expression was induced with 1 mM isopropyl--D-thiogalactopyranoside (IPTG). Cells were harvested after overnight growth during which selection pressure was maintained by adding 0.1 mg/mL ampicilin. Cell pellets were resuspended in 20 mM 4-(2-hydroxyethyl)-1-piperazineethanesulfonic acid (HEPES) buffer at pH and then stored at C. Frozen cells were thawed, sonicated and then centrifuged, after which the resulting supernatant was loaded onto a 10 mL Source 30S column (from GE Healthcare) for cation exchange using 20 mM HEPES buffer at pH and a concentration gradient of mM NaCl. Eluted fractions of CypA were dialysed overnight against 10 mM ammonium acetate buffer at pH before being concentrated and lyophilised.
NMR assignment and HDX experiments
For sequential assignment, lyophilised protein was resuspended in NMR buffer containing mM NaH2PO4, mM Na2HPO4 and mM NaCl at pH . 2D [1H,15N] HSQC and 3D [1H, 15N, 1H] TOCSY-HSQC and NOESY-HSQC data were acquired on a Bruker AV III 600 spectrometer operating at MHz for 1H and 60.81 MHz for 15N. 2D data were acquired with scans, datapoints in F2 and increments in F1, and Fourier transformed with datapoints over spectral widths of ppm in the 1H dimension (F2) and ppm in the 15N dimension (F1). 3D data were acquired with or scans and datapoints in F3, F2 and F1, respectively, and transformed with datapoints. Spectral widths were ppm in the 1H dimensions (F3, F1), and ppm in the 15N dimension (F2). 2D HSQC data for the HDX experiments were acquired on a Bruker AV II 700 spectrometer, equipped with a TCI cryoprobe, operating at MHz for 1H and for 15N. The lyophilised protein was resuspended in NMR buffer as above, but made up in D2O (Sigma-Aldrich). For the CypA-CsA sample, each spectrum was acquired with four scans, points in F2, and increments in F1, and Fourier transformed with datapoints. The spectral widths were ppm and ppm in the 1H and 15N dimensions, respectively. In all cases, chemical shifts were referenced to the residual HDO peak (28). Data were acquired and processed using Topspin version 2.1 (Bruker) and analyzed using Sparky version 3.1 (29).
Rigidity analysis with First
Protein rigidity analysis is a computational method which rapidly identifies rigid and flexible regions in a protein crystal structure (30, 31). The structure is considered as a molecular framework in which bond lengths and angles are considered fixed while dihedral angles are permitted to vary. Atomic degrees of freedom are then matched against bonding constraints (32, 33, 34, 35, 36, 31, 37). Covalent bonds, polar interactions (including hydrogen bonds and salt bridges), and hydrophobic tethers can all be included as bonding constraints. The output of the algorithm is a division of the structure into rigid clusters and flexible regions, known as a rigid cluster decomposition (RCD). The RCD clearly depends on the constraints present in the bond network, the strength and location of which are determined solely from the geometry of the input structure. A systematic removal of hydrogen bonds in order from weakest to strongest leads to a loss in rigidity which we can relate to the unfolding of the protein (30). This is referred to as a rigidity dilution (RD). The pattern of rigidity loss can be used to gain insight into structural and functional properties of the protein (30, 38, 39). Indeed, RDs have previously been used to predict the HDX folding core for a number of proteins (4, 23) not including CypA.
The X-ray crystal structure 1CWA of the CypA-CsA complex was downloaded from the Protein Data Bank (PDB) (40). Crystal water molecules were removed before the reduce software (41) was used to add the hydrogen atoms and to flip side chains of Asn, Gln and His residues where necessary. For simulations of the unbound protein, CsA was deleted from the structure manually using PyMOL (16), which was used for all molecular visualization. We note that the unbound structure for CypA is highly similar to the bound structure. Indeed, the backbone of 1CWA aligns with a different structure of the unbound protein (1W8V) with an RMSD of 0.26 Å.
The strength of each hydrogen bond, measured in kcal/mol, was calculated as a function of the geometry of the donor, hydrogen and acceptor atoms using the highly distance- and angle-dependent Mayo potential (42, 38). Only hydrogen bonds with a bond energy more negative than the energy cutoff parameter are included in the network. During an RD, is lowered causing some hydrogen bonds to be excluded from the network. Rigidity dilution involves systematically lowering and re-evaluating the RCD. Rigidity analysis was conducted using First version 6.1 (43).
RESULTS AND DISCUSSION
Characterization of CypA and sequential assignment
Purified recombinant CypA was characterized using mass spectrometry and circular dichroism spectroscopy, confirming that the protein had the correct mass and secondary structure (Supporting Material). When CypA binds to CsA, the change in environment of the Trp121 residue results in enhanced fluorescence (with an excitation wavelength of 290 nm and a peak of emission at 340 nm) (44, 45). We observed enhanced fluorescence during a titration of CsA into CypA, which plateaued at a 1:1 concentration ratio (Supporting Material). This confirmed ligand binding.
Employing 3D TOCSY- and NOESY-HSQC data, and with the aid of previously published assignments for the CypA-CsA complex under different conditions (8, 10), we have assigned 147 of the 159 non-proline residues of the protein in its unbound state as well as in complex with CsA.
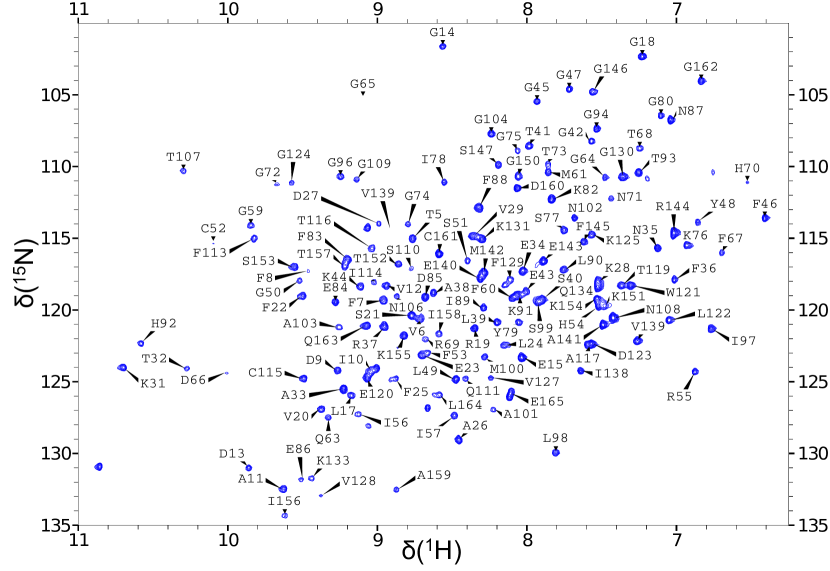
The unassigned residues include residues – , which make up the flexible N-terminus. In Figure 2, we show the assigned HSQC spectrum for the CypA-CsA complex. Full lists of backbone N-H assignments for this spectrum and for the unbound protein can be found in the Supporting Material.
The HDX folding cores
Figure 3 shows the HSQC spectrum of the CypA-CsA complex alongside spectra recorded 10, 110 and 4270 minutes (71 hours and 10 minutes) after initiating HDX.
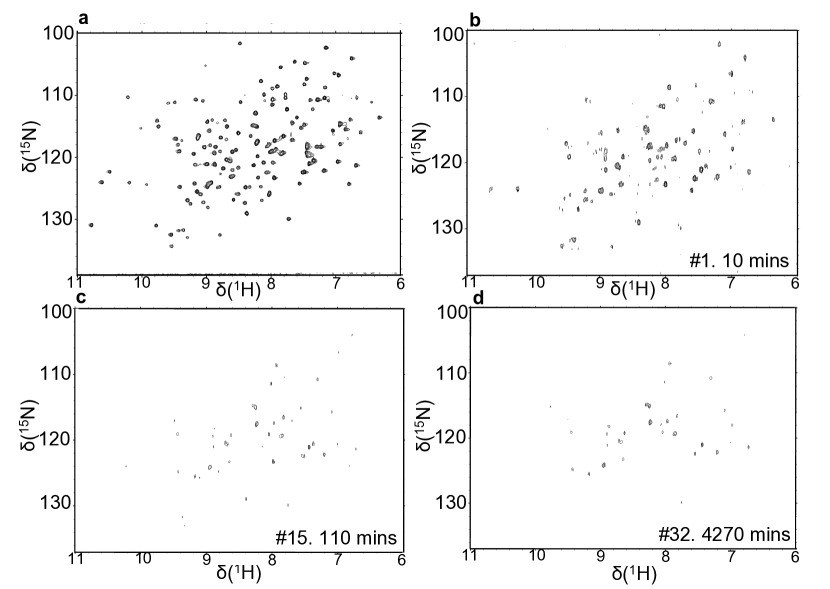
We define the set of residues for which a corresponding backbone amide signal remains in the HSQC spectrum after minutes to be the experimentally determined HDX folding core of the complex. These residues are listed in Table 1 and also indicated in Figure 4 (a) and (b).
The published HDX experiments on unbound CypA resulted in a classification of CypA residues in terms of their exchange rates, (22). Twelve residues, including the proline residues, were not categorized since they were not identified in the HSQC spectrum. We also carried out HDX experiments on the unbound protein, and our data, shown in the Supporting Material, were in agreement with the previously published result (22).
Here we have drawn on the exchange rates determined in (22) and defined the residues with min-1 as the folding core of the unbound protein, a definition congruent with that applied to our dataset for the CypA-CsA complex (see above). According to this approach, the HDX folding core for unbound CypA has residues.
| CypA-CsA HDX folding core residues |
| V6, F7, F8, D9, I10, A11, V12, E15, L17, V20, S21, F22, E23, L24, F25, A26, V29, K31, T32, A33, E34, N35, F36, R37, A38, L39, S40, T41, Y48, S51, F53, H54, R55, I57, F60, M61, Q63, G64, K76, I78, E86, N87, F88, I89, L90, G96, I97, L98, S99, M100, N108, F112, F113, I114, C115, T116, A117, T119, L122, D123, K125, V127, V128, F129, G130, K131, V132, K133, I138, V139, E140, A141, M142, E143, F145, T157, A159, D160, G162 |
We find that the HDX folding core does not change dramatically upon ligand binding. Its size increases from to residues. This is due to the ten residues, highlighted in Table 1, which are slowly exchanging in the presence of the CsA ligand but not part of the HDX folding core for unbound CypA. However, there are also three assigned residues — G18, A101 and I158 — which are part of the ’unbound’ folding core of (22) but are no longer part of the ’bound’ folding core. This slight increase in folding core size is consistent with the expectation that the presence of a ligand is likely to shield certain residues from the surface of the protein. Eight of the highlighted residues belong to flexible regions which are proximal to the binding site. Hence those changes are consistent with a restricted flexibility of the unstructured regions near the binding site in the presence of the ligand. The other two residues in the set, S21 and H54, are located in -strands. We note that these residues are surrounded by folding core residues (V20, F22, F53, R55) and so it is somewhat unexpected that these are not part of the folding core for the unbound protein. That they vanish earlier than expected from the HDX experiments on the unbound protein may be due to the inherent low signal intensity in these experiments.
The First folding cores
We then simulated RDs by systematically lowering , i.e. removing the hydrogen bonds in order of strength from weakest to strongest (38). We used First to generate an RCD each time a hydrogen bond was removed. In a 1D representation of an RCD, each residue in the primary structure is labelled as being rigid or flexible depending on the rigidity of its Cα atom. We show rigid residues as blocks which are colored according to their rigid cluster membership.
We visualize the pattern of rigidity loss during RDs by plotting the 1D representation of the RCD each time this changes. Such plots for the CypA-CsA complex and the unbound CypA are given in Figure 5. When is small, the protein is largely rigid and many of the residues are represented as blocks. As becomes more negative, i.e. as stronger bonds are excluded from the bond network, more residues become flexible.
In both of the RD plots there is a clear and abrupt transition from the largely rigid state to the largely flexible state, consistent with the first-order rigidity loss expected for a predominantly -sheet protein (38). The lowest line in the RD plot where at least three residues of two or more secondary structures (as determined using the DSSP algorithm (46)) are part of the same rigid cluster determines the First folding core (4, 23, 47, 48). We refer to the corresponding to this line as the folding core energy, . For unbound CypA, = kcal/mol and for the CypA-CsA complex, = kcal/mol. That the CypA-CsA complex has a lower suggests that ligand binding confers stability on the complex, as more bonds need to be broken in order to render the protein mostly flexible (48). The residues that are mutually rigid in the RCD evaluated at , colored red in Figure 5, form the First folding core.
Comparison of First and HDX folding cores
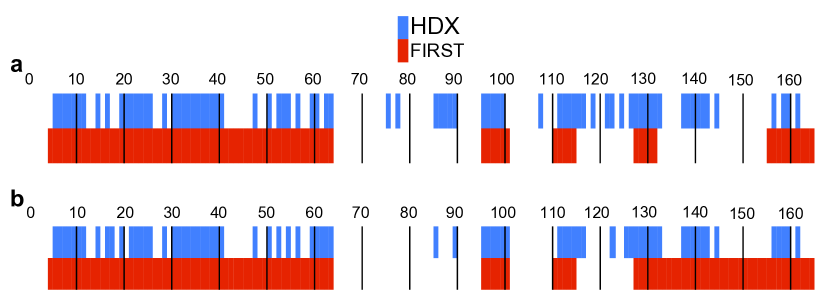
Figure 4 allows us to compare the HDX and First folding cores along the primary structure of the CypA-CsA complex and unbound CypA. Residues which form part of the folding cores are represented as colored blocks. In both cases, the First folding cores largely overlap with the HDX folding cores. The small changes which do occur upon ligand binding in the HDX folding cores are not very well captured in the two First folding cores. Rather, these differ only between residues and , whereas the HDX folding cores remain largely unaffected in this region. Notably, the First folding core for the CypA-CsA complex is smaller than for the unbound protein. This contrasts with our expectation and experimental finding as given above, where we show that the HDX folding core increases in size upon ligand binding. This highlights a problem with a theoretical method that only uses First. Ligand binding to the surface of CypA causes the binding site residues to become buried where before they were exposed, which may affect their HDX exchange rates. This effect is not modelled in First, where we merely consider the hydrogen bond network of the initial, static crystal structure.
In Figure 6 the HDX and First folding cores are shown superimposed onto the structure 1CWA before and after the removal of the ligand. We see that despite the issues addressed above, theoretically and experimentally determined folding cores agree reasonably well for most of the residues. The helix in the foreground of each image shows a marked difference when the ligand is removed, caused by the difference in First folding core between residues 133 and 155. Residues 87 – 89 form part of the loop indicated by the arrow in Figure 6(a), and are only part of the HDX folding core in the presence of CsA.
CONCLUSION
The experimental HDX folding core for the CypA-CsA complex is highly similar to the folding core for the unbound protein, albeit with a small number of additional residues. This small change is consistent with previous observations of only subtle conformational change in CypA upon ligand binding (49, 10). The First folding cores differ more substantially. Ligand binding confers rigidity upon the structure but alters the pattern of rigidity loss so that the First folding core in fact decreases in size. In both cases, the First folding core is a reasonable match for the HDX folding core, in agreement with previous folding core predictions using First (4). The First folding core is defined by the RCD at , a value which decreases upon ligand binding. This means that when the folding cores are compared for the protein before and after ligand removal, we are comparing RCDs at different . As a result there may be more constraints present in the unbound protein than for the complex, resulting in the unlikely prediction of a larger folding core in the absence of a ligand. First is a rapid tool to implement and this study complements previous studies which demonstrate its utility for folding core prediction (4, 23, 47, 48). Nevertheless, our work also shows that the First-based folding core predictions are not yet accurate or sensitive enough to capture the impact of ligand binding for CypA. For the purpose of predicting subtle effects of ligand binding, just analyzing patterns of rigidity as done through First appears insufficient. The trade-off between, on one hand, rapid computation as achieved with First and, on the other hand, the necessary accuracy of folding core prediction needs to be more finely balanced. In the related Ref. (50), we show that when taking into account not only the rigidity of a protein, but also its propensity for motion, improved theoretical predictions for folding cores can be made with greater sensitivity and specificity.
ACKNOWLEDGMENTS
We thank S.A. Wells for help with the modeling aspects of this work. The CypA plasmid was kindly provided by G. Fischer from the Max Planck Research Unit for Enzymology of Protein Folding in Halle, Germany. We gratefully acknowledge funding from the EPSRC Life Sciences Interface programme (MOAC DTC EP/F500378/1). JWH thanks the Institute of Advanced Study for its support in the form of an Early Career Fellowship.
References
- Dill and MacCallum (2012) Dill, K. A., and J. L. MacCallum, 2012. The protein-folding problem, 50 years on. Science 338:1042–1046.
- Karplus and Weaver (1994) Karplus, M., and D. L. Weaver, 1994. Protein folding dynamics: the diffusion-collision model and experimental data. Prot. Sci. 3:650–668.
- Itzhaki et al. (1995) Itzhaki, L. S., D. E. Otzen, and A. R. Fersht, 1995. Mechanism for The structure of the transition state for folding of chymotrypsin inhibitor 2 analysed by protein engineering methods: evidence for a nucleation-condensation mechanism for protein folding. J. Mol. Biol. 254:260–288.
- Hespenheide et al. (2002) Hespenheide, B. M., A. J. Rader, M. F. Thorpe, and L. A. Kuhn, 2002. Identifying Protein Folding Cores: Observing the Evolution of Rigid and Flexible Regions during Unfolding. J. Mol. Graph. & Model. 21:195–207.
- Woodward (1993) Woodward, C., 1993. Is the slow-exchange core the protein folding core? Trends Biochem. Sci. 18:359–360.
- Fersht et al. (1992) Fersht, A. R., A. Matouschek, and L. Serrano, 1992. The folding of an enzyme: 1. Theory of protein engineering analysis of stability and pathway of protein folding. J. Mol. Biol. 224:771–782.
- Li and Woodward (1999) Li, R., and C. Woodward, 1999. The hydrogen exchange core and protein folding. Prot. Sci. 8:1571–1591.
- Neri et al. (1991) Neri, P., R. Meadows, G. Gemmecker, E. Olejniczak, D. Nettesheim, T. Logan, R. Simmer, R. Helfrich, T. Holzman, J. Severin, and S. Fesik, 1991. 1H, 13C and 15N backbone assignments of cyclophilin when bound to cyclosporin A (CsA) and preliminary structural characterization of the CsA binding site. FEBS J. 294:81–88.
- Spitzfaden et al. (1994) Spitzfaden, C., W. Braun, G. Wider, H. Widmer, and K. Wthrich, 1994. Determination of the NMR solution structure of the cyclophilin A-cyclosporin A complex. J. Biomol. NMR 4:463–482.
- Ottiger et al. (1997) Ottiger, M., O. Zerbe, P. Güntert, and K. Wütrich, 1997. The NMR solution conformation of unligated human cyclophilin A. J. Mol. Biol. 272:64–81.
- Liu et al. (1990) Liu, J., M. W. Albers, C. Chen, S. L. Schreiber, and C. T. Walsh, 1990. Cloning, expression, and purification of human cyclophilin in Escherichia coli and assessment of the catalytic role of cysteines by site-directed mutagenesis. P. Natl. A. Sci. USA 87:2304–2308.
- Luban et al. (1993) Luban, J., K. L. Bossolt, E. K. Franke, G. V. Kalpana, and S. P. Goff, 1993. Human immunodeficiency virus type 1 gag protein binds to cyclophilins A and B. Cell 73:1067–1078.
- Bosco and Kern (2004) Bosco, D. A., and D. Kern, 2004. Catalysis and binding of cyclophilin A with different HIV-1 capsid constructs. Biochem. 43:6110–6119.
- Wang and Heitman (2005) Wang, P., and J. Heitman, 2005. The cyclophilins. Genome Biol. 6:226.
- Rader and Brown (2011) Rader, A. J., and S. M. Brown, 2011. Correlating allostery with rigidity. Mol. Biosyst. 7:464–471.
- Schrödinger, LLC (2013) Schrödinger, LLC, 2013. The PyMOL Molecular Graphics System, Version 1.3r1. http://www.pymol.org/, pyMOL.
- Nussenblatt and Palestine (1986) Nussenblatt, R. B., and A. G. Palestine, 1986. Cyclosporine: immunology, pharmacology and therapeutic uses. Surv. Ophthalmol. 31:159–169.
- Lichtiger et al. (1994) Lichtiger, S., D. H. Present, A. Kornbluth, I. Gelernt, J. Bauer, G. Galler, F. Michelassi, and S. Hanauer, 1994. Cyclosporine in severe uclerative coliltis refractory to steroid therapy. New. Eng. J. Med. 330:1841–1845.
- Mott et al. (2004) Mott, J. L., D. Zhang, J. C. Freeman, P. Mikolajczak, S. W. Chang, and H. P. Zassenhaus, 2004. Cardiac disease due to random mitochondrial DNA mutations is prevented by cyclosporin A. Biochem. Bioph. Res. Co. 319:1210–1215.
- Zydowsky et al. (1992) Zydowsky, L. D., F. A. Etzkorn, H. Y. Chang, S. B. Ferguson, L. A. Stolz, S. I. Ho, and C. T. Walsh, 1992. Active site mutants of human cyclophilin A separate peptidyl-prolyl isomerase activity from cyclosporin A binding and calcineurin inhibition. Prot. Sci. 1:1092–1099.
- Liu et al. (2006) Liu, Y., J. Jiang, P. L. Richardson, and R. D. Reddy, 2006. A fluorescence polarization-based assay for peptidyl prolyl cis/trans isomerase cyclophilin A. Anal. Biochem. 356:100–107.
- Shi et al. (2006) Shi, Y.-H., D.-H. Lin, J.-Y. Huang, and X. Shen, 2006. Study of stability of cyclophilin A by NMR and circular dichroism spectra. Chinese J. Chem. 24:973–979.
- Rader and Bahar (2004) Rader, A. J., and I. Bahar, 2004. Folding core predictions from network models of proteins. Polymer 45:659–668.
- Tartaglia et al. (2007) Tartaglia, G. G., A. Cavalli, and M. Vendruscolo, 2007. Prediction of Local Structural Stabilities of Proteins from Their Amino Acid Sequences. Structure 15:139–143.
- Liu et al. (2011) Liu, T., D. Pantazatos, S. L. ans Y. Hamuro, V. J. Hilser, and V. L. Woods Jr., 2011. Quantitative Assessment of Protein Structural Models by Comparison of H/D Exchange MS Data with Exchange Behavior Accurately Predicted by DXCOREX. Am. Soc. Mass Spectrom. 23:43–56.
- Lobanov et al. (2013) Lobanov, M. Y., M. Y. Suvorina, N. V. Dovidchenko, I. V. Sokolovskiy, A. K. Surin, and O. V. Galzitskaya, 2013. A novel web server predicts amino acid residue protection against hydrogen-deuterium exchange. Bioinformatics 29:1375–1381.
- Thomas et al. (2013) Thomas, S., L. Tapia, C. Ekenna, H.-Y. Yeh, and N. M. Amato, 2013. Rigidity analysis for protein motion and folding core identification. Paper from the AAAI 2013 Workshop.
- Wishart et al. (1995) Wishart, D. S., C. G. Bigam, J. Yao, F. Abildgaard, H. J. Dyson, E. Oldfield, J. L. Markley, and B. D. Sykes, 1995. 1H, 13C and 15N chemical shift referencing in biomolecular NMR. J. Biomol. NMR 6:135–140.
- (29) Goddard, T. D., and D. G. Kneller. SPARKY 3. University of California, San Francisco.
- Rader et al. (1999) Rader, A. J., B. M. Hespenheide, L. A. Kuhn, and M. F. Thorpe, 1999. Protein unfolding: rigidity lost. P. Natl. A. Sci. USA 99:3540–3545.
- Jacobs et al. (2001) Jacobs, D., A. Rader, L. Kuhn, and M. Thorpe, 2001. Protein flexibility predictions using graph theory. Prot: Struct. Func. Gen. 44:150–165.
- Jacobs and Thorpe (1995) Jacobs, D. J., and M. F. Thorpe, 1995. Generic Rigidity Percolation: The Pebble Game. Phys. Rev. Lett. 75:4051–4054.
- Jacobs and Hendrickson (1997) Jacobs, D. J., and B. Hendrickson, 1997. An algorithm for two-dimensional rigidity percolation: the pebble game. J. Comp. Biol. 137:346–365.
- Jacobs (1998) Jacobs, D. J., 1998. Generic rigidity in three-dimensional bond-bending networks. J. Phys. A: Math. Gen. 31:6653–6668.
- Jacobs et al. (1999) Jacobs, D. J., L. A. Kuhn, and M. F. Thorpe, 1999. Flexible and rigid regions in proteins. Rigidity Theory and Applications .
- Thorpe et al. (2000) Thorpe, M. F., B. M. Hespenheide, Y. Yang, and L. A. Kuhn, 2000. Flexibility and Critical Hydrogen Bonds in Cytochrome c. Pac. Symp. Biocomput. 191–202.
- Hespenheide et al. (2004) Hespenheide, B. M., D. J. Jacobs, and M. Thorpe, 2004. Structural rigidity and the capsid assembly of cowpea chlorotic mottle virus. J. Phys.: Condens. Matter 16:S5055–S5064.
- Wells et al. (2009) Wells, S., J. Jimenez-Roldan, and R. Römer, 2009. Comparative analysis of rigidity across protein families. Phys. Biol. 6:046005–11.
- Heal et al. (2012) Heal, J. W., J. E. Jimenez-Roldan, S. A. Wells, R. B. Freedman, and R. A. Römer, 2012. Inhibition of HIV-1 protease: the rigidity perspective. Bioinformatics 28:350–357.
- The Protein Data Bank (2013) The Protein Data Bank, 2013. http://www.rcsb.org/pdb/.
- Word et al. (1999) Word, J. M., S. C. Lovell, J. S. Richardson, and D. C. Richardson, 1999. Asparagine and Glutamine: Using Hydrogen Atoms Contacts in the Choice of Side-Chain Amide Orientation. J. Mol. Biol. 285:1735–1747.
- Dahiyat et al. (1997) Dahiyat, B. I., D. B. Gordon, and S. L. Mayo, 1997. Automated Design of the Surface Positions of Protein Helices. Prot. Sci. 6:1333–1337.
- Flexweb (2013) Flexweb, 2013. Analysis of Flexibility in Biomolecules and Networks. http://flexweb.asu.edu/software/first/.
- Husi and Zurini (1994) Husi, H., and M. G. M. Zurini, 1994. Comparative binding studies of cyclophilins to cycosporin A and derivatives by fluorescence measurements. Anal. Biochem. 222:251–255.
- Gastmans et al. (1999) Gastmans, M., G. Volckaert, and Y. Engelborghs, 1999. Tryptophan microstate reshuffling upon the binding of cyclosporin A to human cyclophilin A. Prot: Struct. Func. Gen. 35:464–474.
- Kabsch and Sander (1983) Kabsch, W., and C. Sander, 1983. Dictionary of protein secondary structure: pattern recognition of hydrogen-bonded and geometrical features. Biopolymers 22:2577–2637.
- Rader et al. (2004) Rader, A. J., G. Anderson, B. Isin, H. G. Khorana, I. Bahar, and J. Klein-Seetharaman, 2004. Identification of core amino acids stabilizing rhodopsin. Proc. Nat. Acad. Sci. 101:7246–7252.
- Tastan et al. (2007) Tastan, O., E. Yu, M. Ganapathiraju, A. Aref, A. J. Rader, and J. Klein-Seetharaman, 2007. Comparison of Stability Predictions and Simulated Unfolding of Rhodopsin Structures. Photochem. and Photobiol. 83:351–362.
- Fanghänel and Fischer (2003) Fanghänel, J., and G. Fischer, 2003. Thermodynamic characterization of the interaction of human cyclophilin 18 with cyclosporin A. Biophys. Chem. 100:351–366.
- Heal et al. (2014) Heal, J. W., S. A. Wells, R. B. Freedman, and R. A. Römer, 2014. Characterising the folding core of the cyclophilin A – cyclosporin A complex II: improving folding core predictions by including mobility. bpj Submitted.
Supporting Material
Characterizing the folding core of the cyclophilin A — cyclosporin A complex I: hydrogen exchange data and rigidity analysis
J. W. Heal, R. A. Römer, C. A. Blindauer and R. B. Freedman
1 Mass spectrometry and circular dichroism spectroscopy
To estimate the secondary structure composition for purified CypA in order to verify that it was correctly folded, the far-UV CD spectrum of CypA was measured at 25∘C using a Jasco J-815 CD spectropolarimeter. The resulting spectrum is shown in Figure S1.
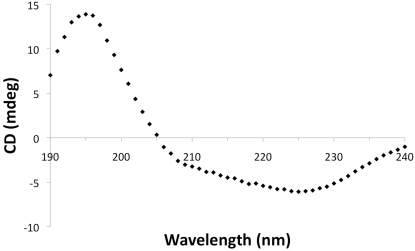
CD spectra were recorded for protein samples of 0.1 mg/mL in 5 mM sodium phosphate, pH 7.3 unless otherwise stated. Small volumes of concentrated purified protein were diluted in sodium phosphate buffer and the resulting concentration confirmed by measuring . Data points were collected during far-UV scans between 180 nm and 260 nm at 1 nm intervals. A baseline spectrum was recorded in the same way for a sample containing buffer only. To generate Figure S1, 16 scans were collected at 100 nm/min in continuous scanning mode, and the average CD signal minus the average baseline signal was plotted. We show the data collected between 190 nm and 240 nm at 1 nm intervals. The data was analysed with Dichroweb, using the reference database SP175 to calculate the proportional secondary structure composition of CypA. Our protein sample was determined to be 18 helix and 33 sheet. We compared this with the results of the DSSP algorithm applied to five X-ray crystal structures in the PDB. The average composition of these structures was 13 -helix and 32 -sheet.
2 Fluorescence
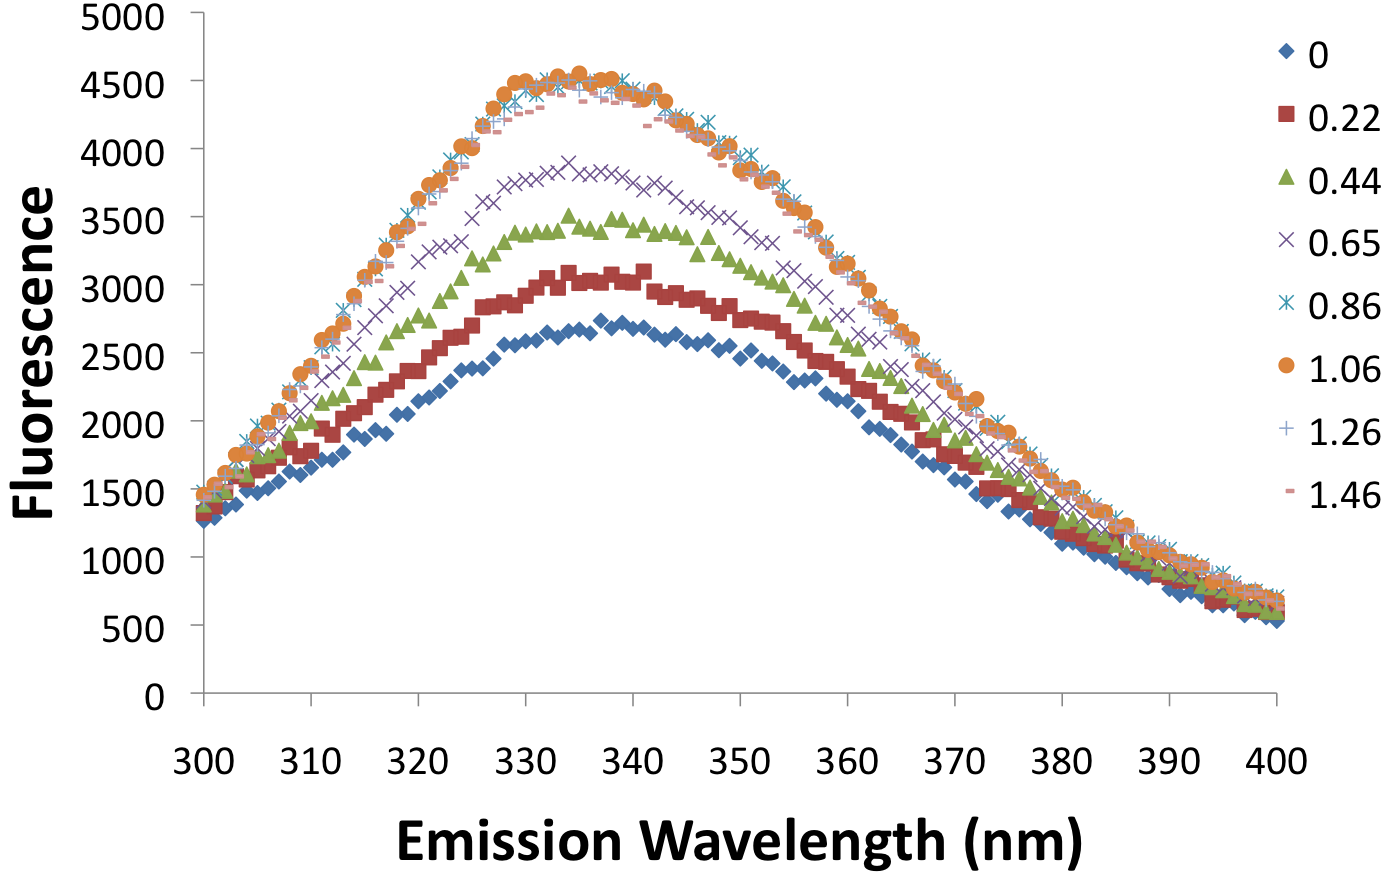
When CsA binds to CypA, Trp121 becomes shielded from the solvent and its fluorescence increases as a result (11, 44). CsA was titrated into a solution of CypA and fluorescence spectroscopy was used to monitor the change in tryptophan fluorescence. The experiment was conducted using a Photon Technology International fluorimeter. A stock solution of CypA (65 M) was diluted 1 mL in 50 mM TRIS buffer at pH 7.3 so that the final CypA concentration was 4.5 M. CsA was stored in ethanol at a concentration of 1.0 mM. A stock solution of 0.1 mM CsA for the titration was made by diluting this ten-fold in TRIS buffer. Each titre consisted of 10 L of CsA stock, and so increased the total concentration of CsA in the fluorescence sample by approximately 1 M. After each increment in [CsA] the sample was mixed using a pipette. The emission spectra were recorded at 1 nm intervals between 300 nm and 400 nm, using an excitation wavelength of 290 nm. The average fluorescence emission of three scans was recorded for each wavelength, using a slit width of 2 nm. Two baselines were recorded, for samples containing TRIS buffer only and 5 M CsA in TRIS buffer. There was no significant difference between the baselines (data not shown). Baseline adjusted fluorescence emission spectra for CypA with various concentrations of CsA are shown in Figure S2. The key shows the concentration fraction [CsA]/[CypA]. We observe a steady increase in fluorescence with increasing [CsA] until [CsA]/[CypA] = 1. After this point is reached, adding more CsA does not enhance fluorescence.
3 HDX results for unbound CypA
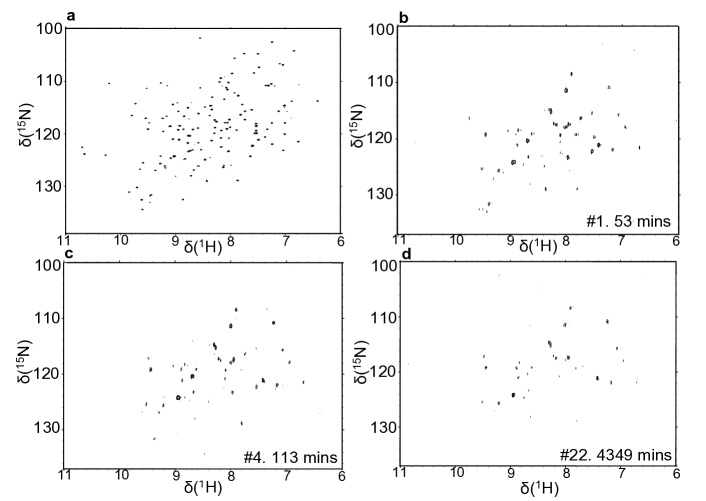
For unbound CypA, we increased the number of scans recorded for each spectrum from 4 to 16 in response to a lower yield in order to maximise the signal to noise ratio. The earliest usable HSQC spectrum was completed 53 minutes after adding D2O to the protein sample, and the subsequent spectra were therefore recorded less frequently than with the CypA-CsA experiments. Figure S3 shows the full HSQC spectrum, along with spectra taken at different time intervals following the initiation of HDX. Spectrum numbers 1, 4 and 22 are shown, recorded after 53, 113 and 4349 minutes respectively.
4 N-H assignment tables
Table LABEL:tab:assign gives the chemical shift assignments for each residue of unbound protein as well as the CypA-CsA complex.
| Residue | CypA only | CypA-CsA | Residue | CypA only | CypA-CsA | ||||
| 1H | 15N | 1H | 15N | 1H | 15N | 1H | 15N | ||
| Thr5 | 8.78 | 115.02 | 8.76 | 115.03 | Glu86 | 9.45 | 131.63 | 9.51 | 131.82 |
| Val6 | 8.74 | 120.4 | 8.71 | 120.65 | Asn87 | 7.05 | 106.84 | 7.04 | 106.78 |
| Phe7 | 8.95 | 119.23 | 8.96 | 119.34 | Phe88 | 8.33 | 113.02 | 8.32 | 112.9 |
| Phe8 | 9.55 | 117.03 | 9.56 | 117.01 | Ile89 | 8.3 | 119.89 | 8.29 | 119.85 |
| Asp9 | 9.27 | 124.24 | 9.27 | 124.22 | Leu90 | 7.74 | 117.28 | 7.75 | 117.2 |
| Ile10 | 9.03 | 124.31 | 9.04 | 124.27 | Lys91 | 8.07 | 119.05 | 8.07 | 119 |
| Ala11 | 9.62 | 132.57 | 9.63 | 132.48 | His92 | 10.7 | 122.57 | 10.58 | 122.33 |
| Val12 | 8.93 | 118.47 | 8.94 | 118.31 | Thr93 | 7.26 | 110.48 | 7.25 | 110.42 |
| Asp13 | 9.85 | 131.09 | 9.86 | 131 | Gly94 | 7.48 | 107.31 | 7.53 | 107.37 |
| Gly14 | 8.55 | 101.75 | 8.56 | 101.63 | Pro95 | N/A | N/A | N/A | N/A |
| Glu15 | 8.04 | 123.34 | 8.03 | 123.33 | Gly96 | 9.27 | 110.31 | 9.25 | 110.7 |
| Pro16 | N/A | N/A | N/A | N/A | Ile97 | 6.76 | 121.49 | 6.77 | 121.31 |
| Leu17 | 9.2 | 126.13 | 9.17 | 125.96 | Leu98 | 7.87 | 128.89 | 7.81 | 129.95 |
| Gly18 | 7.24 | 102.52 | 7.23 | 102.33 | Ser99 | 8.28 | 118.81 | 7.94 | 119.4 |
| Arg19 | 8.34 | 121.29 | 8.35 | 121.28 | Met100 | 8.28 | 123.27 | ||
| Val20 | 9.37 | 126.94 | 9.38 | 126.92 | Ala101 | 7.99 | 125.97 | 8.22 | 126.95 |
| Ser21 | 8.76 | 120.36 | 8.77 | 120.39 | Asn102 | 8.11 | 113.4 | 7.68 | 113.59 |
| Phe22 | 9.51 | 119.11 | 9.5 | 119.02 | Ala103 | 8.77 | 123.37 | 9.18 | 121.03 |
| Glu23 | 8.74 | 123.23 | 8.7 | 123.15 | Gly104 | 8.18 | 109.38 | 8.24 | 107.71 |
| Leu24 | 8.17 | 122.5 | 8.14 | 122.45 | Pro105 | N/A | N/A | N/A | N/A |
| Phe25 | 8.82 | 124.75 | 8.87 | 124.77 | Asn106 | 8.86 | 119.13 | 8.87 | 119.05 |
| Ala26 | 8.43 | 129 | 8.46 | 129.05 | Thr107 | 10.21 | 110.39 | 10.3 | 110.31 |
| Asp27 | 8.97 | 114.09 | 8.99 | 113.99 | Asn108 | 7.37 | 120.61 | 7.42 | 120.56 |
| Lys28 | 7.53 | 118.08 | 7.53 | 118 | Gly109 | 9.15 | 110.83 | 9.14 | 110.91 |
| Val29 | 8.36 | 114.64 | 8.36 | 114.86 | Ser110 | 8.76 | 117.15 | 8.77 | 117.12 |
| Pro30 | N/A | N/A | N/A | N/A | Gln111 | 8.37 | 124.52 | 8.41 | 124.79 |
| Lys31 | 10.66 | 123.84 | 10.7 | 124.02 | Phe112 | 8.05 | 117.86 | 8.15 | 118.29 |
| Thr32 | 10.28 | 124.06 | 10.27 | 124.08 | Phe113 | 9.8 | 116.5 | 9.83 | 115.02 |
| Ala33 | 9.28 | 125.67 | 9.23 | 125.52 | Ile114 | 9.02 | 118.07 | ||
| Glu34 | 8.02 | 117.28 | 8.03 | 117.29 | Cys115 | 9.59 | 125.52 | 9.49 | 124.78 |
| Asn35 | 7.12 | 115.69 | 7.13 | 115.69 | Thr116 | 8.95 | 115.72 | 9.04 | 115.71 |
| Phe36 | 7.01 | 117.92 | 7.02 | 117.89 | Ala117 | 7.61 | 122.32 | 7.58 | 122.41 |
| Arg37 | 8.94 | 121.1 | 8.95 | 121.15 | Lys118 | 8.69 | 119.87 | ||
| Ala38 | 8.69 | 119.16 | 8.62 | 118.81 | Thr119 | 7.61 | 120.21 | 7.37 | 118.3 |
| Leu39 | 8.17 | 120.78 | 8.2 | 120.86 | Glu120 | 9.09 | 124.63 | 9.06 | 124.65 |
| Ser40 | 7.89 | 119.28 | 7.89 | 119.3 | Trp121 | 7.25 | 117.92 | 7.3 | 118.3 |
| Thr41 | 7.97 | 108.49 | 7.98 | 108.56 | Leu122 | 7.01 | 120.05 | 7.05 | 120.72 |
| Gly42 | 7.57 | 108.4 | 7.57 | 108.24 | Asp123 | 7.59 | 122.24 | 7.56 | 122.37 |
| Glu43 | 8.01 | 118.7 | 8.01 | 118.7 | Gly124 | 9.53 | 111.33 | 9.57 | 111.14 |
| Lys44 | 9.1 | 118.55 | 9.11 | 118.38 | Lys125 | 7.74 | 115.68 | 7.57 | 114.75 |
| Gly45 | 7.93 | 105.59 | 7.93 | 105.48 | His126 | 7.61 | 120.21 | ||
| Phe46 | 6.41 | 113.75 | 6.41 | 113.59 | Val127 | 8.24 | 124.74 | ||
| Gly47 | 7.75 | 104.7 | 7.72 | 104.61 | Val128 | 9.47 | 133.07 | 9.38 | 132.94 |
| Tyr48 | 6.88 | 113.79 | 6.86 | 113.89 | Phe129 | 8.1 | 117.87 | 8.11 | 117.89 |
| Lys49 | 8.47 | 124.92 | 8.48 | 124.84 | Gly130 | 7.36 | 110.79 | 7.36 | 110.73 |
| Gly50 | 9.48 | 117.9 | 9.52 | 117.97 | Lys131 | 8.34 | 115.36 | 8.3 | 115.06 |
| Ser51 | 8.38 | 116.5 | 8.4 | 116.58 | Val132 | 9.03 | 124.26 | ||
| Cys52 | 10.01 | 115.3 | 10.1 | 115.31 | Lys133 | 9.47 | 131.87 | 9.44 | 131.73 |
| Phe53 | 8.69 | 123.05 | 8.66 | 122.99 | Glu134 | 7.53 | 118.49 | 7.53 | 118.5 |
| His54 | 7.56 | 119.88 | 7.52 | 119.7 | Gly135 | ||||
| Arg55 | 7.04 | 123.14 | 6.87 | 124.3 | Met136 | 8.85 | 122.66 | 8.86 | 122.66 |
| Ile56 | 9.19 | 126.48 | 9.13 | 127.27 | Asn137 | 9.05 | 114.4 | 8.91 | 114.42 |
| Ile57 | 8.54 | 123.02 | 8.49 | 127.36 | Ile138 | 7.64 | 124.28 | 7.64 | 124.24 |
| Pro58 | N/A | N/A | N/A | N/A | Val139 | 7.24 | 121.97 | 7.26 | 122.16 |
| Gly59 | 9.73 | 114.24 | 9.85 | 114.11 | Glu140 | 8.26 | 117.69 | 8.31 | 117.82 |
| Phe60 | 8.17 | 119.37 | 8.1 | 119.19 | Ala141 | 7.49 | 121.13 | 7.49 | 121.04 |
| Met61 | 8.08 | 111.2 | 7.86 | 110.41 | Met142 | 8.29 | 117.3 | 8.29 | 117.41 |
| Cys62 | 8.47 | 114.88 | Glu143 | 7.82 | 116.36 | 7.89 | 116.6 | ||
| Gln63 | 8.72 | 127.99 | 9.33 | 127.5 | Arg144 | 7.02 | 114.61 | 7.02 | 114.63 |
| Gly64 | 7.36 | 110.79 | 7.48 | 110.77 | Phe145 | 7.61 | 115.42 | 7.62 | 115.25 |
| Gly65 | 9.36 | 106 | 9.1 | 105.22 | Gly146 | 7.5 | 104.75 | 7.56 | 104.82 |
| Asp66 | 9.96 | 124.06 | 10.01 | 124.4 | Ser147 | 8.2 | 110.11 | 8.19 | 109.89 |
| Phe67 | 6.62 | 116.04 | 6.69 | 116 | Arg148 | ||||
| Thr68 | 7.28 | 109.02 | 7.25 | 108.73 | Asn149 | ||||
| Arg69 | 8.65 | 122.09 | 8.68 | 122.05 | Gly150 | 8.04 | 110.22 | 8.06 | 110.65 |
| His70 | 6.53 | 111.11 | Lys151 | 7.53 | 119.89 | 7.47 | 119.8 | ||
| Asn71 | 7.49 | 112.49 | 7.44 | 112.24 | Thr152 | 8.85 | 116.65 | 8.86 | 116.81 |
| Gly72 | 9.66 | 110.6 | 9.67 | 111.25 | Ser153 | 9.41 | 117.05 | 9.46 | 117.28 |
| Thr73 | 7.93 | 112.2 | 7.86 | 109.83 | Lys154 | 7.53 | 119.37 | 7.53 | 119.27 |
| Gly74 | 8.71 | 114.04 | 8.8 | 114.03 | Lys155 | 8.78 | 121.73 | 8.82 | 121.79 |
| Gly75 | 8.11 | 109.15 | 8.06 | 108.9 | Ile156 | 9.61 | 134.42 | 9.62 | 134.33 |
| Lys76 | 6.97 | 115.71 | 6.93 | 115.5 | Thr157 | 9.24 | 117.07 | 9.22 | 116.94 |
| Ser77 | 7.79 | 114.41 | 7.75 | 114.44 | Ile158 | 8.58 | 121.7 | 8.59 | 121.66 |
| Ile78 | 8.55 | 111.24 | 8.55 | 111.1 | Ala159 | 8.87 | 132.53 | 8.87 | 132.53 |
| Tyr79 | 8.03 | 120.83 | 8.06 | 120.86 | Asp160 | 8.06 | 111.55 | 8.06 | 111.51 |
| Gly80 | 7.1 | 106.64 | 7.1 | 106.46 | Cys161 | 8.58 | 116.13 | 8.59 | 116.09 |
| Glu81 | Gly162 | 6.84 | 104.18 | 6.84 | 104.04 | ||||
| Lys82 | 7.86 | 112.72 | 7.83 | 112.28 | Gln163 | 9.05 | 121.01 | 9.08 | 121.11 |
| Phe83 | 9.17 | 116.64 | 9.2 | 116.47 | Leu164 | 8.59 | 126.15 | 8.59 | 125.92 |
| Glu84 | 9.23 | 119.54 | 9.28 | 119.46 | Glu165 | 8.13 | 126.36 | 8.12 | 126.08 |
| Asp85 | 8.59 | 118.9 | 8.62 | 118.81 | |||||