Variable accretion processes in the young binary-star system UY Aur∗
Abstract
We present new K-band spectroscopy of the UY Aur binary star system. Our data are the first to show emission in the spectrum of UY Aur A and the first to spectrally resolve the Br line in the spectrum of UY Aur B. We see an increase in the strength of the Br line in UY Aur A and a decrease in Br and line luminosity for UY Aur B compared to previous studies. Converting Br line luminosity to accretion rate, we infer that the accretion rate onto UY Aur A has increased by M⊙yr-1 per year since a rate of zero was observed in 1994. The Br line strength for UY Aur B has decreased by a factor of 0.54 since 1994, but the K-band flux has increased by 0.9 mags since 1998. The veiling of UY Aur B has also increased significantly. These data evince a much more luminous disk around UY Aur B. If the lower Br luminosity observed in the spectrum of UY Aur B indicates an intrinsically smaller accretion rate onto the star, then UY Aur A now accretes at a higher rate than UY Aur B. However, extinction at small radii or mass pile-up in the circumstellar disk could explain decreased Br emission around UY Aur B even when the disk luminosity implies an increased accretion rate. In addition to our scientific results for the UY Aur system, we discuss a dedicated pipeline we have developed for the reduction of echelle-mode data from the ARIES spectrograph.
1. Introduction
A large fraction () of of all main sequence stars in the galactic disk are in binary or multiple systems (e.g. Lada, 2006). The main-sequence binary fraction is a function of spectral type, varying from near 100% for early type stars down to for late M-type stars (Raghavan et al., 2010, and references therein). While observations of rich star-forming clusters seem to exhibit a binary fraction consistent with the main sequence value, loose star-forming associations show considerable excess (Duchêne, 1999, and references therein). In fact, surveys of the young low-mass stars in the Taurus-Auriga star-forming region indicate a binary fraction of (Ghez et al., 1993; Leinert et al., 1993; Kraus et al., 2011). Furthermore, young classical T-Tauri star binaries appear to be more co-eval than random pairings of stars within a cloud, implying the binary formation mechanism operates within Myr (Prato & Simon, 1997; Duchêne, 1999; White & Ghez, 2001; Hartigan & Kenyon, 2003). The high incidence of binaries in loose star forming regions implies that formation in multiple systems is the norm (see e.g. Duchêne & Kraus, 2013, for a recent review). While the multiplicity statistics of dense star-forming regions do not show significant excess over the main-sequence, it is still undetermined whether stars form with different multiplicity statistics in these environments, or whether shorter dynamical times accelerate the disruption of multiple systems (Duchêne & Kraus, 2013).
It is important to understand the details of the binary-star formation process given the significance of binary-star formation both as a substantial contributor to the galactic stellar population and in influencing planet formation and stellar feedback.
Theoretical studies have elucidated how dynamical resonances and tidal torques conspire to open a gap in a viscous circumbinary disk (e.g. Lin & Papaloizou, 1979). Matter can accrete through such gaps in geometrically thin streams (e.g. Artymowicz & Lubow, 1996). Studies of the flow from the circumbinary disk onto the circumstellar disks indicate that the primary star should have the more massive disk, however, model predictions of which star is preferentially fed new material seem to depend on the adopted viscosity (e.g. Bate & Bonnell, 1997; Ochi et al., 2005). Recently sub-mm observations of young binary stars have revealed some systems where the secondary is host to the most massive disk, possibly implicating multiple formation modes for binary stars (Akeson & Jensen, 2014).
UY Aur is a Classical T-Tauri star binary system. The stars are separated by 0.9′′ ( AU). When Joy & van Biesbrok (1944) first identified UY Aur as a binary in the optical, the authors reported a . A few decades later, Herbst et al. (1995) could not detect the secondary and placed a lower limit of at R-band. UY Aur has since been observed as a binary in the infrared (e.g. Ghez et al., 1993; Leinert et al., 1993; Close et al., 1998; Brandeker et al., 2003; Hioki et al., 2007). Resolved near-infrared photometry by Close et al. (1998), Brandeker et al. (2003), and Hioki et al. (2007) demonstrated that the flux ratio is variable in the infrared as well. Combining the H-band measurements of Close et al. (1998), and Hioki et al. (2007), UY Aur A varied relatively little, changing by magnitudes over 3 epochs in 10 years. UY Aur B, on the other hand, varied by up to 1.3 magnitudes in the same time.
Herbst et al. (1995) performed spatially resolved K-band spectroscopy of both sources. Those authors showed that UY Aur B exhibited strong Br and v=1-0 S(1) emission lines, while UY Aur A showed none. Br is a canonical accretion tracer, and their observations showed that UY Aur A can spend some time in a state with a very low accretion rate. The presence of v=1-0 S(1) emission without v=2-1 S(1) emission led Herbst et al. (1995) to believe it was arising in a shock. They suggested that the shock could arise from a stellar wind originating from UY Aur A and impacting circumstellar material around UY Aur B .
Millimeter molecular line observations revealed a Keplerian disk surrounding the stars (Dutrey et al., 1996; Duvert et al., 1998). The disk has an inner rim of AU (Hioki et al., 2007). By studying the reflected infrared light from the circumbinary disk, Close et al. (1998) was able to deduce a small/unrefined dust grain distribution. When Skemer et al. (2010)—using spatially resolved N-band spectroscopy— found a similar distribution of dust grains in the circumstellar disk of UY Aur A, they noted that either something is prohibiting the evolution of grains in the stellar disk, or the grains are being replenished from the circumbinary reservoir, a clue that material is making its way from the circumbinary disk to the circumstellar disks, as predicted by theory.
Throughout this paper we assume the stellar spectral types and masses deduced by Hartigan & Kenyon (2003). Using STIS on board , Hartigan & Kenyon (2003) obtained spatially resolved medium and low resolution spectra from –m. They simultaneously fit their data for veiling, spectral type, and reddening. Their best fit for UY Aur A is a 0.6 M⊙ M0 type star with Av=0.55. For UY Aur B, their best fit parameters indicate a 0.3 M⊙, M2.5 type star with Av=2.65. The significant difference in extinction toward each source is uncommon among their sample, but is consistent with the large change in observed flux of UY Aur B between the 1940’s and 1990’s. In fact, variable reddening has been suggested as the driver of the NIR variability in UY Aur B (e.g. Brandeker et al., 2003).
Here we report new spatially and spectrally resolved observations of UY Aur. We present the first detection of lines in the spectrum of UY Aur A, and the first spectrally resolved measurement of Br in the spectrum of UY Aur B. We highlight a significant change in the relative strengths of both the Br line and the v=1-0 S(1) line between our observations and the only other published K-band spectrum of UY Aur B (Herbst et al., 1995).
2. Observations and Reduction
We observed both components of UY Aur on 3 October 2012 UT using ARIES on the MMT. ARIES is optimized for diffraction limited observations behind the MMT adaptive optics system. We used the f/5.6 (0.1′′/pixel) echelle mode with a 1′′x0.2′′ slit. This mode is designed to provide cross-dispersed spectral orders at a resolution of R. Our setup targeted a wavelength range of – with some gaps between orders. The adaptive optics provided 0.2′′ FWHM PSFs on the imaging side of ARIES and we realized 0.4′′ FWHM spatial profiles on the spectrograph side. The degraded spatial profile is most likely due to one of the optics on the spectrometer side of ARIES. Measured argon-lamp emission lines indicate a realized spectral resolution of R=15,000.
Each component of the UY Aur binary was observed with the slit aligned along two anti-parallel position angles: and . This was done in order to help characterize instrumental effects on the spectral traces (e.g. Brannigan et al., 2006). An observing log is included in Table 1. We slewed off source to collect sky frames once for the pair of PA= observations and once for the pair of PA= observations. Likewise, observations of the A7 star HR 1620 were made once for each position angle to facilitate the correction of telluric absorption features in our data. Flat field frames were collected to correct for inter-pixel variations in the detector gain.
To monitor instrumental flexure and spectral fringing effects, we collected flat field frames at each new pointing during the night. Dark frames to correct the flats were collected at the end of the night.
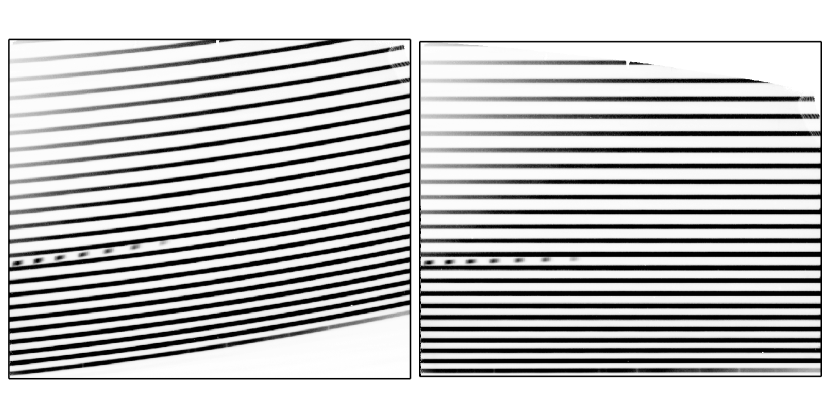
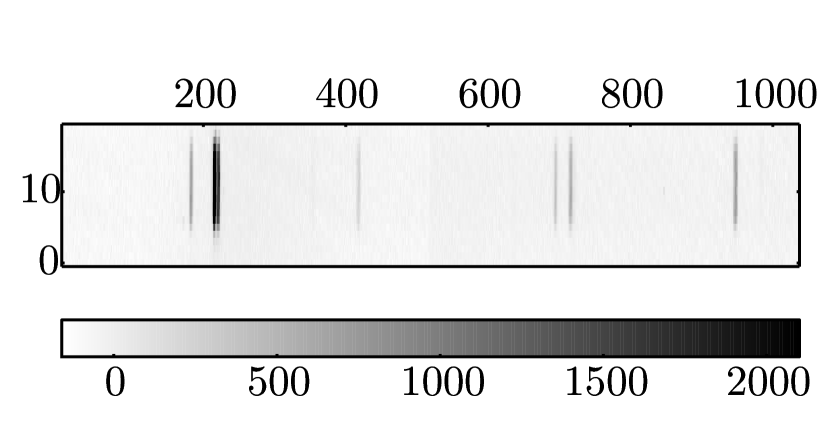
We developed a dedicated pipeline for the reduction of echelle-mode data from ARIES to analyze our observations. We began with subtracting sky frames from science frames, and dark frames from flat frames. We then dewarped the spectral orders using a fifth-degree two-dimensional polynomial coordinate transformation to map the curved stellar spectral traces to straight lines. Figure 1 shows an example of dewarping a flat-field frame using the transformation derived from the stellar traces. We used a fifth-degree transformation as this was adequate to ensure that the spatial dimension of each order was perpendicular to the spectral dimension, as we verified using observations of an Argon arclamp (Figure 2).
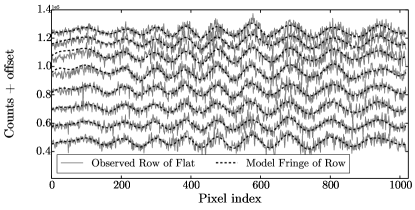
After dewarping all the frames, we began defringing, beginning with the flats. The dominant frequency of the instrumental fringing is . This corresponds to a fringe wavelength of km/s. Our flat-defringing algorithm proceeded row-by-row in each order as follows. We first fitted and subtracted a third-order polynomial to the row. We then created a model of the fringe pattern using a Fourier filter which only passed frequencies less than 0.015 (see Figure 3). Next, we subtracted this model fringe from the row it was created from and then added back in the third-order polynomial that was previously subtracted. This was done in order to remove the fringing but maintain the very low frequency shape of the flat. We saved our derived model fringe in a template for later re-use in defringing the stellar spectra.
After defringing the flats, we divided the flat frames into the stellar spectra. Our next step was to extract from the two-dimensional spectral orders one-dimensional spectra. To extract the 1-d spectra we first fit a Gaussian to the average spatial profile of the order. Then, for each column, we summed the light in each row 1- above and below the average spatial centroid.
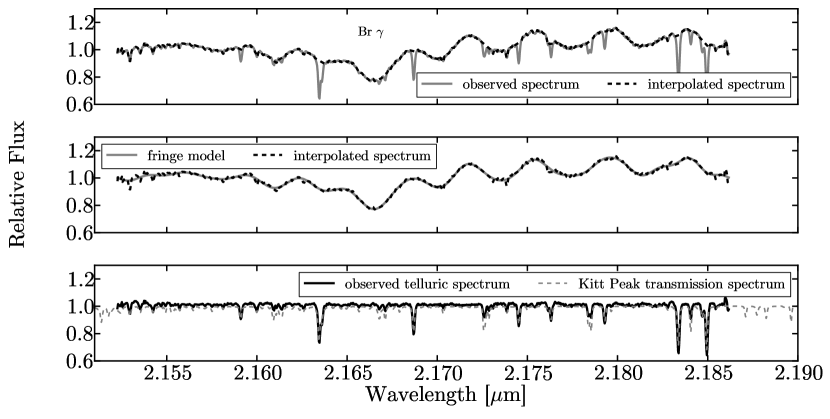
With the stellar spectra extracted, our next step was to defringe them. We started with the telluric calibrator. Since sharp features have broad Fourier transforms, narrow telluric absorption lines in the telluric calibrator spectrum can bias the instrumental fringe model when using even a low-pass Fourier filter. To avoid this, before creating the model fringe, we first interpolated over telluric lines. We have illustrated this step in the top panel of Figure 4. We created a model fringe by first subtracting a best-fit low-order polynomial and then using a Fourier filter to pass only the spatial frequencies less than 0.015 (see the middle panel of Figure 4). Finally, we subtracted this model fringe from the original spectrum to remove the instrumental fringing and then added back in the best-fit polynomial. Since our calibrator source, HR 1620, rotates quite quickly ( km/s, Royer et al., 2002), our Fourier filtering approach had the ancillary effect of removing rotationally broadened photospheric lines. In the bottom panel of Figure 4, we compare to the observed telluric transmission spectrum provided by Hinkle et al. (2003). To facilitate the comparison, we show the spectrum of HR 1620 before we replace the best-fit polynomial shape.
Next, we performed a wavelength calibration on both the defringed telluric spectrum and the as-yet uncorrected target spectra. Wavelength calibration was done by fitting a fourth-degree polynomial to transform measured telluric absorption line pixel positions to the wavelengths of each line provided by Hinkle et al. (2003). We then divided the telluric calibrator spectrum into the target spectra to remove telluric absorption features. At this point, we summed the spectra from each PA for each target, creating one higher signal-to-noise spectrum for each source.
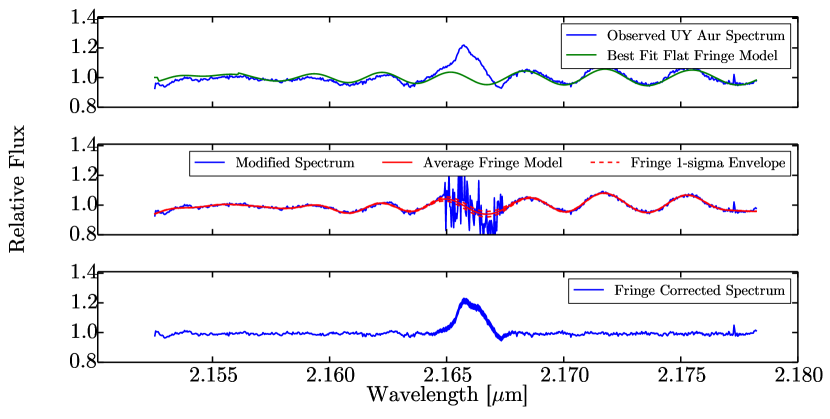
To defringe the target spectra, we interpolated over narrow emission lines and photospheric absorption lines before defringing. For broad features, such as the Br emission line, we had to take care not to model out real emission while still generating an accurate model for the instrumental fringing. To do this, we first generated a best-guess model fringe. Our best-guess fringe was created in two steps: 1) we extracted a one-dimensional flat-field fringe by summing the same rows in the template of saved flat fringes that were summed in the science frame during the extraction of the science spectrum, and 2) we fit this one-dimensional flat-field fringe to the target spectrum by adjusting the wavelength solution parameters to produce a closest match. We show this step in the top panel of Figure 5. Next we replaced spectral regions of known features in our observed spectra, with the corresponding region of our best-guess fringe down weighted by the addition of Gaussian noise. We then used a low-pass Fourier filter to generate a model fringe (middle panel of Figure 5). We repeated this process 1000 times, each time with a new realization of the Gaussian noise, to produce 1000 model fringes. The average of the 1000 model fringes we took as our fiducial fringe for defringing. The variation in the 1000 fringe models suggested the precision of our model fringe. In the bottom panel of Figure 5, we show a portion of the defringed spectrum of UY Aur A in the vicinity of Br, plotted with a blue swath. The width of the swath at each wavelength represents the 1- variation in the fringe model at that point.
| Source | Total Exposure Time [s] | Slit PA | Airmass |
|---|---|---|---|
| UY Aur A | 899.1 | 1.00 | |
| UY Aur B | 899.1 | 1.01 | |
| HR 1620 | 149.5 | 1.03 | |
| UY Aur B | 899.1 | 1.04 | |
| UY Aur A | 799.2 | 1.07 | |
| HR 1620 | 149.5 | 1.05 |
Note. — Each member of the UY Aur binary was observed twice. Each observation was performed with anti-parallel slit orientations. We use HR 1620 to perform the telluric calibration. After performing a wavelength calibration and correcting for telluric lines in the spectra of UY Aur A and B, we sum over rotation angle to produce a single spectrum for each source.
3. Results and Analysis
3.1. Equivalent Widths
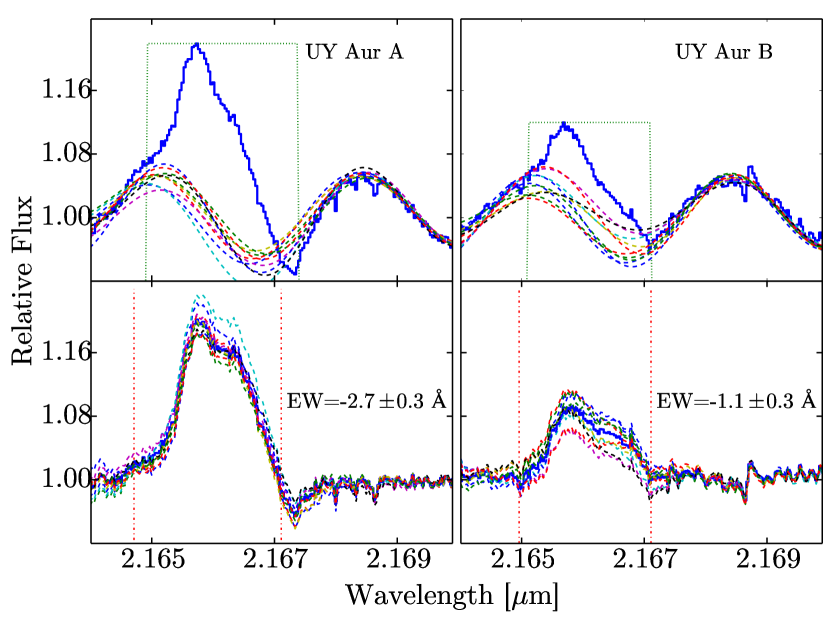
We measured the equivalent width (EW) of the Br , v=1-0 S(1), and v=1-0 S(0) lines for both sources. For the broad Br lines, we performed the EW measurement during the repetitive fringe modeling process (see Section 2). For each repetition, we generated and subtracted a new fringe model from the observed spectrum and measured the EW. To illustrate this process we show 10 repetitions in Figure 6. The mean and standard deviation of all 1000 EW measurements is our adopted EW and uncertainty, respectively. The defringing process appears to introduce Å of uncertainty into our EW measurements for Br . We do not correct our measured EWs for photospheric absorption, in line with previous studies (Herbst et al., 1995; Fischer et al., 2011). Given the spectral types of the stars (M0 and M2 for UY Aur A and B, respectively Hartigan & Kenyon, 2003), even with zero veiling the effect on our measured EWs is 10%, within our measurement uncertainty.
For the narrow lines, we did not iterate to produce the fringe model because the lines are narrow compared to the fringing, and can be readily distinguished (see Section 2). To estimate our precision in the measurement of the EW of these lines, we ascribed to each pixel in the line the same level of noise as measured in the nearby continuum. We then calculate the EW uncertainty to be , where is the number of pixels in the line and is the measured noise level. All EW measurements are presented in Table 2.
3.2. Line Luminosities
To convert our EW measurements to line luminosities we used D=140 pc (Elias, 1978), and the K-band photometry of Close et al. (1998) for UY Aur A. For UY Aur B, which has shown significant NIR variability (e.g. Hioki et al., 2007), we determined the flux ratio to the primary using imaging data taken at the same time as our spectra. Line luminosities are not corrected for extinction. In Section 4 we discuss how variable extinction may effect the relative line luminosities. All resulting emission line luminosities are reported in Table 2.
3.3. Accretion Rates
We converted our measured Br line luminosity to accretion luminosity, without correcting for extinction, using the correlation reported by Muzerolle et al. (1998). Accretion rates were derived from accretion luminosities using Equation 11 in Hartigan & Kenyon (2003) —which assumes that accreting material is in free fall from 3R∗ when it hits the stellar surface and that half of the accretion energy is radiated directly, the other half heats the star. Our accretion rate measurements are listed in Table 2.
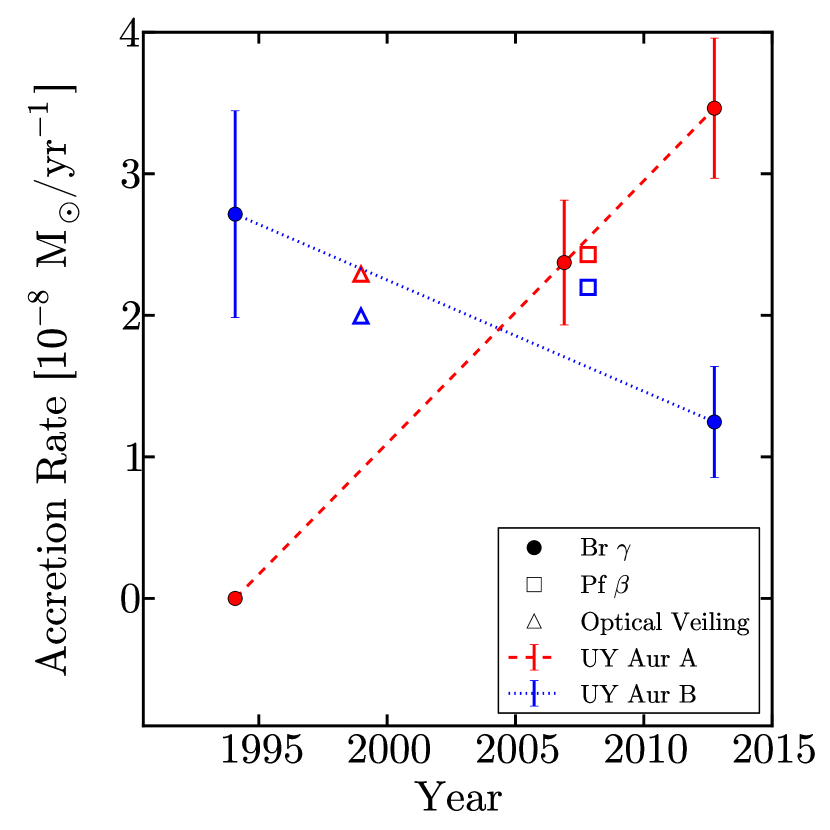
In Figure 7 we plot the accretion rate versus time for each source in the binary. The additional Br derived accretion rates for UY Aur A were calculated using the EWs from Herbst et al. (1995) and Fischer et al. (2011) and the continuum flux level observed by Close et al. (1998). The flux level for UY Aur B is always deduced by comparing to UY Aur A. Since Herbst et al. (1995) and Fischer et al. (2011) do not report errors for their EW measurements we assign them our measured value of 0.3 Å. This is probably conservative since most of our uncertainty comes from defringing. We use 0.05 magnitudes of uncertainty in the continuum flux level, the value reported in Close et al. (1998). Some additional uncertainty in the flux level is accrued by using flux calibration data not collected in parallel with the spectroscopic observations. For example, young binary stars as a class can vary by magnitudes in the NIR (e.g Skrutskie et al., 1996; Hioki et al., 2007). However, since the flux ratio between A and B is measured, any untracked variability in the flux of UY Aur A will affect both components of the binary similarly, preserving the relative trends. In addition to Br derived accretion rates, we also include measurements using other techniques in Figure 7. With triangle and square symbols we show accretion rates derived using both optical veiling measurements (Hartigan & Kenyon, 2003), and Pf measurements (Salyk et al., 2013), respectively.
The published Pf-derived accretion rates (Salyk et al., 2013) appear to be at odds with the long-term trends in accretion rate inferred from Br and optical veiling measurements. A re-analysis of the NIRSPEC data suggests that the components were misidentified, and we correct that here. However, we caution that the NIRSPEC slit was misaligned with the binary PA during these observations, and this adds systematic uncertainty to the relative accretion luminosities derived from these data.
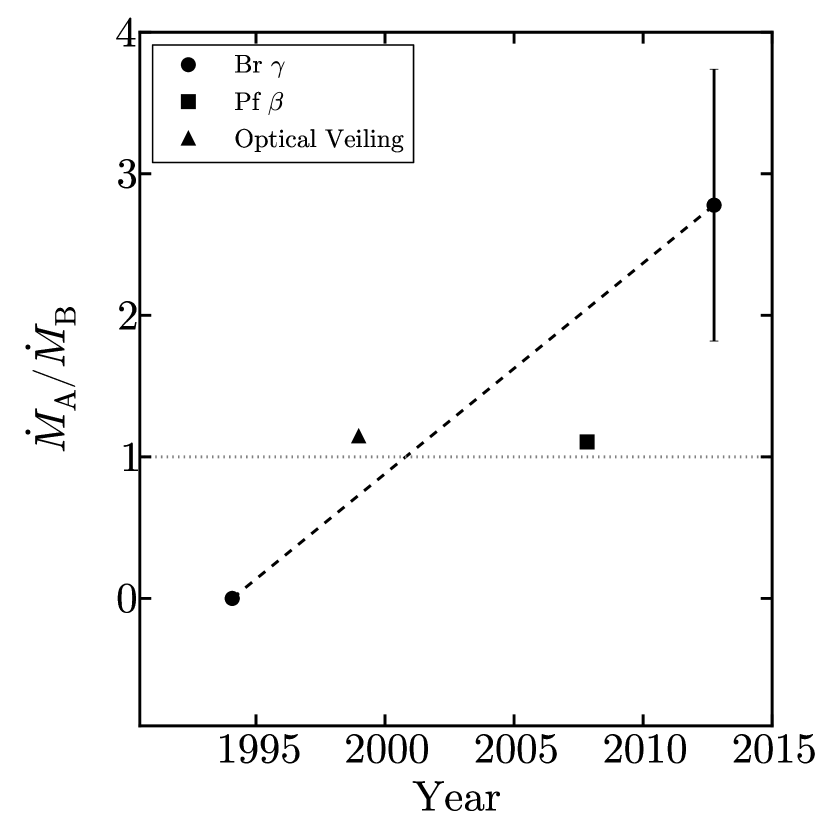
In Figure 8, we show the accretion rate ratio versus time for all epochs when the accretion rate was measured for both sources. Figure 8 shows that accretion was directed primarily toward the secondary component in the initial epoch, but transitioned to the primary over time. The timescale of the observed variability is much shorter than the year dynamical timescale of the binary. Rather, the 5-10 year timescale corresponds to the orbital timescale at 2.5–5 AU from the stars.
| UY Aur | aaThe K-band magnitude for UY Aur A is from Close et al. (1998). For UY Aur B, we determined the magnitude difference using our own measured flux ratio. | EW(Br ) | bbBr luminosities are not corrected for extinction, following the approach of previous studies. We discuss below the potential effects of strong extinction on the Br line of UY Aur B. | ccAccretion luminosity is derived using the correlation reported by Muzerolle et al. (1998) | ddMass accretion rates were derived using the stellar radii and masses reported in Hartigan & Kenyon (2003) | EW(S(1)) | EW(S(0)) | ||
|---|---|---|---|---|---|---|---|---|---|
| [Å] | [Å] | [Å] | |||||||
| A | |||||||||
| B |
Note. — The uncertainty in each reported value is presented in parentheses. Luminosities were derived assuming a distance of 140 pc.
3.4. Lines
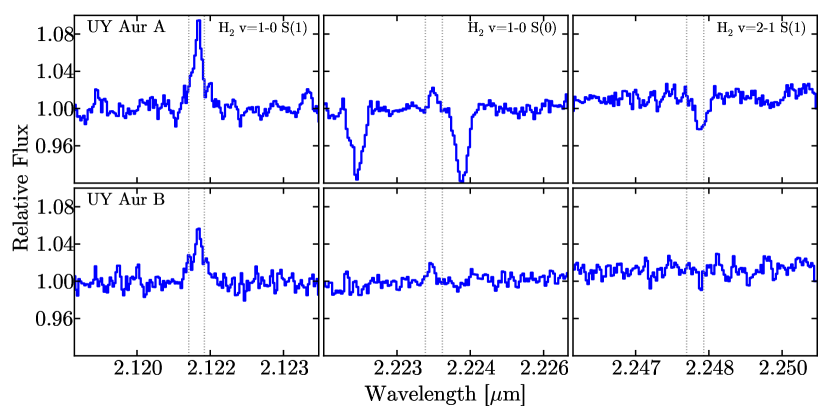
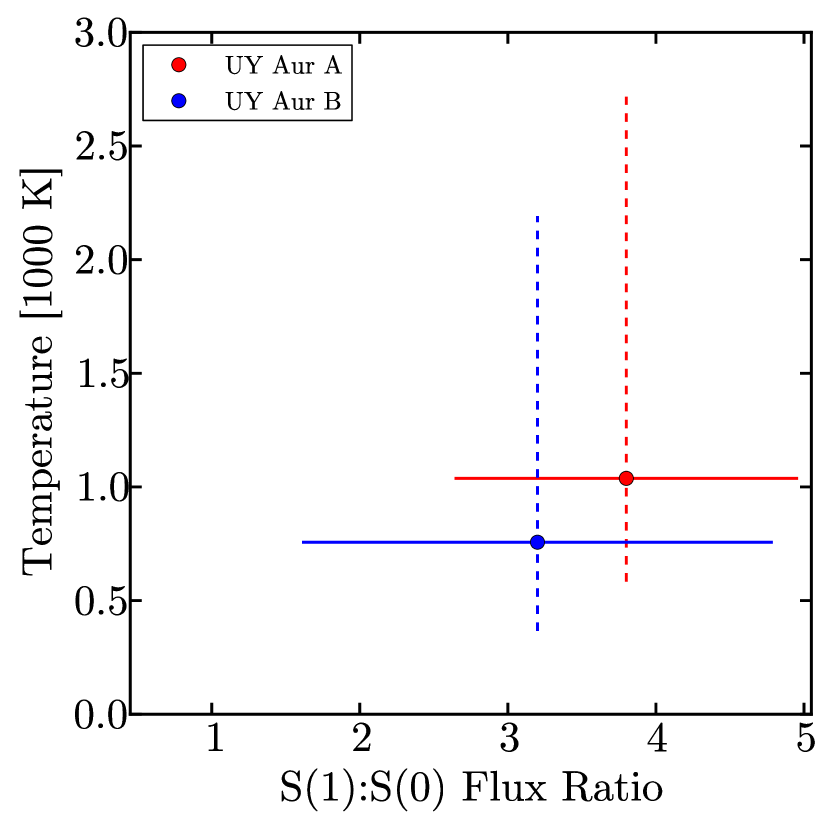
In Figure 9, we show portions of the stellar spectra near the molecular Hydrogen v=1-0 S(0) and S(1) lines and the v=2-1 S(1) line. We detect the v=1-0 S(0) and S(1) lines in both sources. A photospheric absorption line in the spectrum of UY Aur A complicates our ability to place a strong constraint on the v=2-1 S(1) line. We do not detect the line in the spectrum of UY Aur B.
We have calculated the v=1-0 S(1) to S(0) ratio for each source. The ratios and associated uncertainty intervals are plotted in Figure 9. We have also converted these ratios to excitation temperatures using the transition probabilities of Wolniewicz et al. (1998). The implied temperatures, K and K for UY Aur A and B, respectively, are also plotted in Figure 9. At these temperatures the v=2-1 S(1) line should be very weak, the intensity of the v=1-0 S(1) line. This is compatible with the absence of strong v=2-1 S(1) emission in our spectra. Since models of fluorescent diffuse gas predict that the strength of the v=2-1 S(1) line should be similar to, even greater than, the v=1-0 S(0) line (e.g. Black & van Dishoeck, 1987), we can rule out a large contribution to the line emission from fluorescent diffuse gas.
There are several ways to produce a thermalized spectrum of lines. Mechanisms include shock heating and UV/X-ray irradiation of dense gas. Shock heating, in an inflow or outflow, is expected to produce relatively broad lines ( km/s) offset from the continuum (e.g. Beck et al., 2008, 2012).
We observe lines that are unresolved (widths km/s) and not offset in velocity from the stellar photospheres. We detect no astrometric displacement along the slit (PA=40∘). Our measured astrometric precision along the slit is AU. Given the observed v=1-0 S(1) line-to-continuum ratio for UY Aur A, , we constrain the bulk of the observed flux to be centered within 15 AU of the continuum at the 3- level. Furthermore, we see no significant increase in the line-to-continuum ratio of the lines when we extract spectra from the margins of our slit, ( AU) from the continuum centroid. In these off-star extractions we can constrain any extended emission in the region, along a PA of 40∘, to be less than ergs cm-2 s-1 arcsec-2. Since we do not detect any spatial offsets or extension in the lines, it is difficult for us to directly implicate shocks with these data.
Assessing whether FUV or X-ray irradiation could be responsible for excititing the lines is difficult because no well characterized FUV spectrum exists for UY Aur. Nomura et al. (2007) used the spectrum of TW Hya to model the ro-vibrational spectrum from a proto-planetary disk around a 0.5 M⊙ star. For the case with the smallest grains, they predict thermal line ratios and a v=1-0 S(1) line strength 2.5 times as strong as what we report here for UY Aur A. Since UY Aur has a weaker X-ray luminosity than TW Hya (by a factor of 5, Güdel et al., 2010), it is not surprising that UY Aur A has a somewhat weaker line strength than predicted by the Nomura et al. (2007) model. High density UV fluorescence combined with X-rays seems capable of generating much of the observed compact emission.
3.5. Veiling
Veiling is the ratio of excess flux () over photospheric flux () at a given wavelength:
| (1) |
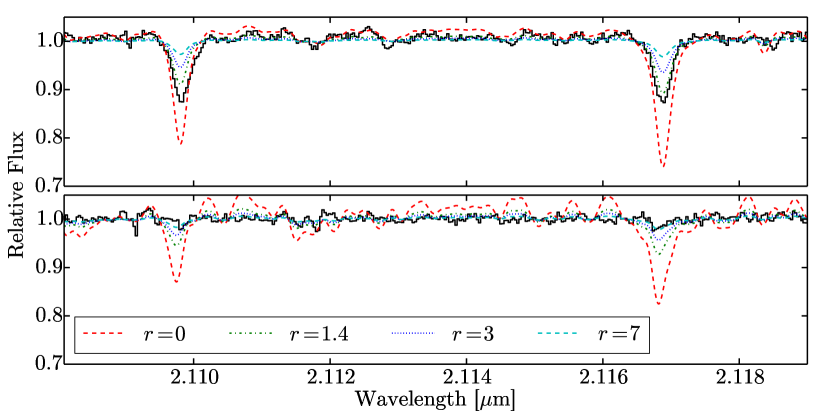
Since we did not observe photospheric calibrators for UY Aur A and B, making a quantitative measurement of the veiling toward each source is difficult. Without a photospheric template for each source we cannot characterize internal instrumental scattered light, which can artificially veil our spectra (see Eisner et al. (2010), for an example of instrumental veiling with ARIES). However, we can make a qualitative statement about the relative veiling between each source. In Figure 11 we show a portion of the spectra of both UY Aur A (top panel) and UY Aur B (bottom panel) in the vicinity of two strong Aluminum photospheric absorption lines. We also plot synthetic PHOENIX photospheric spectra (Husser et al., 2013). The model spectra represent stars with logg=4.5 and Teff=3900 K and Teff=3500 K for UY Aur A and B, respectively. We veiled the synthetic spectra by , 1.4, 3, and 7. The value is that reported by Fischer et al. (2011) for UY Aur A. As shown in the figure, matches our observation for UY Aur A well, suggesting that instrumental veiling is weak or absent. Our spectrum of UY Aur B shows significantly weaker absorption lines than the -depth lines observed in the R=250 spectrum reported by Herbst et al. (1995). Thus we report that a large change in the K-band veiling of UY Aur B has taken place since 1994.
4. Discussion
In the previous section we presented the second ever K-band spectrum of UY Aur B. We observe a magnitude increase in the flux of this source, together with increased veiling and decreased emission line luminosity. An increased circumstellar disk flux could explain both the increased K-band flux and the stronger veiling. Such an increase could be due to an episodic increase in the mass accretion rate through the disk. However, we must understand why the observed Br luminosity, a tracer of accretion onto the star, has decreased even while accretion through the disk has increased.
One explanation appeals to a nearly edge-on viewing geometry to explain the increased luminosity of the disk and the decreased luminosity of the Br line. Several observations of the system hint at an edge-on orientation, including the unusually discrepant visual extinctions toward UY Aur A and B (Hartigan & Kenyon, 2003), the extincted appearance of the 10-micron silicate feature (Skemer et al., 2010), and the large amplitude optical and NIR variability (e.g. compare Joy & van Biesbrok, 1944; Herbst et al., 1995; Close et al., 1998; Brandeker et al., 2003; Hioki et al., 2007). In this scenario, when the scale height of the disk responds to the increased accretion rate and temperature —becoming larger— our view of the star becomes more obscured by the inner disk rim. Thus, the intrinsic Br luminosity can increase but be observed to decrease.
We estimate the level of increased K-band extinction necessary to produce the observed change in the Br luminosity given an assumed factor for the increased disk luminosity. Measuring the increase in disk luminosity requires a previous quantitative measurement of the K-band veiling for UY Aur B, which does not exist. We can make a ballpark estimate assuming that the previous veiling was , a common value for other classical T Tauri stars (Fischer et al., 2011), and qualitatively consistent with the previous K-band spectrum (Herbst et al., 1995). For example, if the 0.86 magnitudes increase we observe in the K-band flux is driven by a factor of 3 increase in the luminosity of the disk, and we assume a similar increase in the intrinsic accretion luminosity of material making it onto the star, then we expect a factor of 2.4 increase in the intrinsic Br luminosity 111Using the correlation between accretion luminosity and Br luminosity in Muzerolle et al. (1998). However, the observed Br line strength has decreased by a factor of 0.54. This implies that only 23% of the Br luminosity is passing through the puffed up disk rim, an increase in AK of 1.6.
We convert such an increase in AK to a change in column density along the observed line of sight using a value for the K-band dust opacity. We use cm2g-1, compatible with models of T Tauri disk dust grains (Miyake & Nakagawa, 1993), to derive the required column density increase: 0.15 g/cm2. The fractional increase implied by such a change depends on the initial column density along our line of sight. Small fractional changes are required along lines of sight initially transecting optically thick portions of the inner rim while larger fractional changes are required along sight lines through more tenuous material. For example, if our sight line radially through the rim initially transected where , then a 3% change in the scale height of the disk is necessary. A 10% change in the scale height is required if our initial line of sight was through the rim at a height where . Using LT4, and assuming a hydrostatic disk, hcsT0.5, we expect a 14% increase in the scale height given our assumed increase in the luminosity of the disk.
Alternatively, if the observed decrease in the Br flux and the increased disk luminosity implies an intrinsically lower accretion rate onto the central star, material flowing through the disk must accumulate at some radius or be ejected in an outflow before making its way onto the star. In a viscous accretion disk, mass is expected to pile up in regions with relatively low viscosity. Gammie (1996) described an accretion flow where the mid-plane of the disk at intermediate radii has very low viscosity because the gas, which is neutral there, is decoupled from the magnetic field. Mass is predicted to accumulate in these “deadzones”. Gammie (1996) pointed out that such an accumulation of mass would lead to instability, resulting either in the fragmentation of bound objects (e.g. planets) or in sufficient heating of the deadzone to ionize enough of the gas to couple the material there to the magnetic field, causing a sudden and dramatic increase in the accretion rate. If matter is indeed piling up in a deadzone, then we would expect UY Aur B to undergo outbursts in the future.
One clue that can help us understand the intrinsic accretion properties of UY Aur B is the observation of extended outflows. Mass-loss rates from young stars are correlated with mass accretion rates (e.g. Hartigan et al., 1995), and outflows can be used as a tracer of accretion. Recently, Pyo et al. (2014) reported the observation of extended outflows surrounding UY Aur. These extended outflows should not be extincted by circumstellar disk material at small radii, and may give a clearer perspective on the intrinsic accretion rate of UY Aur B. Thus, time monitoring of outflow rates from UY Aur B will help to constrain the physics of the variability in this source.
Additionally, both of the excitation scenarios discussed above (shock or UV/X-ray excitation) should produce lines with intensity that correlates with the accretion rate. For shocks, a larger accretion rate should result in a larger outflow rate (e.g. Hartigan et al., 1995), strengthening the signal. An increased accretion rate should also produce a stronger UV and X-ray accretion-shock spectrum and strengthen the fluorescent excitation. Thus our observed decrease in line strength compared to the observations by Herbst et al. (1995) may indicate a decrease in the intrinsic accretion rate.
If the highly inclined geometry explanation for the behavior of UY Aur B is correct, we predict that veiling, total flux, and outflow tracers of accretion should be correlated, but that shock-tracers of accretion (such as H I lines like Br ) should be anticorrelated. More frequent monitoring of this system will provide better knowledge of the nature and timescale of the variability and will be important in disentangling the physical state of UY Aur B.
Since the circumstellar disk around UY Aur A is not edge on (Akeson & Jensen, 2014), we predict that all tracers of accretion, veiling, and total flux should be correlated. Three epochs of published spatially separated K-band spectroscopy exist for UY Aur A. The accretion rate seems to be increasing M⊙yr-1 per year. UY Aur A now has the larger observed Br luminosity. In addition to the indicators included in our Figure 7, further evidence that UY Aur A has been trending toward a more active state can be seen in the comparison of the He I line shapes of Edwards et al. (2006) and Pyo et al. (2014). In 2014, Pyo et al. (2014) observed deeper red and blue shifted absorption features than Edwards et al. (2006). This suggests more vigorous infall and outflow from the source.
Additional evidence that UY Aur A is now in an intrinsically more active state than UY Aur B comes from the relative outflow rates. Pyo et al. (2014) showed that UY Aur A was driving an outflow at a larger rate than UY Aur B in 2007, consistent with our Figure 7. However, if we assume the outflow is launched at the velocity observed by Pyo et al. (2014) in the [FeII] lines, km/s, then we expect year delay between variations in accretion at the stellar surface and variations in the observed outflow.
If UY Aur B is in fact accreting less than UY Aur A then we must understand why the more vigorous accretor in UY Aur seems to alternate between the primary and the secondary. Theory predicts that circumbinary disks should preferentially either the primary, as shown by Ochi et al. (2005), or the secondary as predicted byBate & Bonnell (1997). One solution, which is consistent with the data, is that the accretion onto both sources, as traced by Br, is episodic. In this way the average accretion rate onto the primary or secondary could dominate over time. This scenario has significant implications for planet formation because intense bursts of accretion can alter the chemical make-up and particle distribution in the disk by dissociating molecules and evaporating dust.
Another option is that the UY Aur binary system is substantially different from modeled systems. For example, Bate & Bonnell (1997) and Ochi et al. (2005) modeled systems with the implicit assumption that the binary seeds result from a disk fragmentation process. The possibly mis-aligned inclinations of the circumstellar disks in UY Aur is a clue that UY Aur may not have formed via disk fragmentation. This more complicated scenario is not as easily compared to clear-cut theoretical predictions.
5. Conclusions
We have presented R=15,000 K-band spectroscopy of each star in the UY Aur binary system. Our spectrum of UY Aur B is only the second ever published and enables time domain studies at wavelengths probing both circumstellar material and accretion. We highlight significant changes since 1994. Specifically, we see that UY Aur A presents increased Br luminosity and now shows emission while UY Aur B shows a decrease in the strength of Br and emission. In contrast to the state of the system in 1994, UY Aur A now has the stronger observed Br line. Additionally, UY Aur B now appears significantly brighter and more heavily veiled than it has in the past.
We suggested two scenarios to explain the observed changes in the state of UY Aur B. Both cases include increased viscous accretion through the circumstellar disk to account for the increased luminosity and stronger veiling observed. In the first scenario a similar increase in the intrinsic Br line strength is attenuated by increased extinction due to a puffed-up edge-on disk. We showed that the change in the scale height of the disk that is necessary to produce the reduced Br line strength is compatible with the amount of change expected for a disk undergoing an episode of increased viscous accretion. Alternatively, the observed reduction in the Br line strength, and the accretion onto the star which it traces, is intrinsic. In this case, mass flowing through the disk must pile up or be ejected before it reaches the star. We predict, if the edge-on disk scenario is correct, that future higher cadence time-monitoring of this system will reveal an anti-correlation in the variability of shock-tracers of accretion (such as H I lines) and the observed disk luminosity and veiling.
6. Acknowledgments
This work was supported by NASA Origins grant NNXX11AK57G.
References
- Akeson & Jensen (2014) Akeson, R. L. & Jensen, E. L. N. 2014, ApJ, 784, 62
- Artymowicz & Lubow (1996) Artymowicz, P. & Lubow, S. H. 1996, ApJ, 467, L77
- Bary et al. (2003) Bary, J. S., Weintraub, D. A., & Kastner, J. H. 2003, ApJ, 586, 1136
- Bary et al. (2008) Bary, J. S., Matt, S. P., Skrutskie, M. F., et al. 2008, ApJ, 687, 376
- Bate (2000) Bate, M. R. 2000, MNRAS, 314, 33
- Bate & Bonnell (1997) Bate, M. R. & Bonnell, I. A. 1997, MNRAS, 285, 33
- Beck et al. (2008) Beck, T. L., McGregor, P. J., Takami, M., & Pyo, T.-S. 2008, ApJ, 676, 472
- Beck et al. (2012) Beck, T. L., Bary, J. S., Dutrey, A., et al. 2012, ApJ, 754, 72
- Black & van Dishoeck (1987) Black, J. H. & van Dishoeck, E. F. 1987, ApJ, 322, 412
- Brandeker et al. (2003) Brandeker, A., Jayawardhana, R., & Najita, J. 2003, AJ, 126, 2009
- Close et al. (1998) Close, L. M., Dutrey, A., Roddier, F., Guilloteau, S., Roddier, C., Northcott, M., Menard, F., Duvert, G., Graves, J. E., & Potter, D. 1998, ApJ, 499, 883
- Brannigan et al. (2006) Brannigan, E., Takami, M., Chrysostomou, A., & Bailey, J. 2006, MNRAS, 367, 315
- Draine & Bertoldi (1996) Draine, B. T. & Bertoldi, F. 1996, ApJ, 468, 269
- Duchêne (1999) Duchêne, G. 1999, A&A, 341, 547
- Duchêne & Kraus (2013) Duchêne, G. & Kraus, A. 2013, ARA&A, 51, 269
- Dutrey et al. (1996) Dutrey, A., Guilloteau, S., Duvert, G., Prato, L., Simon, M., Schuster, K., & Menard, F. 1996, A&A, 309, 493
- Duvert et al. (1998) Duvert, G., Dutrey, A., Guilloteau, S., Menard, F., Schuster, K., Prato, L., & Simon, M. 1998, A&A, 332, 867
- Edwards et al. (2006) Edwards, S., Fischer, W., Hillenbrand, L., & Kwan, J. 2006, ApJ, 646, 319
- Eisner et al. (2010) Eisner, J. A., Doppmann, G. W., Najita, J. R., McCarthy, D., Kulesa, C., Swift, B. J., & Teske, J. 2010, ApJ, 722, L28
- Elias (1978) Elias, J. H. 1978, ApJ, 224, 857
- Fischer et al. (2011) Fischer, W., Edwards, S., Hillenbrand, L., & Kwan, J. 2011, ApJ, 730, 73
- Gammie (1996) Gammie, C. F. 1996, ApJ, 457, 355
- Ghez et al. (1993) Ghez, A. M., Neugebauer, G., & Matthews, K. 1993, AJ, 106, 2005
- Güdel et al. (2010) Güdel, M., Lahuis, F., Briggs, K. R., et al. 2010, A&A, 519, A113
- Hartigan et al. (1995) Hartigan, P., Edwards, S., & Ghandour, L. 1995, ApJ, 452, 736
- Hartigan & Kenyon (2003) Hartigan, P. & Kenyon, S. J. 2003, ApJ, 583, 334
- Herczeg et al. (2004) Herczeg, G. J., Wood, B. E., Linsky, J. L., Valenti, J. A., & Johns-Krull, C. M. 2004, ApJ, 607, 369
- Herbst et al. (1995) Herbst, T. M., Koresko, C. D., & Leinert, C. 1995, ApJ, 444, L93
- Hinkle et al. (2003) Hinkle, K. H., Wallace, L., & Livingston, W. 2003, in Bulletin of the American Astronomical Society, Vol. 35, American Astronomical Society Meeting Abstracts, 1260
- Hioki et al. (2007) Hioki, T., Itoh, Y., Oasa, Y., Fukagawa, M., Kudo, T., Mayama, S., Funayama, H., Hayashi, M., Hayashi, S. S., Pyo, T.-S., Ishii, M., Nishikawa, T., & Tamura, M. 2007, AJ, 134, 880
- Husser et al. (2013) Husser, T.-O., Wende-von Berg, S., Dreizler, S., Homeier, D., Reiners, A., Barman, T., & Hauschildt, P. H. 2013, A&A, 553, A6
- Joy & van Biesbrok (1944) Joy, A. H. & van Biesbrok, G. 1944, PASP, 56, 123
- Kraus et al. (2011) Kraus, A. L., Ireland, M. J., Martinache, F., & Hillenbrand, L. A. 2011, ApJ, 731, 8
- Lada (2006) Lada, C. J. 2006, ApJ, 640, L63
- Leinert et al. (1993) Leinert, C., Zinnecker, H., Weitzel, N., Christou, J., Ridgway, S. T., Jameson, R., Haas, M., & Lenzen, R. 1993, A&A, 278, 129
- Lin & Papaloizou (1979) Lin, D. N. C. & Papaloizou, J. 1979, MNRAS, 188, 191
- Miyake & Nakagawa (1993) Miyake, K. & Nakagawa, Y. 1993, icarus, 106, 20
- Muzerolle et al. (1998) Muzerolle, J., Hartmann, L., & Calvet, N. 1998, AJ, 116, 2965
- Nomura et al. (2007) Nomura, H., Aikawa, Y., Tsujimoto, M., Nakagawa, Y., & Millar, T. J. 2007, ApJ, 661, 334
- Ochi et al. (2005) Ochi, Y., Sugimoto, K., & Hanawa, T. 2005, ApJ, 623, 922
- Prato & Simon (1997) Prato, L. & Simon, M. 1997, ApJ, 474, 455
- Pyo et al. (2014) Pyo, T.-S., Hayashi, M., Beck, T. L., Davis, C. J., & Takami, M. 2014, ApJ, 786, 63
- Raghavan et al. (2010) Raghavan, D., McAlister, H. A., Henry, T. J., Latham, D. W., Marcy, G. W., Mason, B. D., Gies, D. R., White, R. J., & ten Brummelaar, T. A. 2010, ApJS, 190, 1
- Royer et al. (2002) Royer, F., Grenier, S., Baylac, M.-O., Gómez, A. E., & Zorec, J. 2002, A&A, 393, 897
- Salyk et al. (2013) Salyk, C., Herczeg, G. J., Brown, J. M., Blake, G. A., Pontoppidan, K. M., & van Dishoeck, E. F. 2013, ApJ, 769, 21
- Skemer et al. (2010) Skemer, A. J., Close, L. M., Hinz, P. M., Hoffmann, W. F., Greene, T. P., Males, J. R., & Beck, T. L. 2010, ApJ, 711, 1280
- Skrutskie et al. (1996) Skrutskie, M. F., Meyer, M. R., Whalen, D., & Hamilton, C. 1996, AJ, 112, 2168
- White & Ghez (2001) White, R. J. & Ghez, A. M. 2001, ApJ, 556, 265
- Wolniewicz et al. (1998) Wolniewicz, L., Simbotin, I., & Dalgarno, A. 1998, ApJS, 115, 293