photon
\provideunit\pixpixel
\provideunit\tarcsecondarcsecond
\provideunit\ele\tothe-
\provideunit\psb\ph\per\per\Square\per\Square\tarcsecond\per\micro
\provideunit\micron\micro
\authorinfoFurther author information (send correspondence to AJH):
AJH: E-mail: anthony.horton@aao.gov.au, Telephone: +61 2 9372 4847
Anthony Horton, Robert Content, Simon Ellis and Jon Lawrence, ”Photonic lantern behaviour and implications for instrument design,” Advances in Optical and Mechanical Technologies for Telescopes and Instrumentation, Navarro, Cunningham, Barto, Editors, Proc. SPIE 9151, 9151-72 (2014)
Copyright 2014 Society of Photo Optical Instrumentation Engineers. One print or electronic copy may be made for personal use only. Systematic electronic or print reproduction and distribution, duplication of any material in this paper for a fee or for commercial purposes, or modification of the content of the paper are prohibited.
Photonic lantern behaviour and implications for instrument design
Abstract
Photonic lanterns are an important enabling technology for astrophotonics with a wide range of potential applications including fibre Bragg grating OH suppression, integrated photonic spectrographs and fibre scramblers for high resolution spectroscopy. The behaviour of photonic lanterns differs in several important respects from the conventional fibre systems more frequently used in astronomical instruments and a detailed understanding of this behaviour is required in order to make the most effective use of this promising technology. To this end we have undertaken a laboratory study of photonic lanterns with the aim of developing an empirical model for the mapping from input to output illumination distributions. We have measured overall transmission and near field output light distributions as a function of input angle of incidence for photonic lanterns with between 19 and 61 cores. We present the results of this work, highlight the key differences between photonic lanterns and conventional fibres, and illustrate the implications for instrument design via a case study, the design of the PRAXIS spectrograph. The empirical photonic lantern model was incorporated into an end-to-end PRAXIS performance model which was used to optimise the design parameters of the instrument. We describe the methods used and the resulting conclusions. The details of photonic lantern behaviour proved particularly important in selecting the optimum on sky field of view per fibre and in modelling of the instrument thermal background.
keywords:
Astrophotonics, photonics, photonic lantern, optical fibre, fibre Bragg grating, OH suppression, spectroscopy1 INTRODUCTION
In recent years there has been considerable interest in the field of astrophotonics, the application of photonic technologies to astronomy[1]. Photonic devices such as fibre Bragg gratings (FBGs), arrayed waveguide gratings (AWGs) and integrated optics interferometers offer considerable benefits in a range of astronomical applications, specifically OH suppression (OHS)[2, 3], spectroscopy[4, 5] and optical interferometry[6] for the devices listed. One property shared by all of these devices is that their operation depends critically on their being constructed from single mode fibres/waveguides and this presents a challenge for astronomical use. The coupling efficiency between a telescope and a single mode fibre is approximatedly 0.7 times the Strehl ratio of the stellar image, for reasonable values of the telescope central obstruction[7, 8]. Under some circumstances the resulting coupling losses are acceptable, i.e. narrow field adaptive optics (AO) on telescopes that are either small or have high order (‘extreme’) AO systems, and in the case of interferometry the rejection of light by the single mode fibre actually acts as beneficial spatial filter. In general, though, direct coupling into single mode fibres is unacceptably lossy, for example for seeing limited observations on large telescopes the Strehl ratio and consequently the coupling efficiency will be well below 1%. The photonic lantern was invented as a solution to this problem.
A photonic lantern is a fibre (or waveguide) taper device which converts a single multimode input into multiple single mode outputs or vice versa. With appropriate design parameters and the right illumination conditions the transition can be low loss in both directions[9, 10]. By using a photonic lantern to feed multimode light into an array of identical single mode photonic devices and (optionally) a second photonic lantern to combine the light from their outputs into a single multimode output it is possible to construct a multimode device with the same performance of a single mode device, albeit at the cost of producing multiple copies of the single mode device[11]. As a result photonic lanterns are a key part of the practical implementation of most astrophotonic technologies.
Photonic lanterns also have potential astronomical applications of their own. Experimental results suggest that photonic lanterns are highly effective ‘fibre scramblers’, i.e. the output illumination distribution is insensitive to the input illumination distribution[12]. This would make photonic lanterns useful for stabilising the point spread functions of spectrographs, such as those used for high precision radial velocity measurements.
In order to utilise photonic lanterns effectively it is important to understand their behaviour. This behaviour differs both qualitatively and quantitively from the conventional step index multimode fibres (MMF) typically used for astronomy, primarily because waveguide modal behaviour manifests differently in photonic lanterns. In a conventional MMF the number of guided modes that can propagate along the fibre is determined by the material numerical aperture ( where and are the refractive indices of the fibre core and cladding materials respectively), the fibre core diameter () and the wavelength () via the equation
| (1) |
For a photonic lantern, on the other hand, the number of modes which can propagate from the multimode input to the multimode output is fixed and equal to twice the number of single mode fibres/cores/waveguides within the lantern (hereafter referred to as cores). Equation 1 is still valid however, and can be rearranged to define the effective numerical aperture of a photonic lantern[13],
| (2) |
NA is an important design parameter as it defines the acceptance cone angle for the multimode input of the photonic lantern, where is the half cone angle and is the refractive index of the medium in front of the input. By applying conservation of étendue/ product and using small angle approximations we are able to write a simple expression relating the on sky field of view (FoV) per photonic lantern of an astronomical instrument to the number of cores in each lantern,
| (3) |
where is the angular diameter of the lantern FoV, is the diameter of the telescope and is a parameter to account for focal ratio degradation (FRD) in any sections of MMF on the input side of the photonic lantern.
Naively we might assume that equations 2 and 3 define the optimal NA with which to illuminate a photonic lantern and the corresponding optimal on-sky FoV per lantern, however to do so is to make an implicit assumption that all light with an NA below the photonic lantern NA will be transmitted and all light with an NA above the photonic lantern NA will be lost. In reality the situation is not so clear cut.
For a conventional step index MMF with a very large number of guided modes the qualitative behaviour can be deduced from consideration of geometric (ray) optics. Any light entering the fibre with an NA less than the material NA of the fibre will be totally internally reflected at the core-clad interface and guided by the fibre. Light which is incident at larger angles may or may not be reflected at the core-clad interface depending on its position. If a ray is laterally offset from the fibre axis (a ‘skew ray’) then it will intersect the core-clad interface at an oblique angle and if the offset is large enough it will be internally reflected. As a result the transmission of the fibre as a function of the incident angle of illumination is high and constant until the angle reaches the fibre’s material NA at which point it tails off until only the most extreme skew rays are guided by the fibre. A full waveguide analysis only slightly alters these conclusions. Skew rays beyond the material NA of the fibre are found to correspond to ‘leaky modes’ which radiate energy as they propagate along the fibre in a process analogous to bend losses. As a consequence the transmission of the fibre beyond the material NA reduces as fibre length increases so that for an infinitely long fibre the behaviour reduces to a sharp cut off at the material NA.
In the opposite limit, that of a single mode fibre (SMF), the coupling of light into the fibre is determined by the overlap integral of the incident electromagnetic field with the fibre mode field. The mode field of a step index single mode fibre is approximately Gaussian in form and so fibre transmission as a function of incident angle of illumination is also approximately Gaussian.
Photonic lanterns, which are able to propagate a small and fixed number of modes, are expected to exhibit behaviour intermediate between that of a highly multimoded fibre and a single mode fibre. The exact nature of this behaviour is not well known, however, but is important for determining the optimum design parameters for instruments that use photonic lanterns. It is this issue that has been the focus of our laboratory study to date.
2 Filled cone tests
2.1 Method
GNOSIS was the first instrument to use photonic lanterns for astronomical observations[14, 15]. During the commissioning of the GNOSIS instrument measurements were made of the throughput of the OH suppression grating unit as a function of input focal ratio. These tests were performed on all 7 channels of the complete grating unit. Each channel consists of the following components, in order:
-
1.
core diameter MMF pigtail
-
2.
A 1 MMF to 19 SMF (19 core) photonic lantern
-
3.
19 H1 OH suppression FBGs
-
4.
19 H2 OH suppression FBGs
-
5.
A 19 SMF to 1 MMF (19 core) photonic lantern
-
6.
core diameter MMF pigtail
To perform the experiment the output of a fibre coupled superluminescent diode (SLD) was collimated, passed through an adjustable iris and then refocussed onto the input fibre pigtail. An infrared optical power meter was used to measure the power at both the input and the output allowing the throughput to be calculated.
2.2 Results
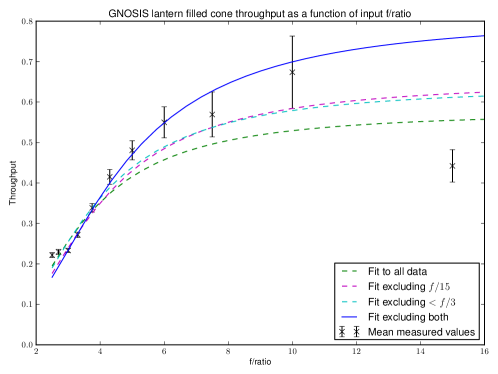
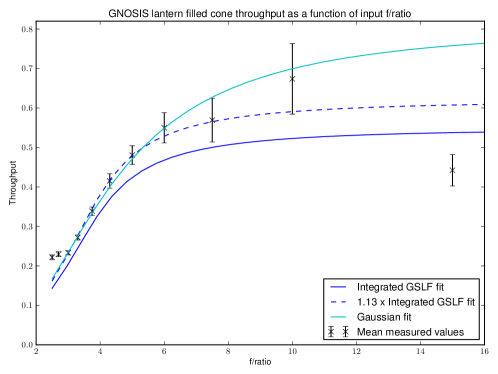
The results of the measurements of the GNOSIS photonic lanterns are presented in figure 1 together with a series of fits to the data. We note that the measurements are generally consistent with a smooth curve of increasing throughput with increasing focal ratio with the exception of three data points, the two at lowest focal ratio and the one at the highest focal ratio. There are good reasons to believe that systematic errors have effected these three values. At the low focal ratio end the higher than expected throughput values can be explained by the collimated beam not fully or evenly illuminating the iris aperture when it is at its widest, in effect the real focal ratio of the illumination is lower than the diameter of the aperture would suggest. For the highest focal ratio point the lower than expected throughput values can be explained by losses due to diffraction, at the diffraction limited Airy disc diameter is , larger than the diameter core of the input fibre pigtail.
2.3 Analysis
As these photonic lanterns can only transmit a small number of modes we expected their behaviour to be qualitatively similar to that of a single mode fibre. We therefore tried a fitting function which assumes that the transmission of the lantern as a function of input angle (or, equivalently, NA) is a Gaussian. That function applies to collimated illumination, to convert to illumination by a converging beam as in this experiment we simply integrate the Gaussian over the range of solid angles in the beam. We performed a least squares fit of the Gaussian double integral function to the complete data set, the data set excluding the highest focal ratio point, the data set excluding the two lowest focal ratio points, and the data set excluding all three outliers. As can be seen in the figure 1 the fit is poor unless all three outliers are excluded, in which case the simple Gaussian model reproduces the measured results well.
3 Collimated illumination tests
Due to time constraints during GNOSIS commissioning the filled cone tests described in section 2 inevitably provided data limited in both quantity and quality. The small number of data points, large error bars and concerns about systematic errors mean that the shape of the photonic lantern transmission function is poorly constrained by these data. In order to improve the state of knowledge of the transmission function further tests of the GNOSIS lanterns were necessary. Furthermore the existing data on the GNOSIS lanterns only provided information on the behaviour of a single photonic lantern design with 19 cores, in order to gain insight into the dependence of the shape of the transmission function on the number of cores we have also undertaken tests on a 61 core lantern.
3.1 Method
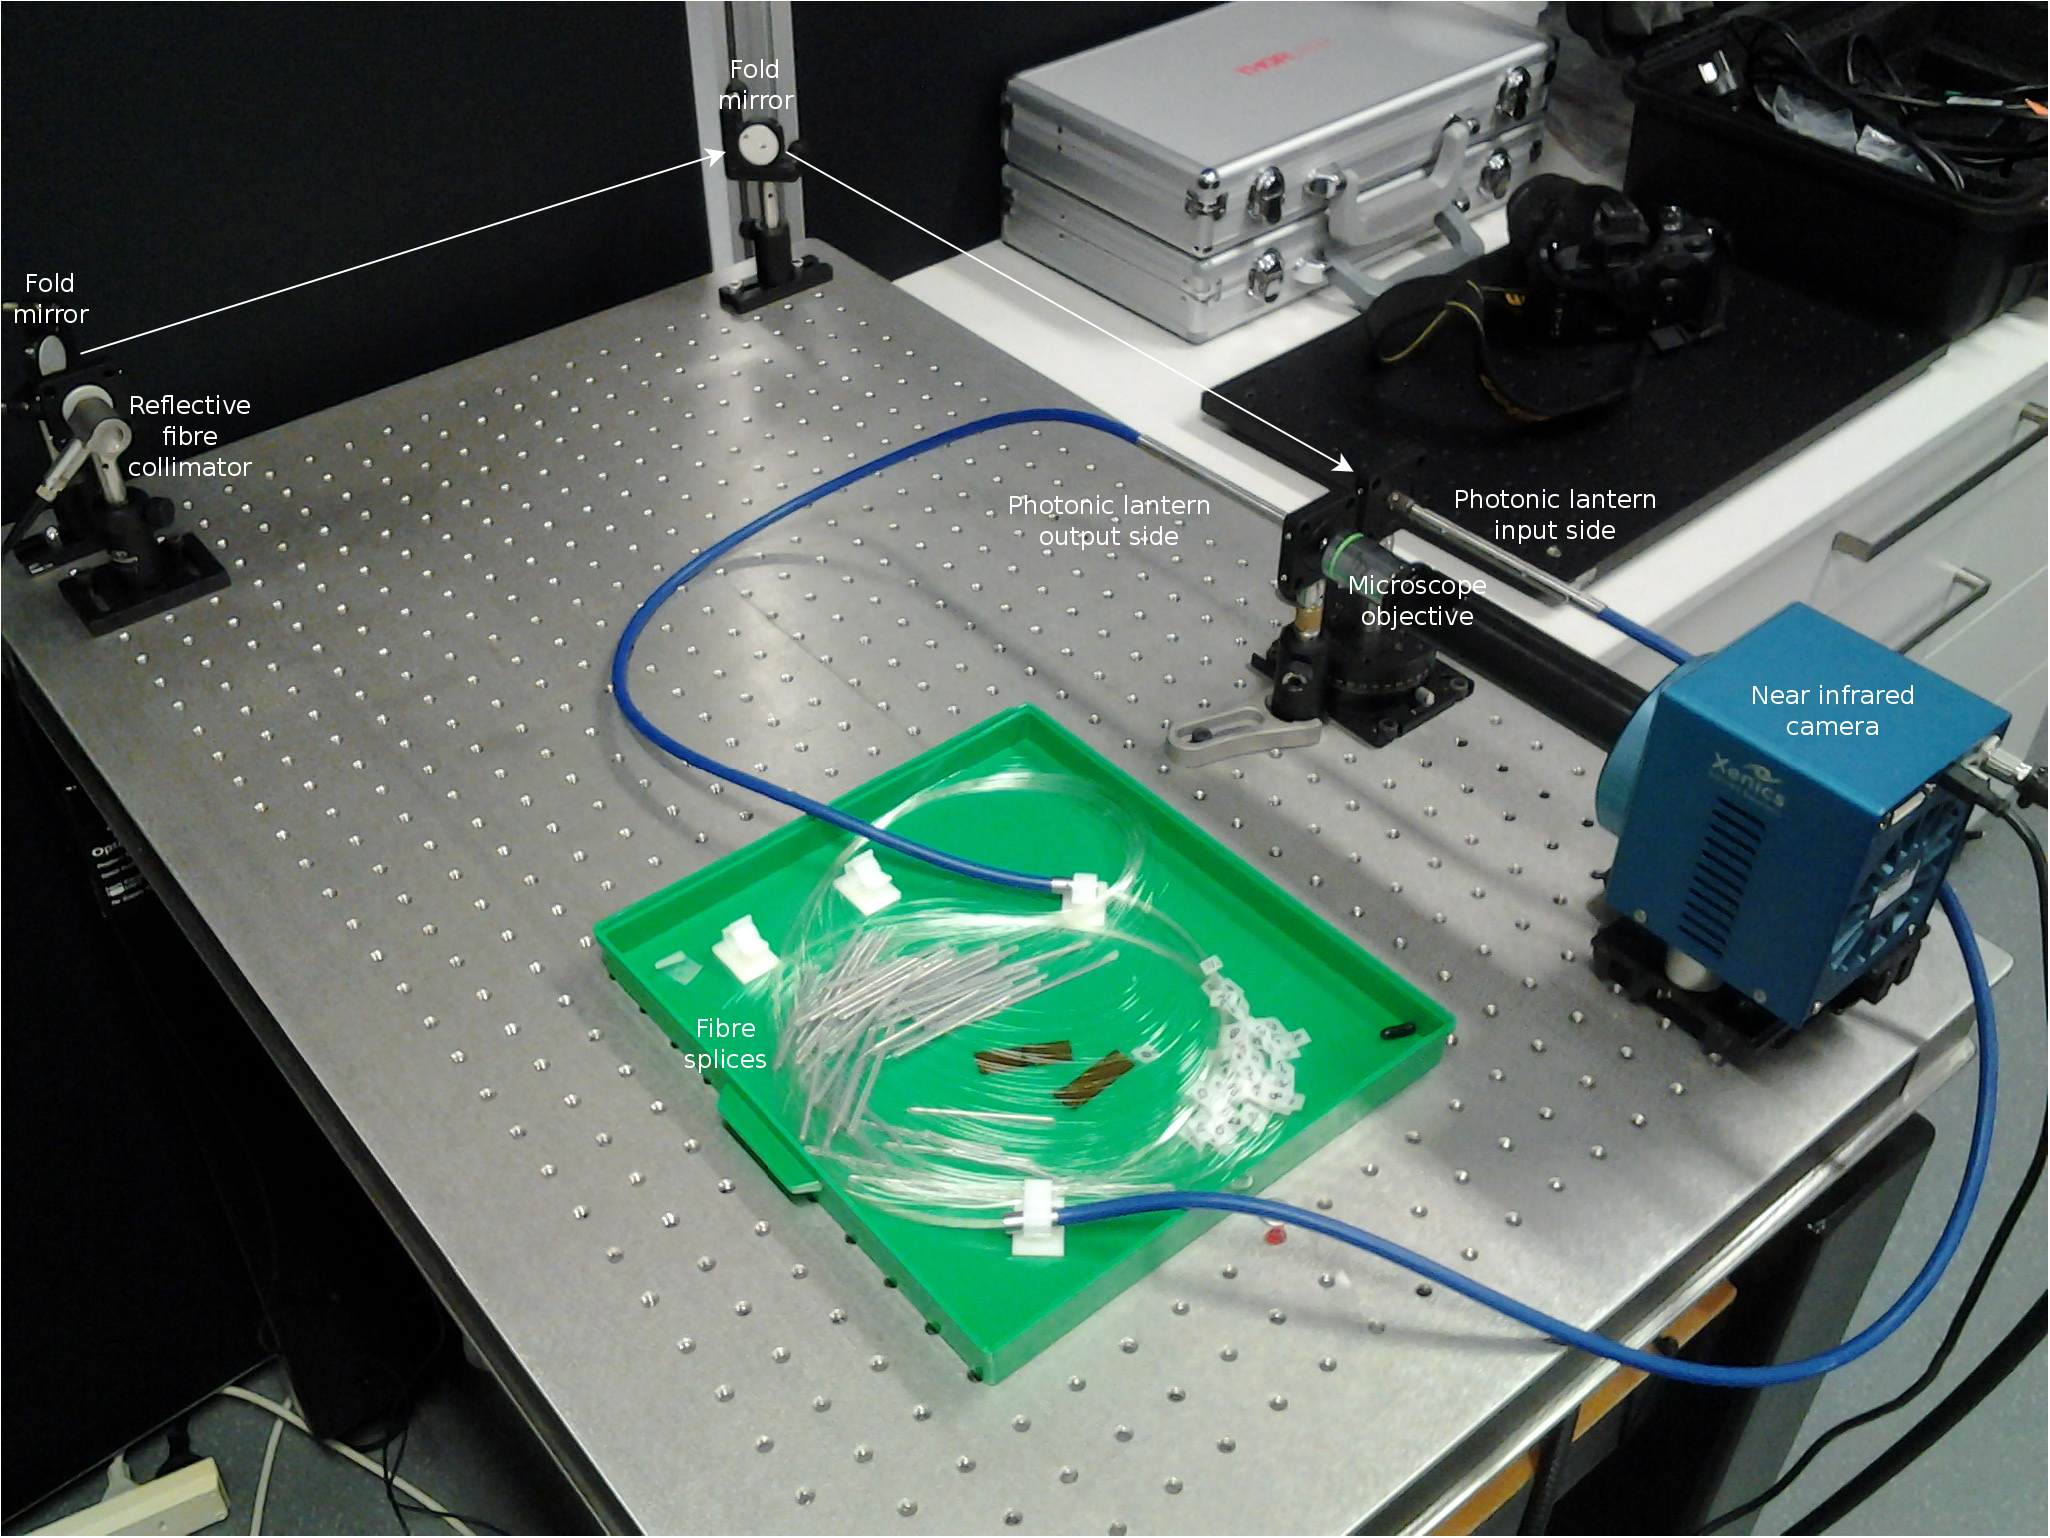
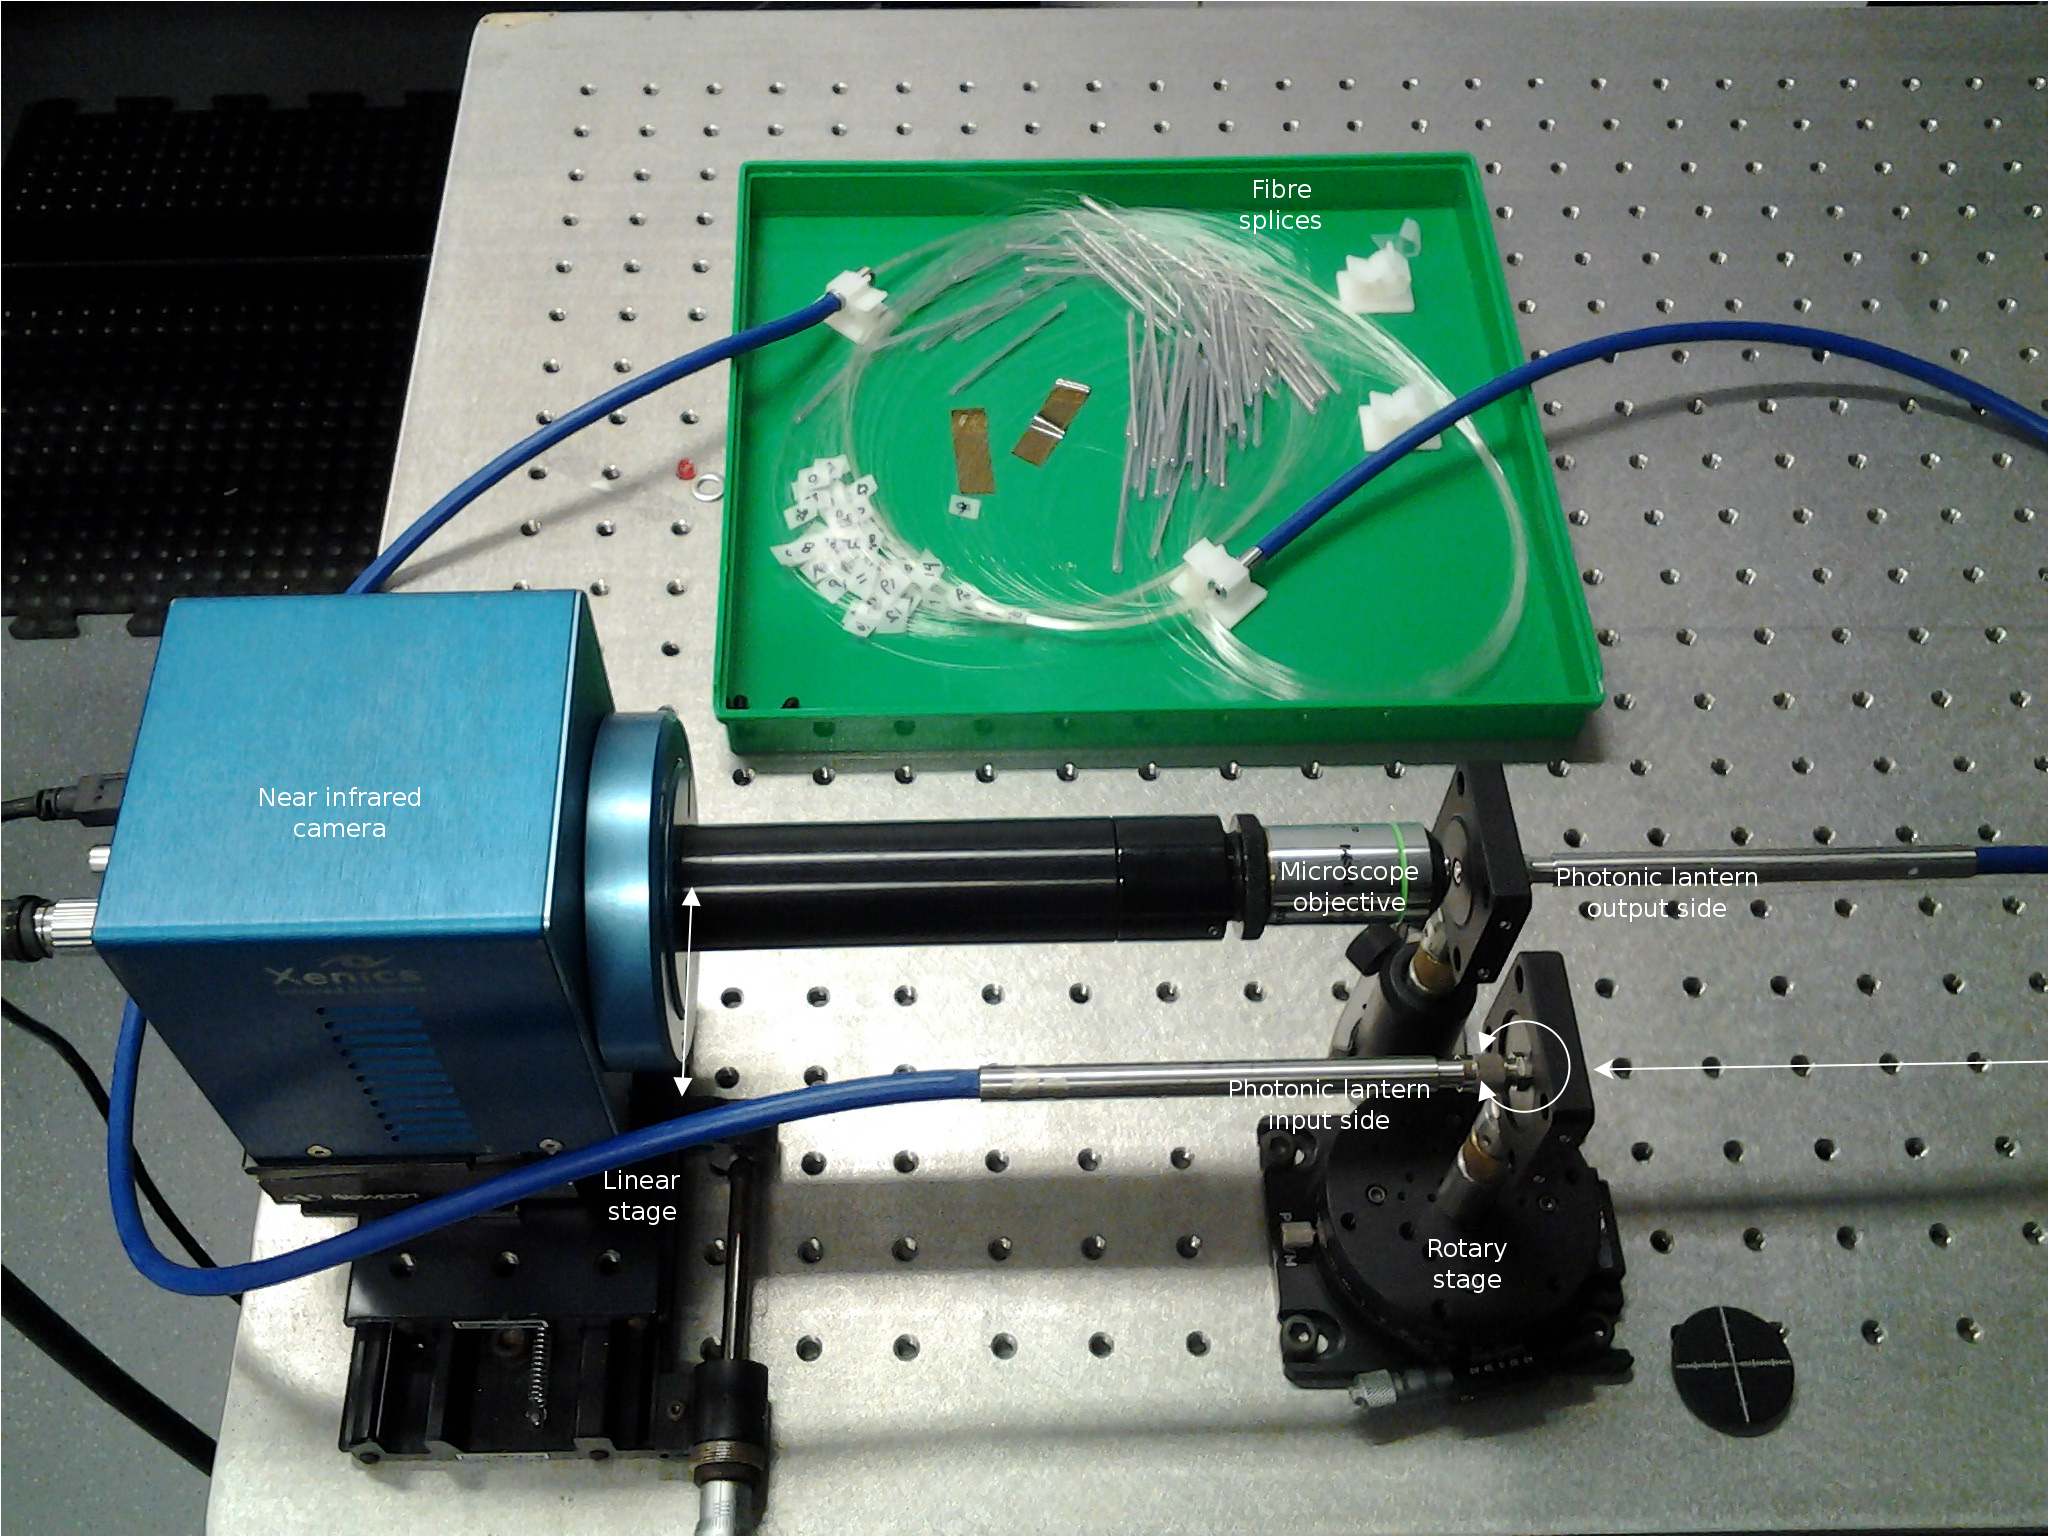
The experimental approach was somewhat different to that used during GNOSIS commissioning. The same fibre coupled SLD light source was used but instead of focussing the beam onto the input of the photonic lantern under test we used collimated illumination. The input of the lantern was mounted in a rotary stage so that it could be rotated about an axis perpendicular to the lantern axis and passing through the input end face, thereby allowing the angle of incidence of the illumination to be varied while keeping the photonic lantern input in the same part of the beam. Both converging and collimated illumination are able to provide the same information, the main advantages of the collimated approach are that it is less susceptible to systematic errors caused by either uneven illumination of the beam or diffraction. One disadvantage of the collimated illumination approach is that much less of the light from the source enters the photonic lantern so more sensitive optical power measurements are required, for this reason we used a near infrared camera to measure the power instead of a photodiode based optical power meter. The experimental apparatus is shown in figures 2 and 3.
The GNOSIS lantern tests were performed on the single grating unit channel which had FC/PC fibre connectors at input and output (the other 6 channels had their inputs and outputs permanently fusion spliced to the fore optics unit and slit optics unit fibre bundles during commissioning). In order to connect the grating unit to the experimental apparatus two Thorlabs M16L01 core, 0.22 NA, FC/PC to SMA long fibre patch cables were connected between the input and output ports of the experiment and those of the grating unit. The grating unit channel used for these tests is believed to have the lowest throughput of the 7 based on test results from GNOSIS commissioning.
The 61 core photonic lanterns used for this test were prototype devices manufactured in 2009 by Crystal Fibre (now part of NKT Photonics)[16]. The photonic lanterns were supplied as packaged fibre tapers with an SMA connector on the multimode side and bare single mode fibre pigtails on the other. In order to construct a complete multimode to multiple single mode to multimode photonic lantern the 61 single mode fibre pigtails from one device were fusion spliced directly to the 61 single mode fibre pigtails of a second device. No attempt was made to match up pigtails corresponding to the same position within the fibre taper. The two devices used have designations PL12 and PL13. Both devices have nominal multimode core and cladding diameters of and respectively, and use Corning SMF-28 for the single mode pigtails.
For comparison with the photonic lanterns we also tested conventional multimode fibres of similar core size. For the GNOSIS lantern the comparison fibres used were simply the same two M16L01 fibre patch cords that had been used to connect the lantern to the experiment, for the purposes of the comparison the FC/PC connectorised ends of the two fibres were connected directly to each other using a mating sleeve thereby bypassing the lantern. For the 61 core lantern two different comparison fibres were used, both with core diameter, nominal NA of 0.22, length of and SMA connectors at both ends. The first data set used an Ocean Optics fibre patch cable while the second used a Thorlabs M15L01 fibre patch cable.
The rotary stage was used to change the angle of incidence of the beam in intervals of for the lanterns and for the comparison fibres. At each angle of incidence the near infrared camera was used to take images of the near field output of the photonic lantern/fibre. The range of angles was chosen so that the output flux fell to undetectable levels on both sides of centre. For the photonic lanterns the rotation of the stage was reversed after reaching the end of the range of angles and a second set of images were obtained for all angles in the range. This was done to enable a check of the repeatability of the measurements. Sequences of dark frames were also obtained before and after each sequence of near field images.
3.2 Results
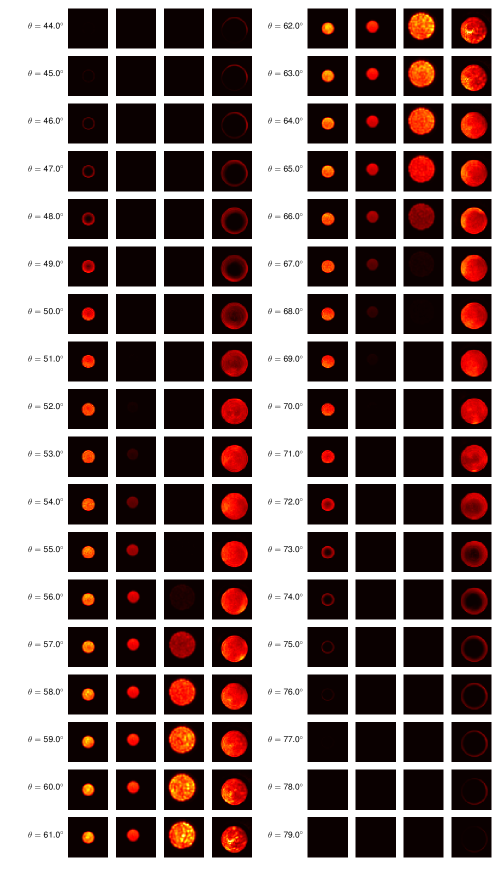
Example near field output images of both photonic lanterns and two of the comparison fibres are shown in figure 4. These images qualitatively illustrate some of the differences in behaviour between a photonic lantern and an ordinary fibre. Both of the comparison fibres show large variations of the near field illumination patterns with angle of incidence, at low angles of incidence variable modal speckle patterns can be seen (the origin of fibre modal noise) while at larger angles the output light becomes confined to increasingly narrow rings of skew rays spiralling around the core-clad interface. The 61 core PL-13-12 photonic lantern exhibits less change to the overall illumination distribution as the angle of incidence changes, we see variable modal speckle patterns but no change to the overall radial distribution (i.e. no skew rays). The 19 core GNOSIS lantern has a highly consistent and uniform near field distribution, the combination of a photonic lantern with sections of conventional multimode fibre on input and output appears to effectively homogenise the output regardless of the angle of incidence of the input. These observations hint at the potential utility of photonic lanterns for ‘fibre scrambling’, an application mentioned in section 1.
For the purposes of modelling the performance of an instrument using photonic lanterns we are primarily interested in the throughput of the lantern as a function of input angle. We estimate the throughput by dividing the total flux in the near field output images from the photonic lanterns by the total flux at the same angle of incidence from the comparison fibres. This approach was adopted due to difficulties in directly measuring the input flux because of interference and scattering effects.
GNOSIS lantern
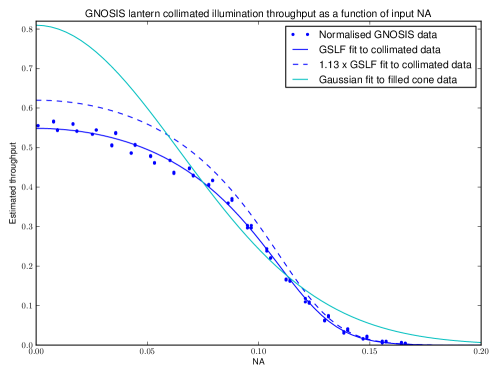
To obtain throughput estimates the total output flux data for the GNOSIS photonic lantern with the Thorlabs M16L01 fibre patch cables were divided by a spline fit to the corresponding data for the M16L01 fibre patch cables alone. The throughputs were then folded about angle of incidence and the angles converted to equivalent numerical apertures. The results are shown in figure 5.
It was found that the throughput curve could be well fit by a function of the form
| (4) |
where is the throughput, NA is the numerical aperture (), is the peak throughput, NA0, , and are the other fitting parameters and
| (5) |
We refer to this function as the Generalised Squared Logistic Function (GSLF) by analogy with the similar Generalised Logistic Function. The GSLF fit to the GNOSIS photonic lantern throughput data is plotted in figure 5 and can be seen to be a good fit. Also shown in figure 5 is the best fit Gaussian from the filled cone measurements of section 2 which clearly deviates significantly from these data at both low and high NAs. The throughput curve as inferred from the collimated illumination data is less strongly peaked and has narrower wings than the Gaussian but is not entirely flat topped or steep sided, i.e. as expected the behaviour of the photonic lantern is intermediate between that of a single mode fibre and a highly multimoded fibre.
The discrepancy between the Gaussian fit to the filled cone data and the collimated illumination data seen in figure 5 does not imply that the two sets of data are contradictory, rather it is a consequence of the poor constraints on the high and low NA throughput provided by the filled cone data. In order to test the consistency of the two data sets we performed numerical integrations of the GLSF fit to convert the results from collimated illumination throughput as a function of NA to filled cone illumination throughout as a function of focal ratio. We plot the resulting throughput curve together with the experimental filled cone data and corresponding Gaussian fit in figure 6. It can been seen that the unadjusted integrated GLSF fit is inconsistent with the filled cone data but if the throughput is scaled up by a constant factor of 1.13 the integrated GLSF fits the data at least as well as the Gaussian fit, when the error bars and suspected systematic errors are taken into account. The need to scale up the GLSF fit is unsurprising, as noted previously the GNOSIS channel used to obtain the collimated illumination data is believed to have the lowest overall throughput of the 7 in the grating unit while the filled cone data is based on mean values from measurements of all 7 channels. We conclude that both sets of data are consistent with each other and with the GLSF model and that while the Gaussian model is consistent with the filled cone data it is ruled out by the greater discriminating power of the collimated illumination data.
61 core lantern
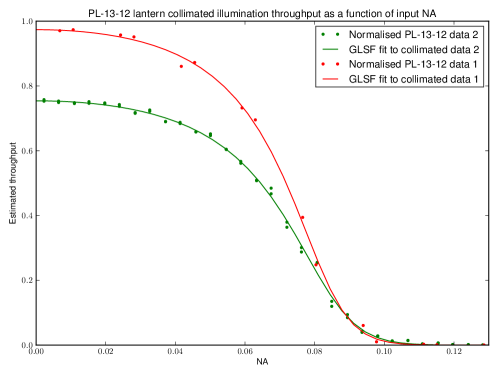
The total flux value data for the PL-13-12 61 core photonic lantern were processed in the same way as for the GNOSIS lantern. The resulting throughput estimates are shown in figure 7. Two sets of data from the are shown, an initial set with measurements taken at intervals in a single pass and using the Ocean Optics comparison fibre, and a second set with measurements taken at intervals with two passes and using the Thorlabs M15L01 comparison fibre. Also shown in figure 7 are GLSF fits to the two data sets, both are good fits. The throughput curves from the two data sets have very similar shapes but different normalisation which suggests a problem with the use of the comparison fibres for calibration. The approach used for the PL-13-12 lantern where bare lantern measurements are compared with a fibre patch cable is clearly more prone to error than that used for the GNOSIS lantern where the lantern was measured via fibre patch cables on input and output and the comparison was with the same two fibre patch cables directly connected to one another.
3.3 Analysis
Figure 8 shows a comparison of all of the collimated illumination data. In this plot the numerical aperture scale of the PL-13-12 data has been stretched by a factor of to compensate for the different fibre core size of that lantern’s multimode output (see equation 2). In normalising the plots we have, in the absence of better data, considered the GNOSIS filled cone results to be definitive, i.e. we have scaled the GNOSIS collimated illumination data up by a factor of 1.13 and scaled both of the PL-13-12 data sets so that all three sets of data have the same peak value. Note that the result is a conservative estimate of the throughput of a photonic lantern, the GNOSIS measurements that have been used for the normalisation are of an assembled FBG OH suppression unit and so incorporate losses associated with the FBGs, MMF pigtails and multiple fibre splices as well as the lantern itself. Once normalised it is apparent that the first PL-13-12 data set follows an essentially identical curve to the second PL-31-12 data set so in the subsequent analysis we only use the fit to the second, better sampled data set.
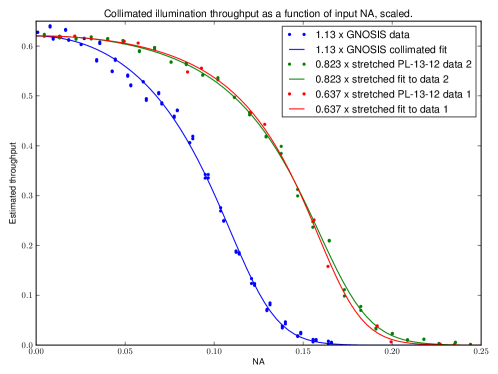
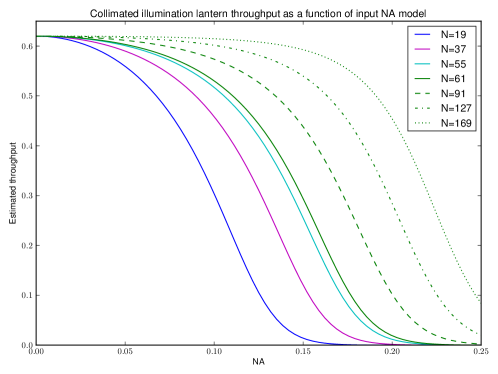
Using the rescaled GNOSIS and PL-13-12 GLSF fits shown in figure 8 we then constructed an empirical model for a general photonic lantern. The empirical model uses the GLSF of equations 4 and 5 with the peak throughput parameter equal to that in figure 8 (0.62), the shape parameters and interpolated/extrapolated from the rescaled GNOSIS and PL-13-12 values in proportion to , and the NA scaling parameter and NA width parameter interpolated/extrapolated in the same way and then multiplied by to rescale the NA axis in accordance with equation 2. Figure 9 shows the resulting model for , and equal to each of the centred hexagonal numbers from 19 to 169 and 55. We note that the shape of the throughput function evolves only gradually with , the primary effect of increasing is an overall stretch in the NA axis. Even at there is no sharp cut off, the behaviour of the model photonic lantern still differs from that of a highly multimoded MMF.
4 PRAXIS performance model
As an illustration of the application of the empirical photonic lantern model to astrophotonic instrument design we will use the PRAXIS instrument as a case study. PRAXIS is a near infrared (NIR) spectrograph intended to serve as a testbed for FBG OH suppression[17, 18]. It is a successor to the GNOSIS instrument which successfully demonstrated the suppression of OH lines by FBGs but was unable to produce a robust measurement of the resulting interline sky background due to low throughput and relatively high instrumental noise levels[14, 15]. PRAXIS will improve upon the sensitivity of GNOSIS and confirm whether the reduction in interline background expected from FBG OH suppression[2] occurs, and to what extent. In addition to accurate measurements of the sky background PRAXIS is intended to quantify the practical benefits of FBG OH suppression by undertaking observations of faint science targets. Consequently the design of PRAXIS should be optimised to produce the highest possible sensitivity to extended sources (such as the sky) without significantly compromising sensitivity to compact sources (e.g. low mass stars, high redshift galaxies). As the trade off between extended and compact source sensitivity is primarily determined by an instrument’s on sky sampling/field of view it is clear that any attempt to determine the optimum design parameters for PRAXIS must take into account the angular dependence of photonic lantern transmission. We have developed a instrument performance model of PRAXIS to enable us to predict its sensitivity and determine the optimum values of design parameters.
The PRAXIS spectrograph is fed by 19 optical fibres, 7 of which have photonic lanterns containing OH suppression FBGs. The fibres are illuminated by an integral field unit (IFU) which consists of a close packed hexagonal microlens array (MLA). The central 7 microlenses project telescope pupil images onto the 7 OH suppressed fibres, together these 7 microlens form the main entrance aperture of the instrument. The remaining 12 fibres are fed by the ring of microlens around the central 7, these fibres will be used primarily for comparison with the OH suppressed fibres. The IFU is itself illuminated with a magnified image of the sky by a fore optics unit which also includes a cold stop. The PRAXIS performance model is not a full end to end systems engineering model based on detailed optical simulation, instead it is a simplified model intended to enable efficient sampling of the design parameter space without requiring full optical design details. The model takes into account:
-
•
Atmospheric seeing
-
•
Telescope throughput
-
•
Telescope entrance pupil
-
•
Telescope point spread function (PSF)
-
•
Fore optics throughput
-
•
Microlens apertures
-
•
Diffraction from microlens apertures
-
•
Geometric FRD from microlens non-telecentricity
-
•
Photonic lantern throughput as a function of angle of incidence
-
•
Spectrograph throughput
-
•
Spectral resolution and spectrograph PSF size
-
•
Instrument thermal background
-
•
Detector quantum efficiency (QE), dark current and read out noise
The model does not take into account optical aberrations, optical misalignments, telescope pointing errors, cosmic rays or the effects of optimal spectral extraction and weighted combination of spectra, however all of these factors are expected to have small or minimal effects on the performance of PRAXIS. The PRAXIS performance model has been used to investigate and derive specifications for numerous design and performance parameters including , pupil image magnification at the fibre inputs, microlens non-telecentricity (insignificant), detector dark current, detector read noise and overall instrument thermal background. The photonic lantern empirical model was also used to place an upper limit on the thermal emissivity of the lanterns which in turn lead to a decision to cool the OH suppression unit. For the purposes of this case study we will concentrate on the results for varying on-sky sampling/field of view as these are the most directly influenced by the photonic lantern model.
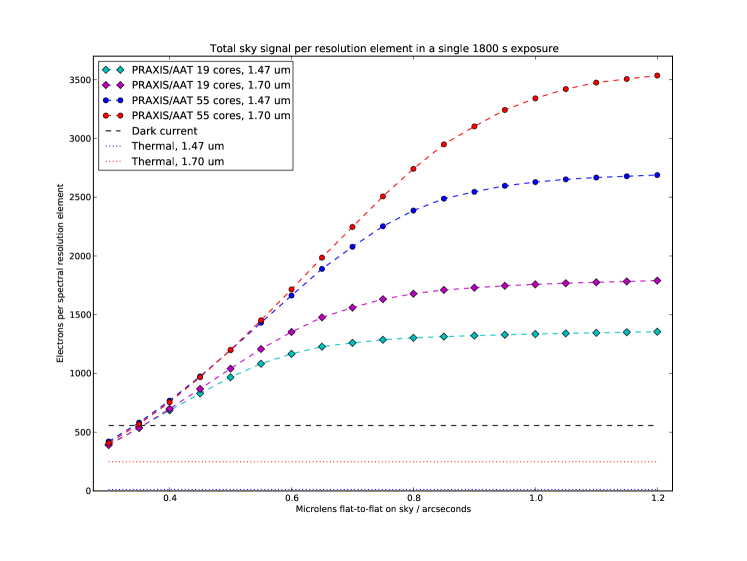
As the first purpose of PRAXIS is an accurate measurement of the sky background we will look first at the predicted sky counts for a typical single exposure of . Figure 10 shows the total detected electrons per spectral resolution element in the sky spectrum obtained by summing the signal from the 7 central fibres as a function of the on sky sampling/field of view per microlens. The calculations have been made for the Anglo-Australian Telescope (AAT) which it where the commissioning and initial use of PRAXIS will take place. Points have been calculated for two different values of , corresponds to the initial implementation of PRAXIS which will use the existing photonic lanterns that were built for GNOSIS while represents a planned upgrade of PRAXIS to use new photonic lanterns manufactured from multicore fibre[19, 20]. The calculations have also been performed for both ends of the PRAXIS wavelength range, and . The model assumes a sky surface brightness of which is the approximate interline sky brightness estimate obtained for Siding Spring Observatory from GNOSIS data[21], and a spectral resolution of . The total sky counts increase as the field of view increases before gradually levelling off. The levelling off is due to the drop off in transmission of the photonic lanterns for large angles of incidence. Figure 10 also shows the current best estimates for the detector dark current () and instrument thermal background levels (), as desired these fall below the sky counts for all fields of view per microlens .
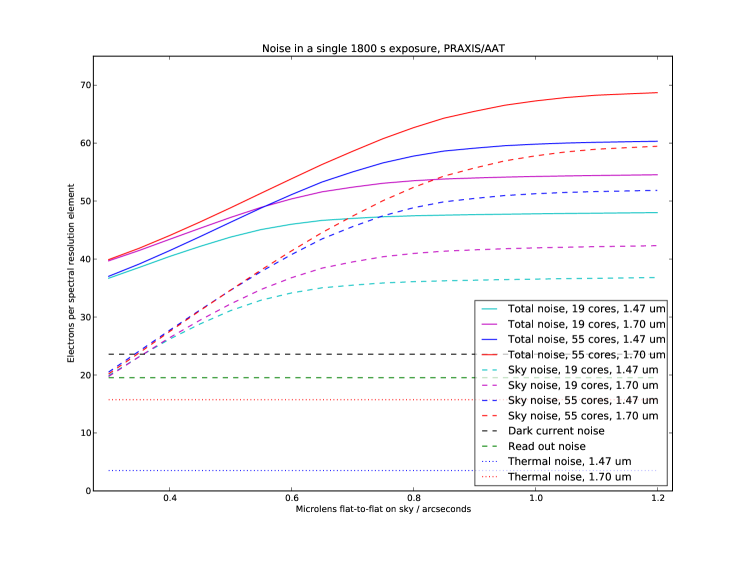
In figure 11 we look at the contributions of the various noise sources included in the model. The parameters and axes are the same as in figure 10 and the plot shows the total noise per resolution element along with the contributions from sky signal itself, the detector dark current, detector read out noise ( for multiple read mode) and instrument thermal background. We see that the Poisson noise from the sky signal is the dominant source of noise for FoV per microlens but only by margins of 2–3 over the other individual noise sources, it is clear that it is vitally important to minimise all of the instrumental sources of noise in order to ensure sky noise limited observations and so maximise sensitivity.
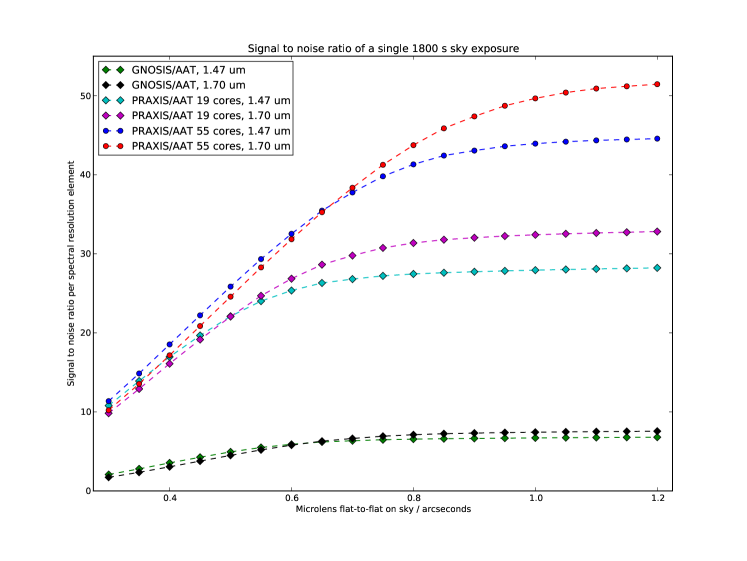
By combining the results from figures 10 and 11 we can calculate the predicted signal to noise ratio (SNR) of the summed sky spectrum, this is plotted in figure 12. The SNR of PRAXIS with is expected to reach up to for a sky surface brightness of , for the SNR can reach . We have almost made the same calculations for an instrument with the lower throughput and higher instrumental noise of GNOSIS, for this GNOSIS-like instrument the SNR does not exceed and at the FoV per microlens of as used by the actual GNOSIS instrument the SNR in a single exposure is only . These results give us confidence that PRAXIS will be able to acheive its aim of robust and accurate measurements of the interline sky background, at least for sky surface brightness levels of or more.
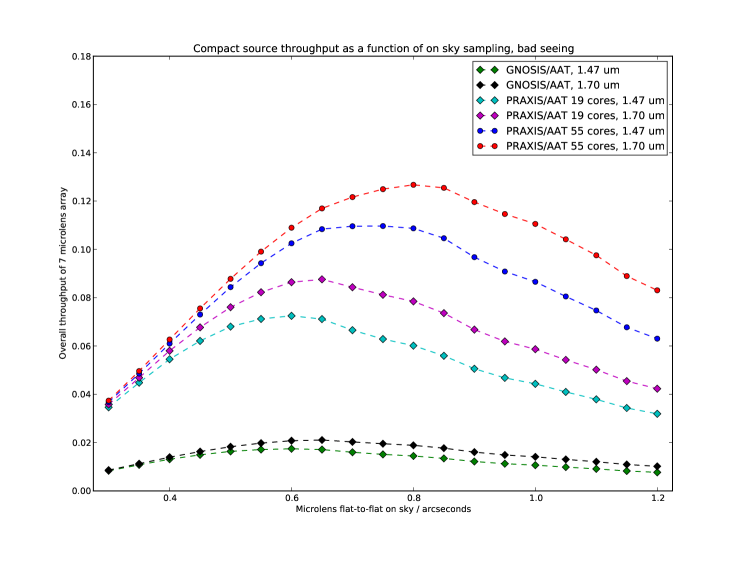
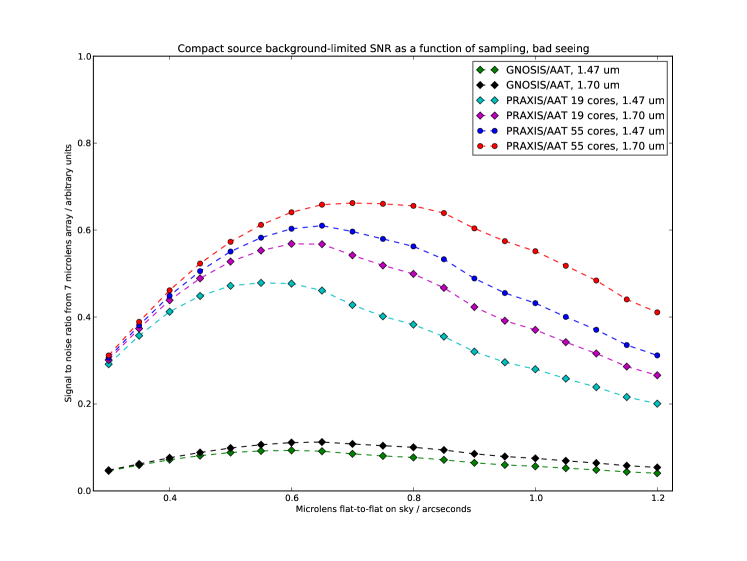
In order to confirm the optimal Fov per microlens we need to also consider observations of compact objects. Figure 13 shows the calculated overall throughput for observations of a compact source using the 7 central fibres. The source is assumed to be point like such that the observered size is determined purely by atmospheric seeing. We adopt a Gaussian seeing disc with FWHM of at , which becomes at . This is considered representative of seeing conditions at the AAT. We note that contrary to the extended source (sky) case there is a value of the FoV per microlens which maximises the received signal, and increasing the FoV per microlens further actually reduces the overall throughput. The reason for this is that the effective entrance aperture of each microlens is limited by the acceptance cone of the attached photonic lantern, consequently there comes a point at which increasing the size of the microlenses further simply opens up gaps in the effective entrance aperture of the instrument as a whole thereby reducing the overall throughput. Peaks in figure 13 do not necessarily represent the optimal values of FoV per microlens, though, because what we should be optimising is SNR rather than throughput. In principle the way SNR varies depends on the ratio between the brightness of the source and the background however we can make the reasonable assumption that the majority of targets of scientific interest will be significantly fainter than the background, i.e. the observations will be background limited. In this limit the SNR will be proportional to the ratio between the compact source throughput and the background noise (i.e. the total noise from figure 11). We plot this SNR parameter in figure 14, note that the peaks have shifted to slightly lower FoV per microlens because larger Fov results in increased sky background noise. Selecting the best FoV per microlens is still not straightforward as there is a trade off between sky/extended source sensitivity and compact source sensitivity but figures 12 and 14 do at least provide the information required for an informed decision. The PRAXIS project have selected and for and 55 respectively.
5 Further work
The photonic lantern experiments undertaken so far have measured only the total output flux (filled cone tests) or the near field output light distribution (collimated illumation tests). We intend to extend our experimental study and empirical model to also include the far field output light distribution as a function of input angle of incidence. Being able to reliably predict the angular distribution of light that will emerge from a photonic lantern will be useful for the optimised design of instrument components fed by photonic lanterns, e.g. multimode fibre bundles and spectrographs. By measuring both near and far field output light distributions as a function of input illumination we will also obtain valuable data for quantifying the ‘fibre scrambling’ effectiveness of the lanterns under test.
The measurements so far have also been restricted to only two values of , in fact only two individual lanterns for the collimated illumination tests. Both tested lanterns are of the discrete single mode fibre type[9] too, whereas photonic lanterns can also be manufactured from multicore fibre[22] or by the femtosecond laser direct write process[23]. We plan to increase the parameter space covered by our results by testing 31 and 55 core multicore type photonic lanterns in the near future.
References
- [1] Bland-Hawthorn, J. and Kern, P., “Astrophotonics: a new era for astronomical instruments,” Opt. Express 17, 1880 (2009).
- [2] Ellis, S. C. and Bland-Hawthorn, J., “The case for OH suppression at near-infrared wavelengths,” MNRAS 386, 47–64 (2008).
- [3] Bland-Hawthorn, J., Ellis, S. C., Leon-Saval, S. G., Haynes, R., Roth, M. M., Löhmannsröben, H.-G., Horton, A. J., Cuby, J.-G., Birks, T. A., Lawrence, J. S., Gillingham, P., Ryder, S. D., and Trinh, C., “A complex multi-notch astronomical filter to suppress the bright infrared sky.,” Nat. Commun. 2, 581 (2011).
- [4] Cvetojevic, N., Lawrence, J. S., Ellis, S. C., Bland-Hawthorn, J., Haynes, R., and Horton, A., “Characterization and on-sky demonstration of an integrated photonic spectrograph for astronomy,” Opt. Express 17, 18643–18650 (2009).
- [5] Allington-Smith, J. and Bland-Hawthorn, J., “Astrophotonic spectroscopy: defining the potential advantage,” MNRAS 404, 232–238 (2010).
- [6] Le Bouquin, J.-B., Berger, J.-P., Lazareff, B., Zins, G., Haguenauer, P., Jocou, L., Kern, P., Millan-Gabet, R., Traub, W., Absil, O., Augereau, J.-C., Benisty, M., Blind, N., Bonfils, X., Bourget, P., Delboulbe, A., Feautrier, P., Germain, M., Gitton, P., Gillier, D., Kiekebusch, M., Kluska, J., Knudstrup, J., Labeye, P., Lizon, J.-L., Monin, J.-L., Magnard, Y., Malbet, F., Maurel, D., Ménard, F., Micallef, M., Michaud, L., Montagnier, G., Morel, S., Moulin, T., Perraut, K., Popovic, D., Rabou, P., Rochat, S., Rojas, C., Roussel, F., Roux, A., Stadler, E., Stefl, S., Tatulli, E., and Ventura, N., “PIONIER: a 4-telescope visitor instrument at VLTI,” Astron. Astrophys. 535, A67 (2011).
- [7] Shaklan, S. and Roddier, F., “Coupling starlight into single-mode fiber optics.,” Appl. Opt. 27, 2334–8 (1988).
- [8] Coudé du Foresto, V., Faucherre, M., Hubin, N., and Gitton, P., “Using single-mode fibers to monitor fast Strehl ratio fluctuations,” Astron. Astrophys. Suppl. Ser. 145, 305–310 (2000).
- [9] Noordegraaf, D., Skovgaard, P. M., Nielsen, M. D., and Bland-Hawthorn, J., “Efficient multi-mode to single-mode coupling in a photonic lantern,” Opt. Express 17, 1988 (2009).
- [10] Leon-Saval, S. G., Argyros, A., and Bland-Hawthorn, J., “Photonic lanterns: a study of light propagation in multimode to single-mode converters,” Opt. Express 18, 8430 (2010).
- [11] Leon-Saval, S. G., Birks, T. A., Bland-Hawthorn, J., and Englund, M., “Multimode fiber devices with single-mode performance,” Opt. Lett. 30, 2545 (2005).
- [12] Olaya, J.-C., Leon-Saval, S. G., Schirdewahn, D., Ehrlich, K., Haynes, D. M., and Haynes, R., “1:61 Photonic Lanterns for Astrophotometry: a Performance Study,” MNRAS 427, 1194–1208 (2012).
- [13] Noordegraaf, D., Skovgaard, P. M. W., Sandberg, R. H., Maack, M. D., Bland-Hawthorn, J., Lawrence, J. S., and Lægsgaard, J., “Nineteen-port photonic lantern with multimode delivery fiber,” Opt. Lett. 37, 452–4 (2012).
- [14] Ellis, S. C., Bland-Hawthorn, J., Lawrence, J., Horton, A. J., Trinh, C., Leon-Saval, S. G., Shortridge, K., Bryant, J., Case, S., Colless, M., Couch, W., Freeman, K., Gers, L., Glazebrook, K., Haynes, R., Lee, S., Löhmannsröben, H.-G., O’Byrne, J., Miziarski, S., Roth, M., Schmidt, B., Tinney, C. G., and Zheng, J., “Suppression of the near-infrared OH night-sky lines with fibre Bragg gratings - first results,” MNRAS 425, 1682–1695 (2012).
- [15] Trinh, C. Q., Ellis, S. C., Bland-Hawthorn, J., Lawrence, J. S., Horton, A. J., Leon-Saval, S. G., Shortridge, K., Bryant, J., Case, S., Colless, M., Couch, W., Freeman, K., Löhmannsröben, H.-G., Gers, L., Glazebrook, K., Haynes, R., Lee, S., O’Byrne, J., Miziarski, S., Roth, M. M., Schmidt, B., Tinney, C. G., and Zheng, J., “GNOSIS: The first instrument to use fiber bragg grataings for OH suppression,” Astron. J. 145, 51 (2013).
- [16] Noordegraaf, D., Skovgaard, P. M. W., Maack, M. D., Bland-Hawthorn, J., Haynes, R., and Læ gsgaard, J., “Multi-mode to single-mode conversion in a 61 port Photonic Lantern,” Opt. Express 18, 4673 (2010).
- [17] Horton, A., Ellis, S., Lawrence, J., and Bland-Hawthorn, J., “PRAXIS: a low background NIR spectrograph for fibre Bragg grating OH suppression,” Proc. SPIE 8450, 84501V–6 (2012).
- [18] Content, R., Lawrence, J. S., Ellis, S. C., Horton, A. J., Staszak, N. F., Zhelem, R., Gers, L., Bland-Hawthorn, J., Lindley, E., Min, S.-S., Leon-Saval, S. G., Xavier, P., Haynes, R., and Shortridge, K., “PRAXIS: low thermal emission high efficiency OH suppressed fibre spectrograph,” Proc. SPIE 9151, 9151–184 (2014, in press).
- [19] Min, S.-s., Trinh, C., Leon-Saval, S., Jovanovic, N., Gillingham, P., Bland-Hawthorn, J., Lawrence, J., Birks, T. A., Roth, M. M., Haynes, R., and Fogarty, L., “Multicore fibre Bragg grating developments for OH suppression,” Proc. SPIE 8450, 84503L–10 (2012).
- [20] Haynes, R., Birks, T. A., Bland-Hawthorn, J., Cruz, J. L., Diez, A., Ellis, S. C., Haynes, D., Krämer, R. G., Mangan, B. J., Min, S., Murphy, D. F., Nolte, S., Olaya, J. C., Thomas, J. U., Trinh, C. Q., Tünnermann, A., and Voigtländer, C., “Second generation OH suppression filters usi multicore fibres,” Proc. SPIE 8450, 845011–12 (2012).
- [21] Trinh, C. Q., Ellis, S. C., Bland-Hawthorn, J., Horton, A. J., Lawrence, J. S., and Leon-Saval, S. G., “The nature of the near-infrared interline sky background using fibre Bragg grating OH suppression,” MNRAS 432, 3262–3277 (2013).
- [22] Birks, T. A., Mangan, B. J., Díez, A., Cruz, J. L., and Murphy, D. F., ““Photonic lantern” spectral filters in multi-core fiber,” Opt. Express 20, 13996–4008 (2012).
- [23] Spaleniak, I., Jovanovic, N., Gross, S., Ireland, M. J., Lawrence, J. S., and Withford, M. J., “Integrated photonic building blocks for next-generation astronomical instrumentation II: the multimode to single mode transition.,” Opt. Express 21, 27197–208 (2013).