Sub-diffraction sub-100 ps all-optical magnetic switching by passive wavefront shaping
Abstract
The recently discovered magnetization reversal driven solely by a femtosecond laser pulse has been shown to be a promising way to record information at record breaking speeds. Seeking to improve the recording density has raised intriguing fundamental question about the feasibility to combine the ultrafast temporal with sub-wavelength spatial resolution of magnetic recording. Here we report about the first experimental demonstration of sub-diffraction and sub-100 ps all-optical magnetic switching. Using computational methods we reveal the feasibility of sub-diffraction magnetic switching even for an unfocused incoming laser pulse. This effect is achieved via structuring the sample such that the laser pulse experiences a passive wavefront shaping as it couples and propagates inside the magnetic structure. Time-resolved studies with the help of photo-emission electron microscopy clearly reveal that the sub-wavelength switching with the help of the passive wave-front shaping can be pushed into sub-100 ps regime.
The ever increasing demands for faster and denser magnetic recording has been continuously fueling the search for ways to control magnetization in a medium by means other than magnetic fields. Several approaches based on excitation by intense Teraherz pulses,Tudosa et al. (2004); Kampfrath et al. (2011); Kubacka et al. (2014) electric fields,Ohno et al. (2000); Kato et al. (2004); Lottermoser et al. (2004) spin polarized currents Slonczewski (1996); Berger (1996); Katine et al. (2000); Krause et al. (2007) or strain pulses Kim et al. (2012); Kovalenko et al. (2013) have been suggested to control magnetism at time scale shorter than 100 ps. Femtosecond visible laser pulses have in particular been shown to offer extensive control from demagnetization Beaurepaire et al. (1996) to reversal,Stanciu et al. (2007) over a large range of materials, from insulators to metals, and from ferro- to antiferromagnetic orders.Kirilyuk et al. (2010)
Of particular interest for magnetic recording applications is the magnetization reversal in GdFeCo ferrimagnetic amorphous alloys induced by single femtosecond laser pulse.Stanciu et al. (2007) While a detailed microscopic understanding of this all-optical switching (AOS) phenomena is still lacking, it has been shown that it occurs via the formation of a transient ferromagnetic-like state where both the rare-earth and the transition metal magnetic moments are aligned parallel to each other, in strong contrast with the ground-state anti-parallel alignment.Radu et al. (2011) Total angular moment conservative exchange of spin moments between the two magnetic sub-lattices has been suggested to explain this ultrafast counter-intuitive magnetization dynamics Mentink et al. (2012) and experimentally observed.Bergeard et al. (2014) Such magnetization dynamics can be triggered whenever a heat load brings the magnetic sub-lattices out of their equilibrium with each other.Ostler et al. (2012)
Besides the obvious attractiveness of recording information with ultrashort femtosecond long excitations, AOS displays numerous interesting features in view of potential applications. First of all, it has been shown that rare-earth free based material properties can be engineered to display AOS.Evans et al. (2014); Mangin et al. (2014) Secondly, AOS is an energy efficient process, with less then 10 fJ of energy necessary to reverse a 2020 nm2 magnetic domain in GdFeCo.Savoini et al. (2012) Thirdly, a direct write on can be achieved using circularly polarized laser pulse and taking advantage of the magnetic circular dichroism of the recording media.Khorsand et al. (2012) Finally, laser pulses can be focused with plasmonic antenna to spot sizes of few tens of nanometer.Stipe et al. (2010); Peng (2012); Koene et al. (2012); Coppens et al. (2013) However, whether sub-diffraction limited sub-100 ps all-optical magnetization switching is feasible remains to be tested.
Here we report about the first experimental demonstration of sub-diffraction and sub-100 ps all-optical magnetization switching. Using computational methods we reveal the feasibility of sub-diffraction magnetic switching even for an unfocused incoming laser pulse. This effect is achieved via structuring the sample such that the laser pulse experiences a passive wavefront shaping as it couples and propagates inside the magnetic structure. Time-resolved studies with the help of photo-emission electron microscopy clearly reveal that the sub-wavelength switching with the help of the passive wave-front shaping can be pushed into sub-100 ps regime.
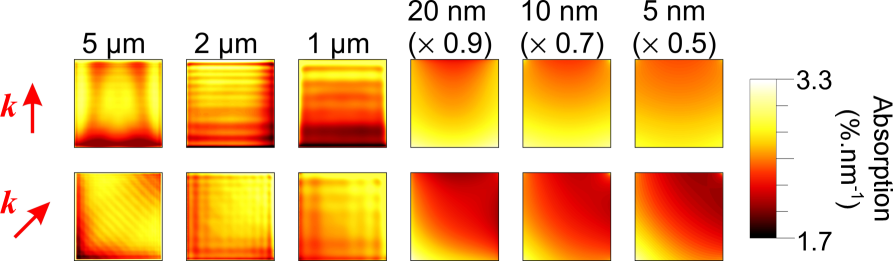
In order to demonstrate sub-wavelength all-optical magnetization switching, one would think of employing near field plasmonic antenna to focus the laser pulse down to few tens of nm.Stipe et al. (2010); Peng (2012); Koene et al. (2012); Coppens et al. (2013) However, the coupling of the laser pulse with small structures is a non trivial problem and in some cases, similar results can be achieve without the use of such plasmonic antennas. We thus investigated the electromagnetic wave propagation of a femtosecond laser pulse inside a magnetic structure using finite difference time dependent (FDTD) simulations. For the modeling, we have chosen a realistic GdFeCo multilayer structure which is known to display all-optical magnetization switching (AOS), i.e. the ability to reverse permanently its magnetization upon the sole action of a femtosecond laser pulse.Stanciu et al. (2007) The simulations were performed for different structure sizes ranging from 55 m2 down to 55 nm2 and for two different incoming azimuthal laser directions at the same 16∘ grazing incidence. The resulting light absorption profiles are shown in Fig. 1. The first striking feature is that even though the incoming laser pulse is a plane-wave with a 800 nm wavelength, i.e. orders of magnitude larger than the smallest simulated structure, the light absorption inside the structure is inhomogeneous down to the 55 nm2 structure. These absorption profiles depend on the incoming laser direction, revealing that a particularly interesting case occurs at 45∘ where the absorbed laser energy is confined within a quarter of the structure. Moreover, these absorption profiles inhomogeneities are rather strong, displaying a ratio of about 2.0 between the high and low absorption regions inside the structures down to 2020 nm2 structure size. This ratio reduces to 50% for the 1010 nm2 and 10% for the 55 nm2 structure size. On top of that, the total absorbed energy increases by a factor of 2.0 from the largest to the smallest structures, making the smaller structures more absorbing and thus more energy efficient as previously reported.Savoini et al. (2012) These focusing and coupling efficiency effects are the results of the passive wavefront shaping created by the structure’s boundaries and the interference between the waves propagating and absorbed inside the structure. It must be noted that these effects are not only present at grazing incidence but also at normal incidence as previously shown by simulation.Savoini et al. (2012) The grazing incidence geometry offers an additional degree of freedom such that depending on the orientation of the boundary with respect to the propagation wave-vector of the light pulse, different continuity relations take place, resulting in different Fresnel coefficients.Pedrotti et al. (2006) This leads, for example, to the intense side lobes seen in the 55 m2 at 0∘ incoming azimuthal direction shown in Fig. 1. Refraction, reflection and interferences of these waves occurring inside the structure, which are best seen in the 45∘ incoming direction cases, create strong intensity variations inside the structures. Strong optical absorption of light leads to the formation of these features on a small length scale of few nanometers. These simulations demonstrate that in the case of an incoming laser pulse at grazing incidence, it is possible to passively shape the laser pulse wavefront by the structure geometry such that the absorption is confined into parts of the structure which are well below the far field diffraction limit. Can this passive wave-front shaping be employed to all-optically switch a sub-diffraction limited region of a magnetic structure is the question we address next.
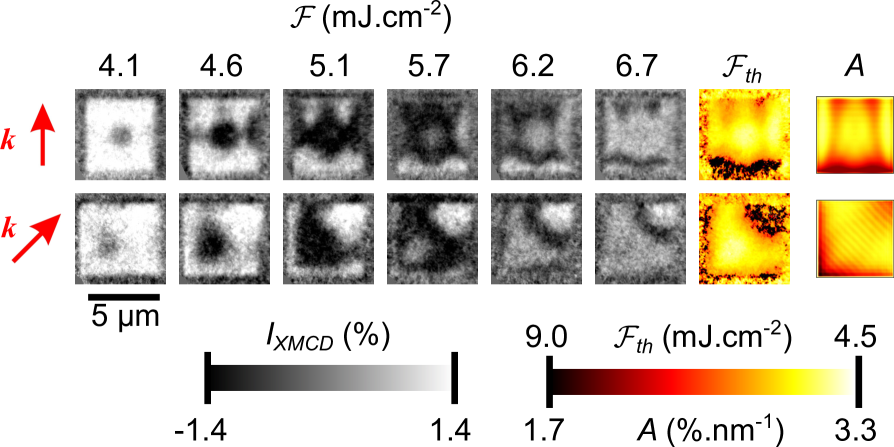
All-optical switching (AOS) occurs via the energy absorbed from the laser pulse Ostler et al. (2012) and displays a switching threshold behavior.Khorsand et al. (2012) This means that below a certain laser fluence, or better stated, below a certain absorbed energy density, only partial demagnetization occurs and the sample magnetization recovers to its initial state. Above this threshold fluence, deterministic magnetization switching occurs. At even higher fluence, the magnetization switching disappears and randomly oriented domains are created with no relation to the initial state. Thus, by investigating the spatially resolved magnetization state in GdFeCo structures after laser pulse excitation, as function of the laser fluence, it is possible to study the passive wavefront shaping and focusing experienced by the laser pulse interacting with the structure and determine whether partial magnetization switching of the structure is feasible. However, due to the low coercivity of the GdFeCo alloys, the switched domains are likely to reorganize after switching on the relevant length scale here of few hundreds of nanometer. It is therefor necessary for the sample investigated to probe the magnetization shortly after the laser pulse. For this, time-resolved X-ray magnetic circular dichroism (XMCD) photo-emission electron microscopy (PEEM) imaging was employed, which offers magnetic domain imaging with 70 ps time resolution and 100 nm spatial resolution. By fixing the time delay between the laser pump and the x-ray probe, the spatially resolved intermediate magnetization state inside a structure at that specific time delay can be recorded. The XMCD images for a 55 m2 square microstructure at = 400 ps after the laser pulse are shown in Fig. 2, as function of the incoming laser fluence, and for two different incoming laser directions indicated by the arrows (top and bottom row). It is first important to note that at this relatively long time delay of a few hundred picosecond, both the Gd and the FeCo sub-lattice magnetization are again in equilibrium with each other such that measuring only one sub-lattice is enough to characterize the sample magnetization.Radu et al. (2011) This time scale is on the other hand short enough to probe the transient longitudinal magnetization dynamics occurring, in particular whether partial or total demagnetization or magnetization switching has taken place. The initial state of this microstructure is mono-domain due to a static applied magnetic field of 50 mT and display a homogeneous white XMCD contrast. For the low fluence case of = 4.1 mJ.cm-2, one can see that the contrast is not uniform anymore, and that some partial demagnetization has occurred at the center of the structure. As the fluence is increased, the intermediate magnetization state changes, and each area within the microstructure varies from a partial demagnetization (white to grey XMCD contrast) to a full demagnetization (grey XMCD contrast) to a reversed magnetization (black contrast) and back to a demagnetization state again. This is essentially the known phase diagram of AOS with its threshold behavior as explained before.Khorsand et al. (2012) From these series of XMCD images, it is possible to estimate at which laser fluence each region inside the structure switches.
The fact that the resulting pattern completely changes with the incoming laser direction rules out an intrinsic inhomogeneous due for example to chemical inhomogeneities in the structure composition whose effects have been seen in other studies.Graves et al. (2013) It is thus not the fluence threshold that varies inside the structure but the light absorption that does, even though the laser spot size of 30 m105 m2 is much larger than the structure itself. The spatially resolved FDTD simulated light absorption inside the 55 m2 structure are shown in Fig. 2 as well. A very good qualitative agreement is obtained, as a region with a low corresponds as expected to a region with high absorption and vice versa. The agreement is even reasonably quantitative since the ratio between the high and low fluence threshold is about a factor of 2.0, in accordance with the ratio between high and low absorption. It seems thus clear that focusing by passive wavefront shaping occurs in this microstructure, and in turns creates an inhomogeneous absorption profile which leads to a spatially selective AOS.
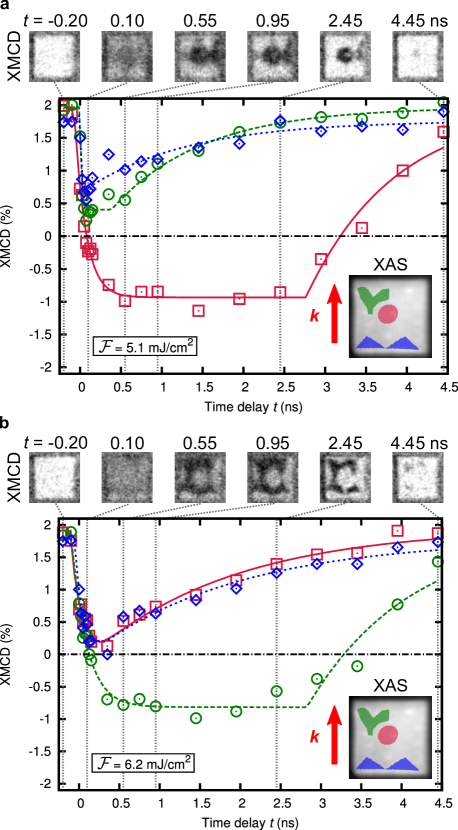
Further proof of this spatially selective AOS can be obtained by looking at the magnetization dynamics of different regions inside the structures. The spatially resolved magnetization dynamics inside a 5 m wide microstructure recorded with time-resolved XMCD PEEM are shown for two different incoming laser fluences of = 5.1 mJ.cm-2 in Fig. 3(a) and of = 6.2 mJ.cm-2 in Fig. 3(b). Three different regions of interest (ROI) have been defined, and for each, the time dependent magnetic contrast is extracted. The first ROI corresponds to a low fluence threshold , i.e. high absorption, the second ROI to an intermediate case, and the third to a high threshold, i.e. low absorption. In the case of the low incoming fluence shown in Fig. 3(a), only the first ROI shows a magnetization switching while both other regions show only a partial demagnetization. As the fluence is increased, as seen in Fig. 3(b), the picture drastically changes. Now, only the second ROI switches, while the first ROI which was switching at lower fluence now only displays a demagnetization followed by a recovery to the initial state upon cooling under the action of the applied magnetic field.
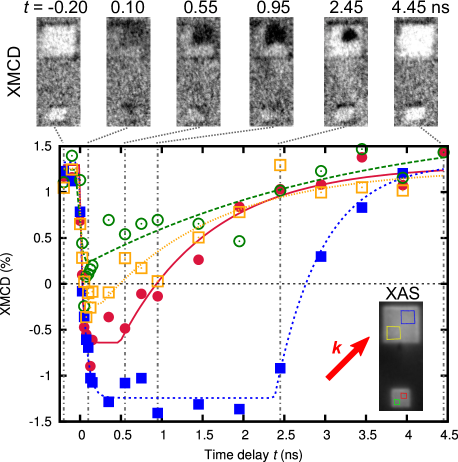
The same experiments were repeated in 22 and 11 m2 structures and the recorded magnetization dynamics are shown in Fig. 4. In these structures, the switching pattern is different than for the case of the larger 55 m2 structures because the different sizes lead to a different intensity pattern as shown by the FDTD simulations in Fig. 1. In both the 22 and 11 m2 structures, we observe simultaneously a region displaying AOS and a region displaying demagnetization followed by a quick recovery to the initial state. In the 11 m2 structure in particular, the region showing AOS is about 300 nm wide, which is interestingly smaller than the far field diffraction limit at this wavelength. This can be understood considering that the wavelength of the light propagating inside the GdFeCo layer is about 4 times smaller than in vacuum due to the GdFeCo refractive index. Experiments on smaller structures conducted at the same time were limited by the photo-emitted electron counts statistic and the instrument spatial resolution in this time-resolved mode. Nevertheless, the agreement between the FDTD simulations of the light absorption profile and the experimentally measured spatially resolved magnetization dynamics is excellent down to a 11 m2 structure and a 300 nm wide reversed magnetic domain, demonstrating the spatially selective AOS.
Thus, passive wavefront shaping performed by the structure results in inhomogeneously absorbed laser energy and is demonstrated experimentally in GdFeCo structures. It allows for a selective all-optical magnetization switching inside the microstructure, even though the incoming laser pulse is homogeneously illuminating the structure. Eventually, at the longer time scale of a few nanoseconds, the whole structure relaxes to the initial state due to the applied magnetic field. While this is a requirement here for these stroboscopic pump-probe experiments in GdFeCo samples, it is not a requirement to observe this spatially selective switching. In the case of a RE-TM alloy with a much higher magnetic anisotropy, like for example TbFeCo, the reversed pattern induced by the laser pulse inside the microstructure would be stable.Finazzi et al. (2013)
Conclusions
In conclusion, we have demonstrated, using FDTD simulations, that passive
wave-front shaping of the laser pulse by the structures shape allows
sub-diffraction focusing of the absorbed energy inside it. We have
experimentally confirmed using time-resolved XMCD PEEM imaging
that this allows sub-diffraction all-optical magnetization switching
of part of the GdFeCo structures. These results open
novel opportunities for very high density data storage media, for example by
either recording several bits of information in a single magnetic bit or by
improving the coupling efficiency between the laser pulse and the magnetic
structure.
Methods
FDTD simulations. The electromagnetic wave propagation inside the
structures was simulated with a finite-difference time domain
method.Lum Various micro- and nano-structures with squared and
circular shape were simulated. They consisted of multilayered-structures
ranging from 55 m2 down to 55 nm2. A variable three
dimensional discretization mesh was used as a function of the pattern size,
ranging from 15151 nm3 for the largest structure down to
0.10.11 nm3 for the smallest. We considered a plane wave
illumination at a wavelength = 800 nm, linearly p-polarized,
impinging on the sample with an angle of 16∘ grazing incidence
(74∘ from the normal). These settings are chosen to correspond to the
experimental conditions, where a Gaussian profile beam is used as illumination
having a FWHM much larger than the structures size. We also used a Gaussian
profile with dimensions comparable with the experimental ones, without
observing substantial differences with the simulations performed with
plane-wave illumination. The structures are sitting on a silicon substrate with
a complex index of refraction ñ = n + ik =
3.692 + 0.0065i,Palik while the upper half space is vacuum. The
structures are composed of several layers, namely, starting from the bottom
one, AlTi(10 nm)/Si3N4(5 nm)/GdFeCo(20 nm)/Si3N4(3 nm). The
refractive indexes of the layers are ñ = 2.81 +
5.89i,111Calculated after 50% of Al and 50% of Ti with the
corresponding index of refraction from Ref. Palik,
ñ = 2.0 Palik and
ñ = 3.7 + 3.856i.Koene et al. (2012) The
light absorption E where E
is the light electric field is mapped at the center of the GdFeCo layer. A good
convergence of the simulations was obtained with variable time steps smaller
than 0.1 fs and a total simulation time of about 100 fs while the
Fourier-transform limited laser pulse was about 10 fs long.
Sample preparation and microstructuring. The sample consisted of a multilayer thin-film of composition AlTi(10 nm)/Si3N4(5 nm)/Gd24Fe66.5Co9.5(20 nm)/Si3N4(3 nm) grown by magnetron sputtering on a silicon substrate and are essentially the same as in Ref. Le Guyader et al., 2012a. The structuring of these samples in squares and discs with sizes ranging from 55 m2 down to 11 m2 has been realized via electron beam lithography in combination with a lift-off process, in which a polymethylmethacrylate resist is first patterned with an electron beam writer on a Si substrate. This pattern is then transferred via lift-off after deposition by magnetron sputtering of the magnetic multilayer AlTi(10 nm)/Si3N4(5 nm)/Gd24Fe66.5Co9.5(20 nm)/Si3N4(3 nm), resulting in isolated magnetic structures.Le Guyader et al. (2012b) Unstructured areas of several 100 m, quasi-continuous films, and arrays of squares and disks down to 100 nm were fabricated onto the same sample. In the manuscript, we focus only on the 5, 2 and 1 m squares, since simulations for larger structures are too time consuming and the signal over noise ratio for smaller structures is too small.
Time-resolved XMCD PEEM measurements. Spatially resolved images of the magnetic domain states in these microstructures were obtained with the Elmitec PEEM at the Surface/Interface: Microscopy (SIM) beamline Flechsig et al. (2010) at the Swiss Light Source using the XMCD effect at the Fe L3-edge at 708 eV as a magnetic contrast mechanism. An XMCD asymmetry image is obtained by taking two total electron yield images measured with opposite x-ray helicities at resonant energies. The resulting contrast is proportional to the scalar product of the local magnetization and the incoming X-ray wave vectors,Scholl et al. (2002) that is, the more parallel the magnetization is to the x-ray wave vector, the brighter the contrast. Time-resolved measurements were performed by taking advantage of the pulsed nature of the X-rays produced by the SLS synchrotron via the gating of the detection in synchronization to an isolated x-ray pulse present in the gap of the filling pattern of the storage ring. This scheme, presented in details in Ref. Le Guyader et al., 2012c, allows stroboscopic pump-probe imaging of the sample with a time resolution determined by the 70 ps full width at half maximum (FWHM) temporal X-ray pulse length. In order to perform stroboscopic measurements, the magnetic state of the sample is recovered after each pump event thanks to a permanent magnet mounted right underneath the sample and saturating it with a magnetic field of 50 mT. The laser used for the pump is produced by an XL-500 oscillator from Femtolasers Produktions GmbH and characterized by a = 50 fs laser pulse length at = 800 nm wavelength with 500 nJ per pulse at a 5.2 MHz repetition rate. The laser is then focused on the sample at a grazing incidence of 16∘ to a spot size of FWHM = 30 m105 m2 (VH). Finally, the sample can be azimuthally rotated in situ to perform experiments with different incoming laser direction.
References
- Tudosa et al. (2004) I. Tudosa, Ch. Stamm, A. B. Kashuba, F. King, H. C. Siegmann, J. Stöhr, G. Ju, B. Lu, and D. Weller, “The ultimate speed of magnetic switching in granular recording media,” Nature 428, 831–833 (2004).
- Kampfrath et al. (2011) Tobias Kampfrath, Alexander Sell, Gregor Klatt, Alexej Pashkin, Sebastian Mährlein, Thomas Dekorsy, Martin Wolf, Manfred Fiebig, Alfred Leitenstorfer, and Rupert Huber, “Coherent terahertz control of antiferromagnetic spin waves,” Nature Photon. 5, 31–34 (2011).
- Kubacka et al. (2014) T. Kubacka, J. A. Johnson, M. C. Hoffmann, C. Vicario, S. de Jong, P. Beaud, S. Grübel, S.-W. Huang, L. Huber, L. Patthey, et al., “Large-amplitude spin dynamics driven by a THz pulse in resonance with an electromagnon,” Science 343, 1333–1336 (2014).
- Ohno et al. (2000) H. Ohno, D. Chiba, F. Matsukura, T. Omiya, E. Abe, T. Dietl, Y. Ohno, and K. Ohtani, “Electric-field control of ferromagnetism,” Nature 408, 944–946 (2000).
- Kato et al. (2004) Y. Kato, R. C. Myers, A. C. Gossard, and D. D. Awschalom, “Coherent spin manipulation without magnetic fields in strained semiconductors,” Nature 427, 50–53 (2004).
- Lottermoser et al. (2004) Thomas Lottermoser, Thomas Lonkai, Uwe Amann, Dietmar Hohlwein, Jörg Ihringer, and Manfred Fiebig, “Magnetic phase control by an electric field,” Nature 430, 541–544 (2004).
- Slonczewski (1996) J. Slonczewski, “Current-driven excitation of magnetic multilayers,” J. Magn. Magn. Mater. 159, L1–L7 (1996).
- Berger (1996) L. Berger, “Emission of spin waves by a magnetic multilayer traversed by a current,” Phys. Rev. B 54, 9353–9358 (1996).
- Katine et al. (2000) J. A. Katine, F. J. Albert, R. A. Buhrman, E. B. Myers, and D. C. Ralph, “Current-driven magnetization reversal and spin-wave excitations in Co/Cu/Co pillars,” Phys. Rev. Lett. 84, 3149–3152 (2000).
- Krause et al. (2007) S. Krause, L. Berbil-Bautista, G. Herzog, M. Bode, and R. Wiesendanger, “Current-induced magnetization switching with a spin-polarized scanning tunneling microscope,” Science 317, 1537–1540 (2007).
- Kim et al. (2012) Ji-Wan Kim, Mircea Vomir, and Jean-Yves Bigot, “Ultrafast magnetoacoustics in nickel films,” Phys. Rev. Lett. 109, 166601 (2012).
- Kovalenko et al. (2013) Oleksandr Kovalenko, Thomas Pezeril, and Vasily V. Temnov, “New concept for magnetization switching by ultrafast acoustic pulses,” Phys. Rev. Lett. 110, 266602 (2013).
- Beaurepaire et al. (1996) E. Beaurepaire, J.-C. Merle, A. Daunois, and J.-Y. Bigot, “Ultrafast spin dynamics in ferromagnetic nickel,” Phys. Rev. Lett. 76, 4250–4253 (1996).
- Stanciu et al. (2007) C. D. Stanciu, F. Hansteen, A. V. Kimel, A. Kirilyuk, A. Tsukamoto, A. Itoh, and Th. Rasing, “All-optical magnetic recording with circularly polarized light,” Phys. Rev. Lett. 99, 047601 (2007).
- Kirilyuk et al. (2010) Andrei Kirilyuk, Alexey V. Kimel, and Th Rasing, “Ultrafast optical manipulation of magnetic order,” Rev. Mod. Phys. 82, 2731–2784 (2010).
- Radu et al. (2011) I. Radu, K. Vahaplar, C. Stamm, T. Kachel, N. Pontius, H. A. Dürr, T. A. Ostler, J. Barker, R. F. L. Evans, R. W. Chantrell, et al., “Transient ferromagnetic-like state mediating ultrafast reversal of antiferromagnetically coupled spins,” Nature 472, 205–208 (2011).
- Mentink et al. (2012) J. H. Mentink, J. Hellsvik, D. V. Afanasiev, B. A. Ivanov, A. Kirilyuk, A. V. Kimel, O. Eriksson, M. I. Katsnelson, and Th. Rasing, “Ultrafast spin dynamics in multisublattice magnets,” Phys. Rev. Lett. 108, 057202 (2012).
- Bergeard et al. (2014) N. Bergeard, V. López-Flores, V. Halté, M. Hehn, C. Stamm, N. Pontius, E. Beaurepaire, and C. Boeglin, “Ultrafast angular momentum transfer in multisublattice ferrimagnets,” Nat. Commun. 5, 3466 (2014).
- Ostler et al. (2012) T. A. Ostler, J. Barker, R. F. L. Evans, R. Chantrell, U. Atxitia, O. Chubykalo-Fesenko, S. El Moussaoui, L. Le Guyader, E. Mengotti, L. J. Heyderman, et al., “Ultrafast heating as a sufficient stimulus for magnetization reversal in a ferrimagnet,” Nat. Commun. 3, 666 (2012).
- Evans et al. (2014) Richard F. L. Evans, Thomas A. Ostler, Roy W. Chantrell, Ilie Radu, and Th Rasing, “Ultrafast thermally induced magnetic switching in synthetic ferrimagnets,” Appl. Phys. Lett. 104, 082410 (2014).
- Mangin et al. (2014) S. Mangin, M. Gottwald, C-H. Lambert, D. Steil, V. Uhlíř, L. Pang, M. Hehn, S. Alebrand, M. Cinchetti, G. Malinowski, et al., “Engineered materials for all-optical helicity-dependent magnetic switching,” Nature Mater. 13, 286–292 (2014).
- Savoini et al. (2012) M. Savoini, R. Medapalli, B. Koene, A. R. Khorsand, L. Le Guyader, L. Duò, M. Finazzi, A. Tsukamoto, A. Itoh, F. Nolting, A. Kirilyuk, A. V. Kimel, and Th. Rasing, “Higly efficient all-optical switching of magnetization in GdFeCo microstructures by interference-enhanced absorption of light,” Phys. Rev. B 86, 140404 (2012).
- Khorsand et al. (2012) A. R. Khorsand, M. Savoini, A. Kirilyuk, A. V. Kimel, A. Tsukamoto, A. Itoh, and Th. Rasing, “Role of magnetic circular dichroism in all-optical magnetic recording,” Phys. Rev. Lett. 108, 127205 (2012).
- Stipe et al. (2010) Barry C. Stipe, Timothy C. Strand, Chie C. Poon, Hamid Balamane, Thomas D. Boone, Jordan A. Katine, Jui-Lung Li, Vijay Rawat, Hiroaki Nemoto, Akemi Hirotsune, Olav Hellwig, Ricardo Ruiz, Elizabeth Dobisz, Dan S. Kercher, Neil Robertson, Thomas R. Albrecht, and Bruce D. Terris, “Magnetic recording at 1.5 Pb m-2 using an integrated plasmonic antenna,” Nature Photon. 4, 484–488 (2010).
- Peng (2012) Chubing Peng, “Efficient excitation of a monopole optical transducer for near-field recording,” J. Appl. Phys. 112, 043108 (2012).
- Koene et al. (2012) Benny Koene, Matteo Savoini, Alexey V. Kimel, Andrei Kirilyuk, and Th. Rasing, “Optical energy optimization at the nanoscale by near-field interference,” Appl. Phys. Lett. 101, 013115 (2012).
- Coppens et al. (2013) Zachary J. Coppens, Wei Li, D. Greg Walker, and Jason G. Valentine, “Probing and controlling photothermal heat generation in plasmonic nanostructures,” Nano Lett. 13, 1023–1028 (2013).
- Pedrotti et al. (2006) Frank L. Pedrotti, Leno M. Pedrotti, and Leno S. Pedrotti, Introduction to Optics (3rd Edition), 3rd ed. (Benjamin Cummings, 2006).
- Graves et al. (2013) C. E. Graves, A. H. Reid, T. Wang, B. Wu, S. de Jong, K. Vahaplar, I. Radu, D. P. Bernstein, M. Messerschmidt, L. Müller, et al., “Nanoscale spin reversal by non-local angular momentum transfer following ultrafast laser excitation in ferrimagnetic GdFeCo,” Nature Mater. 12, 293–298 (2013).
- Finazzi et al. (2013) M. Finazzi, M. Savoini, A. R. Khorsand, A. Tsukamoto, A. Itoh, L. Duò, A. Kirilyuk, Th. Rasing, and M. Ezawa, “Laser-induced magnetic nanostructures with tunable topological properties,” Phys. Rev. Lett. 110, 177205 (2013).
- (31) FDTD Solutions, Lumerical Solutions Inc., Vancouver, Canada.
- (32) E. D. Palik, ed., Handbook of Optical Constants of Solids I, II and III.
- Note (1) Calculated after 50% of Al and 50% of Ti with the corresponding index of refraction from Ref. \rev@citealpPalik.
- Le Guyader et al. (2012a) L. Le Guyader, S. El Moussaoui, M. Buzzi, R. V. Chopdekar, L. J. Heyderman, A. Tsukamoto, A. Itoh, A. Kirilyuk, Th. Rasing, A. V. Kimel, and F. Nolting, “Demonstration of laser induced magnetization reversal in GdFeCo nanostructures,” Appl. Phys. Lett. 101, 022410 (2012a).
- Le Guyader et al. (2012b) L. Le Guyader, S. El Moussaoui, E. Mengotti, L. J. Heyderman, F. Nolting, A. Tsukamoto, A. Itoh, A. Kirilyuk, Th. Rasing, and A. V. Kimel, “Nanostructuring of GdFeCo thin films for laser induced magnetization switching,” Journal of the Magnetics Society of Japan 36, 21–23 (2012b).
- Flechsig et al. (2010) U. Flechsig, F. Nolting, A. Fraile Rodríguez, J. Krempaský, C. Quitmann, T. Schmidt, S. Spielmann, and D. Zimoch, “Performance measurements at the SLS SIM beamline,” AIP Conf. Proc. 1234, 319–322 (2010).
- Scholl et al. (2002) Andreas Scholl, Hendrik Ohldag, Frithjof Nolting, Joachim Stöhr, and Howard A. Padmore, “X-ray photoemission electron microscopy, a tool for the investigation of complex magnetic structures (invited),” Rev. Sci. Instrum. 73, 1362–1366 (2002).
- Le Guyader et al. (2012c) L. Le Guyader, Armin Kleibert, Arantxa Fraile Rodríguez, Souliman El Moussaoui, Ana Balan, Michele Buzzi, J. Raabe, and Frithjof Nolting, “Studying nanomagnets and magnetic heterostructures with X-ray PEEM at the Swiss Light Source,” J. Electron. Spectrosc. Relat. Phenom. 185, 371 – 380 (2012c).
Acknowledgments
This work was supported by the European Community’s Seventh Framework
Programme FP7/2007-2013 (grants NMP3-SL-2008-214469 (UltraMagnetron),
FP7-NMP-2011-SMALL-281043 (FEMTOSPIN) and 214810 (FANTOMAS)), the European
Research Council ERC Grant agreement No. 257280 (Femtomagnetism), the
Foundation for Fundamental Research on Matter (FOM) and the Technology
Foundation (STW) as well as the Netherlands Organization for Scientific
Research(NWO). Part of this work was performed at the Swiss Light Source,
Paul Scherrer Institut, Villigen, Switzerland. We thank J. Honegger for his
technical support and A. Weber for her support with the nanofabrication.
Author contributions
A.V.K., A.K., T.R., and F.N. coordinated the project.
The measurements were performed by L.L.G, S.E.M., M.B. and M.S.
Sample growth and optimization were made by A.T. and A.I. The simulations
were performed by M.S. All the authors contributed to the writing of the
manuscript.
Additional information
The authors declare no competing financial interests.