Dark Matter Mass Fraction in Lens Galaxies: New Estimates from Microlensing
Abstract
We present a joint estimate of the stellar/dark matter mass fraction in lens galaxies and the average size of the accretion disk of lensed quasars from microlensing measurements of 27 quasar image pairs seen through 19 lens galaxies. The Bayesian estimate for the fraction of the surface mass density in the form of stars is near the Einstein radius of the lenses ( effective radii). The estimate for the average accretion disk size is light days. The fraction of mass in stars at these radii is significantly larger than previous estimates from microlensing studies assuming quasars were point-like. The corresponding local dark matter fraction of 79% is in good agreement with other estimates based on strong lensing or kinematics. The size of the accretion disk inferred in the present study is slightly larger than previous estimates.
1 Introduction
The amount and distribution of dark matter relative to stars is a crucial probe of early-type galaxy structure. In particular, changes in the dark matter fraction with radius provide important information about the mechanisms of galaxy formation and the interaction of dark and baryonic matter during the initial collapse (including processes like baryonic cooling, settling, star formation and feedback) and subsequent mergers (see Diemand & Moore 2011 for a review).
But measuring this dark matter fraction is difficult. Existing estimates use X-ray observations, stellar dynamics or gravitational lensing, and each of these methods has its own advantages and difficulties. X-ray observations of the hot gas in massive galaxies can provide an estimate of the total mass under the assumption of hydrostatic equilibrium (see Buote & Humphrey, 2012). This method is very robust and simple, with its main uncertainties coming from the robustness of the hydrostatic equilibrium hypothesis, the possibility of non-thermal contributions to the pressure and contamination from emission by larger scale group/cluster halo gas. Stellar dynamics can also be used to estimate the structure of the gravitational potential (see for example Courteau et al. 2014). In this case, the structure of the orbits (anisotropy) is the primary source of uncertainty. With both X-ray and stellar dynamics it is difficult to extend the measurements to large radii.
Gravitational lensing is also a very powerful probe of dark matter because it provides direct measurements of the total mass of the system (within a certain radius) regardless of whether it is dark or baryonic. On large scales, weak lensing can be used to estimate the mass distribution in the outer parts of halos. Such studies have shown that the mass profiles at those radii are consistent with the Navarro, Frenk & White (1997) (hereafter NFW) or Einasto (1965) profiles predicted by simulations (e.g. Mandelbaum, Seljak & Irata 2008). The inner regions of galaxies are more complex, as baryons influence the mass profile and can make the halos significantly steeper (Blumenthal et al. 1986, Gnedin et al. 2004). In these inner regions, strong lensing can be used to robustly estimate the total galaxy mass within the Einstein Radius of the lens (typically 1-2 effective radii). Indeed, this estimate of the total projected mass inside the Einstein radius of the lens galaxy is very robust, and depends very weakly on the specific lens model (i.e. on the specific radial profile or the angular structure of the lens) and this can be used to statistically constrain the structure of galaxies (Rusin & Kochanek 2005). The radial mass distribution can be constrained if additional or extended images exist (e.g. Sonnenfeld et al. 2012), or by combining lensing with stellar dynamics (e.g. Romanowsky & Kochanek 1999, Koopmans et al. 2006). However, dividing the measured mass between dark matter and stars is more difficult, as it requires a model of the stellar mass. Photometry, in combination with stellar population synthesis (that can provide an estimate for the stellar M/L ratio) can be used to estimate the stellar mass distribution (see for example Jiang & Kochanek 2007, Auger et al. 2009, Tortora et al. 2010, Leier et al. 2011, Oguri et al. 2014). Nevertheless, in this procedure there is always a great uncertainty due to the IMF of the stars, particularly given recent arguments in favour of “bottom heavy” and variable IMFs (van Dokkum & Conroy 2010, 2011; Conroy & van Dokkum 2012). Examples of lensing studies are Rusin & Kochanek (2005), Koopmans et al. (2006), Auger et al. (2010), Leier et al. (2011) and Oguri et al. (2014), and these studies generally find that the integrated dark matter fraction inside the Einstein radius is roughly 0.3-0.7. Estimates of the local value at the Einstein radius are more model dependent.
Microlensing of the images of gravitationally lensed quasars provides a direct means of measuring the dark matter fraction at the location of the lensed images. Microlensing is caused by the granularities in the mass distribution created by stars and their remnants which induce time dependent changes in the flux of the lensed quasar images (see the review by Wambsganss, 2006). At any instant, they produce flux ratio anomalies that cannot be accounted for by the smooth macro model of the lens. Particularly when the stars are only a small fraction of the surface mass density, microlensing is very sensitive to the relative fractions of stars and dark matter near the images (e.g. Schechter & Wambsganss, 2004). We can therefore estimate the local fraction of mass in stars or dark matter from the statistics of microlensing. Recently, this effect has also been used to calibrate the stellar mass fundamental plane by Schechter et al. (2014).
The main practical difficulty of this method resides in the determination of the flux anomalies generated by microlensing. The problem is that the anomalies are usually identified assuming that a standard macrolens model can be used as an absolute “flux ratio” reference, without contamination by differential extinction (e.g. Falco et al. 1999, Muñoz et al. 2004) or perturbations from substructures in the lens (e.g. Dalal & Kochanek 2002, Keeton et al. 2003). One solution is to use emission line ratios, which are little affected by microlensing (e.g., Guerras et al. 2013), as a baseline to remove the effects of the macro-magnification, extinction and substructure (Mediavilla et al. 2009, hereafter MED09). There remains the problem of intrinsic source variability modulated by the lens time delays as a contribution of apparent flux anomalies. At optical wavelengths, the amplitude of quasar variability on timescales of the order of the time delays between images is rather modest, and should be a source of some extra noise rather than a significant bias on the results (see the discussion in MED09).
To date, there have been two microlensing studies of the stellar mass fraction using ensembles of lenses, and they obtained similar values for the fraction of mass in stars. MED09, using optical flux ratios of 29 images in 20 lenses, found a stellar surface density of 5%, and Pooley et al. (2012), using X-ray flux ratios of images in 14 lenses, found a fraction of 7% near the Einstein radius of the lenses. A third study based on microlensing for only three lenses by Bate et al. (2011) found much higher values, in the range 20% to 100%. There are also several microlensing results for individual lenses that usually favour dark matter dominated galaxies with stellar fractions at the image positions roughly in the range 8-25% (Keeton et al. 2006, Kochanek et al. 2006, Morgan et al. 2008, Chartas et al. 2009, Pooley et al. 2009, Dai et al. 2010b, Morgan et al. 2012). The exception to this rule is the lens Q2237+0305, where microlensing is dominated by bulge stars and is therefore compatible with nearly 100% of the surface mass density in form of stars (Kochanek 2004, Bate et al. 2011, Pooley et al. 2012). These estimates are somewhat larger than the microlensing estimates from lens samples by MED09 and Pooley et al. (2012). While it is not straightforward to compare local and integrated values for the stellar mass fractions, there also seems to be an apparent discrepancy between the low local values of 0.05-0.07 determined by the microlensing samples and the (integrated) values of 0.3-0.7 estimated by other means.
The studies of microlensing in individual lenses are largely focussed on measuring the sizes of quasar emission regions, with the dark matter fraction as a “nuisance” parameter, so the source size is included as an unknown in the calculations, while the two large statistical microlensing studies (MED09, Pooley et al. 2012) were done under the hypothesis that the size of the source is very small compared to the Einstein radii of the microlenses. At the time of these studies, it seemed plausible that source sizes were small enough to be neglected, although MED09 did point out that there was a clear covariance in the sense that larger source sizes lead to larger stellar mass fractions. Recent estimates of quasar accretion disk sizes (see, e.g., Morgan et al. 2008, 2010, 2012, Blackburne et al. 2011, Mediavilla et al. 2011b, Muñoz et al. 2011, Jiménez-Vicente et al. 2012, 2014, Motta et al. 2012, Mosquera et al. 2013) are large enough to mean that finite source sizes cannot be ignored. Similarly, quasar size estimates are also dependent on the fraction of mass in microlenses. Here, we carry out a joint analysis of both. In Section 2 we describe the statistical analysis of the data based on microlensing simulations using magnification maps. In Section 3 we compare the results with previous studies and discuss the possible implications.
2 Statistical analysis and results
We use the microlensing magnification estimates for 27 quasar image pairs in 19 lens systems from MED09. In order to have the largest possible sample but with a similar range of observed rest wavelengths, we include all objects from MED09 with magnifications measured in the wavelength range between (1216 Å) and Mg II (2798 Å).With this choice, the average rest wavelength is Å, while we still keep 27 out of 29 image pairs from 19 out of 20 lensed quasars. Only the system RXS J11311231 is excluded, as it was observed in [OIII], at a much larger wavelength of 5000 Å. These microlensing magnification estimates are calculated after subtracting the emission line flux ratios, which are little affected by microlensing (see e.g. Guerras et al. 2013), from the continuum flux ratios, and are therefore virtually free from extinction, substructure and macro model effects (as these affect the line and continuum flux ratios equally). Our strategy is to compare the observed microlensing magnification for a given image pair with a statistical sample of simulated values for that measurement as a function of the source size () and the fraction of surface mass density in stars (). This will allow us to calculate the likelihood of the parameters given the observations . The procedure is repeated for each of the 27 image pairs. We calculate magnification maps for each image using a grid with 11 values for the fraction of the surface mass density in stars, , logarithmically distributed between 0.025 and 0.8 as with . The 517 magnification maps were created using the Inverse Polygon Mapping algorithm described by Mediavilla et al. (2006, 2011a). We used equal mass microlenses of . All linear sizes can be scaled for a different microlens mass as . The maps have a size of pixels, with a pixel size of 0.5 light-days. The maps therefore span 1000 light-days. The individual sizes of maps and pixels in (more natural) units of Einstein radii for microlenses of are given in Table 1. On average, the maps span approximately 50 Einstein radii, with a pixel scale of roughly 0.025 Einstein radii.
| Object | Pair | Map size in | Pixel size in | ||
|---|---|---|---|---|---|
| HE00471756 | BA | -0.19 | 1.63aaFrom Oguri et al. (2014) | 44.61 | 0.022 |
| HE04351223 | BA | -0.24 | 1.60aaFrom Oguri et al. (2014) | 47.32 | 0.024 |
| CA | -0.30 | ||||
| DA | 0.09 | ||||
| HE05123329 | BA | -0.40 | 79.08 | 0.039 | |
| SDSS0806+2006 | BA | -0.47 | 3.30aaFrom Oguri et al. (2014) | 54.97 | 0.027 |
| SBS0909+532 | BA | -0.60 | 1.02bbFrom Sluse et al. (2012) | 77.88 | 0.039 |
| SDSS0924+0219 | BA | 0.00 | 2.93aaFrom Oguri et al. (2014) | 44.09 | 0.022 |
| FBQ0951+2635 | BA | -0.69 | 0.72bbFrom Sluse et al. (2012) | 35.61 | 0.018 |
| QSO0957+561 | BA | -0.30 | 1.29ccFrom Fadely et al. (2010) | 32.93 | 0.022 |
| SDSS1001+5027 | BA | 0.23 | 40.76 | 0.020 | |
| SDSSJ1004+4112 | BA | 0.00 | 59.11 | 0.030 | |
| CA | 0.45 | ||||
| Q101720 | BA | -0.26 | 1.46ddFrom Lehár et al. (2000) | 60.69 | 0.030 |
| HE11041805 | BA | 0.60 | 2.19aaFrom Oguri et al. (2014) | 58.74 | 0.029 |
| PG1115+080 | A2A1 | -0.65 | 2.48aaFrom Oguri et al. (2014) | 38.46 | 0.019 |
| SDSS1206+4332 | AB | -0.56 | 68.12 | 0.034 | |
| SDSS1353+1138 | AB | 0.00 | 38.03 | 0.019 | |
| HE1413+117 | BA | 0.00 | 61.16 | 0.034 | |
| CA | -0.25 | ||||
| DA | -0.75 | ||||
| BJ1422+231 | AB | 0.16 | 2.29aaFrom Oguri et al. (2014) | 51.18 | 0.026 |
| CB | 0.02 | ||||
| DB | -0.08 | ||||
| SBS1520+530 | BA | -0.39 | 0.96bbFrom Sluse et al. (2012) | 60.15 | 0.030 |
| WFIJ20334723 | BC | -0.50 | 1.56aaFrom Oguri et al. (2014) | 58.81 | 0.029 |
| A2A1 | 0.00 |
Note. — Microlensing Einstein radii used in columns 5 and 6 correspond to microlenses of .
The source size is taken into account by modelling the source brightness profile as a Gaussian, . Mortonson et al. (1995) show that the specific shape of the radial profile is not important for microlensing studies because the results are essentially controlled by the half-light radius rather than the detailed profile. The Gaussian size is related to the half-light radius by . To account for the source size, we convolve the magnification maps with Gaussians of 16 different sizes over a logarithmic grid, with , which spans to light-days. From the maps for a pair of images of a given lensed quasar with fraction of stars and convolved to size , we can calculate the likelihood of the parameters given the observed microlensing magnifications as
| (1) |
where
| (2) |
and is a characteristic value for the error in the observed microlensing magnification (which we have set to 0.15 magnitudes). For each image pair, the summation in Equation 1 is performed over trials by sampling the magnification map of each image at positions and summing over all possible combinations. This procedure is repeated for the 176 possible values of the pairs, producing a 2D likelihood function for image pair . The process is repeated for each of the 27 pairs in our sample. As we are using single epoch microlensing, the results for individual pairs/objects have large uncertainties.
Since there is little signal in the individual pair likelihoods, we combine the 27 likelihood distributions to produce a joint likelihood function
| (3) |
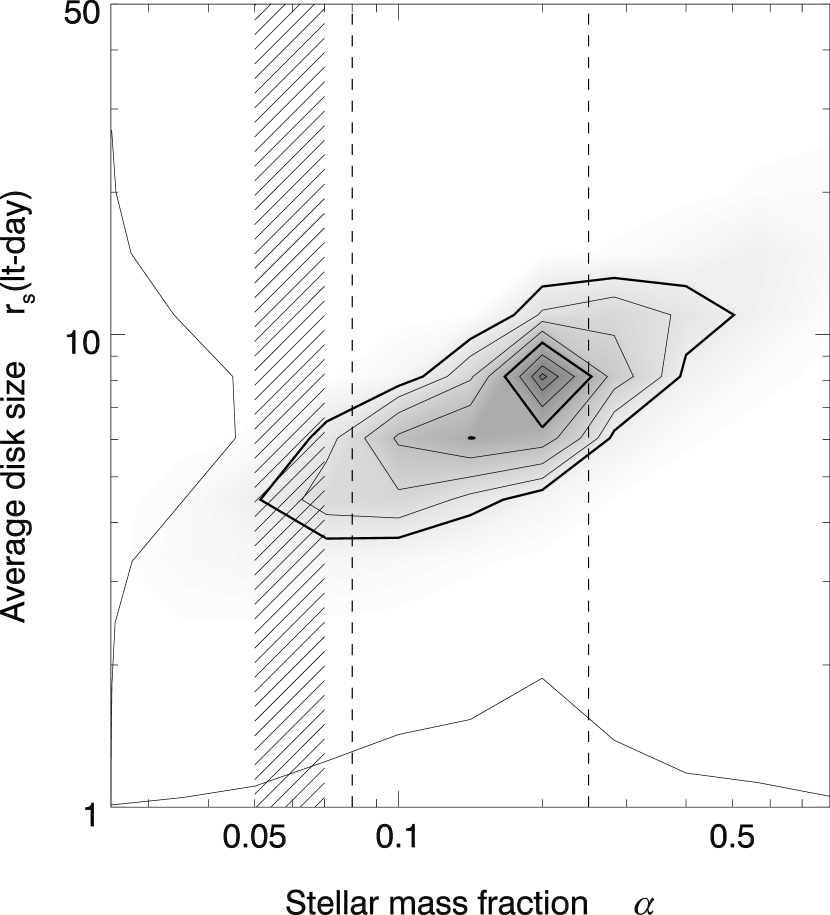
The results of this procedure are shown in Figure 1. The expected covariance between size and stellar mass fraction found by MED09 can be clearly seen, but we find a well defined maximum in the likelihood distribution. The maximum likelihood estimate for the (average) mass fraction in stars is (at 68% confidence level) and for the accretion disk size it is light days or, equivalently, light days (for microlenses of 0.3 and at a rest wavelength of roughly 1736 Å). This value for the size of the accretion disk is roughly 50%-100% larger than previously reported values but within the range of uncertainties (cf. Morgan et al. 2008, 2012, Blackburne et al. 2011, Mediavilla et al. 2011b, Muñoz et al. 2011, Jiménez-Vicente et al. 2012, 2014, Motta et al. 2012, Mosquera et al. 2013).
Figure 1 also shows the posterior probabilities for the two parameters in a Bayesian estimate with logarithmic priors on the accretion disk size and the stellar mass fraction. In this case we have with and . From these posterior probability distributions we find Bayesian estimates of at 68% confidence, and light days for microlenses of 0.3, or light days, slightly smaller than the maximum likelihood estimates. If we increase the uncertainties to mag, we find no significant changes in the estimates of the parameters. We also recomputed the results sequentially dropping each lens and found that the results are not dominated by any single system.
3 Discussion and conclusions
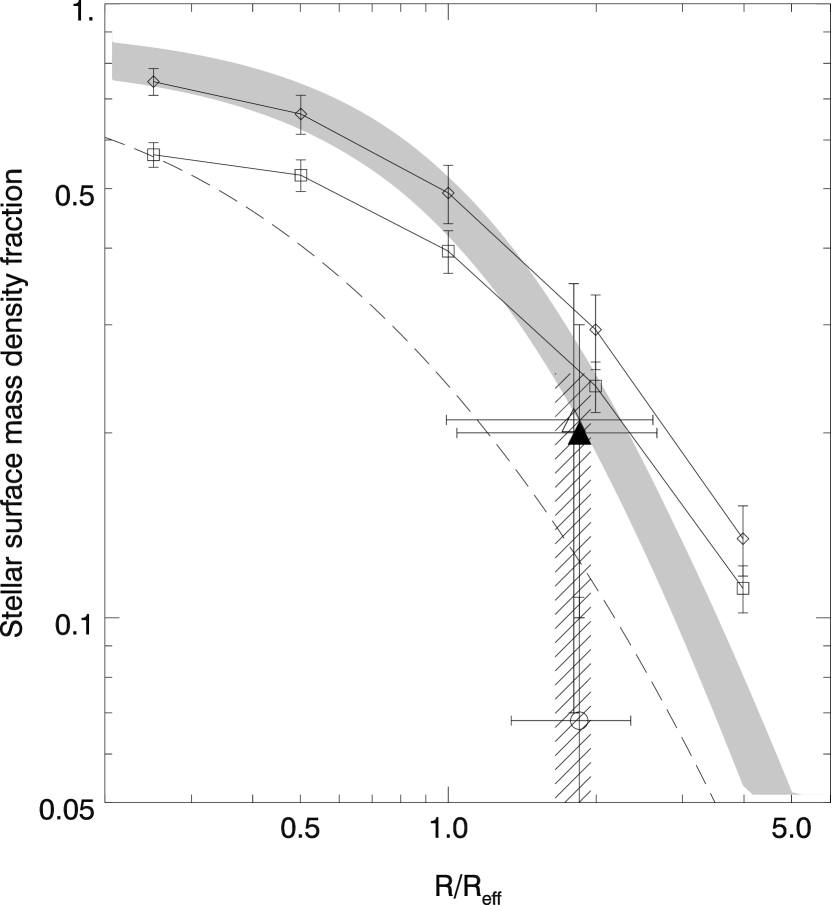
With our joint analysis of stellar mass fraction and source size, we find a larger stellar mass fraction than earlier statistical studies. In Figure 2 we compare our determination of the stellar surface density fraction to a simple theoretical model and to the best fit to a sample of lens galaxies by Oguri et al. (2014). The simple theoretical model is the early-type galaxy equivalent of a maximal disk model for spirals. We follow the rotation curve of a de Vaucouleurs component for the stars outwards in radius until it reaches its maximum and then simply extend it as a flat rotation curve to become a singular isothermal sphere (SIS) at large radius (see details in Appendix A). The ratio of the surface mass density of the de Vaucouleurs component to the total surface mass density is shown as a dashed curve in Figure 2. We also show as a grey band the best fit for the stellar fraction in form of stars determined by Oguri et al (2014) in a study of a large sample of lens galaxies using strong lensing and photometry as well as the best model using a Hernquist component for the stars and an NFW halo for the dark matter with and without adiabatic contraction also from Oguri et al. (2014). We have used the average and dispersion estimates for the Einstein and effective radii available for 13 of the objects in our sample from Oguri et al. (2014), Sluse et al. (2012), Fadely et al. (2010) and Lehár et al. (2000) (see Table 1) as an estimate of in Figure 2. The average value and dispersion of the sample is . This also averages over the different radii of the lensed images. The agreement of our estimates with the expectations of the simple theoretical model and with estimates from other studies (Oguri et al. 2014) is quite good. For comparison, the estimate of Pooley et al. (2012) (using the Einstein and effective radii estimates for 10 out of 14 of their objects from Schechter et al. 2014) seems somewhat lower than expected at those radii. The range of stellar mass fractions from MED09 for source sizes in the range 0.3-15.6 light days is also shown in Figure 2. In this case, the discrepancy between our estimate and their reported value of is completely due to the effect of the source size. Although accretion disk sizes are known to be smaller in X-rays, recent estimates are in the range 0.1-1 light-days, depending on the mass of the black hole (cf. Mosquera et al. 2013), and these finite sizes will increase the stellar surface densitites implied by the X-ray data. Another possible origin for this discrepancy is that Pooley et al. (2012) use the macro model as an unmicrolensed baseline for their analysis. It is well known that simple macro models are good at reproducing positions of images, but have difficulties reproducing the flux ratios of images due to a range of effects beyond microlensing. Recently, Schechter et al. (2014) found that the fundamental plane stellar mass densities have to be scaled up by a factor 1.52 in order to be compatible with microlensing in X-rays in a sample of lenses with a large overlap with that analyzed by Pooley et al. (2012). It is unclear how this need for more mass in stars at the position of the images found by Schechter et al. (2014) can be reconciled with the apparently low estimate of mass in stars at those radii by Pooley et al. (2012). Our estimate of the stellar mass fraction agrees better with the results of microlensing studies of individual lenses (Keeton et al. 2006, Kochanek et al. 2006, Morgan et al. 2008, Chartas et al. 2009, Pooley et al. 2009, Dai et al. 2010b, Morgan et al. 2012) which reported values in the range 8-25%, and with the estimates from strong lensing studies (see for example Jiang & Kochanek 2007, Gavazzi et al. 2007, Treu 2010, Auger et al. 2010, Treu et al. 2010, Leier et al. 2011, Oguri et al. 2014) which produced stellar mass fractions in the range 30-70% integrated inside the Einstein radius of the lenses.
The estimated size of the accretion disk in this work is slightly larger than the results found by other authors but still compatible with them (cf. Morgan et al. 2008, Blackburne et al. 2011, Mediavilla et al. 2011b, Muñoz et al. 2011, Jiménez-Vicente et al. 2012, 2014, Motta et al. 2012, Mosquera et al. 2013). Those studies find values roughly in the range of 4-5 light-days. Thus, our present estimate for the size of the accretion disk, mantains the discrepancy with the simple thin disk model (Shakura & Sunyaev, 1973) that predicts accretion disks of sizes roughly 2-3 times smaller. Spectroscopy (preferably at several epochs) for a larger sample of lens systems would allow us to expand the sample and to extend its conclusions. A larger sample could also be divided into statistically significant suitable subsamples, to examine the dependence of the stellar mass fraction on radius, lens mass or redshift, questions which are difficult to probe by other means.
Appendix A A simple theoretical model for the local stellar mass fraction in lens galaxies
We describe here the simple theoretical model shown as a dashed curve in Figure 2. In this model, the stars are distributed according to a de Vaucouleurs model. We will use units of the effective radius of this de Vaucouleurs system so that . The surface density of stars is given by the de Vaucouleurs law:
| (A1) |
with . is the stellar surface mass density at the galaxy center. The mass enclosed within radius in this system is given by:
| (A2) |
where (cf. Maoz & Rix, 1993). The rotation curve of this stellar system (in units in which ) is given by . Let be the maximum of the rotation curve of this stellar system. We model the total mass of the lens galaxy as an SIS with a (flat) rotation curve equal to that . The total mass of the system has therefore a surface mass density given by:
| (A3) |
and the (local) fraction of mass in form of stars, which is represented as a dashed line in Figure 2 is the ratio of the stellar to total mass surface densities, . Note that so that is independent of the value of .
References
- Auger et al. (2009) Auger, M. W., Treu, T., Bolton, A. S. et al. 2009, ApJ, 705, 1099
- Auger et al. (2010) Auger, M. W., Treu, T., Bolton, A. S. et al. 2010, ApJ, 724, 511
- Bate et al. (2011) Bate, N. F., Floyd, D. J. E., Webster, R. L., Wyithe, J. S. B. 2011, ApJ, 731, 71
- Blumenthal et al. (1986) Blumenthal, S. M., Faber, R., Flores, Primack, J. R. 1986, ApJ, 301, 27
- Buote & Humphrey (2012) Buote, D. A. & Humphrey, P. J. 2012, Hot Interstellar Matter in Elliptical Galaxies (Astrophysics and Space Science Library), Vol. 378, ed. D.-W. Kim & S. Pellegrini (Berlin: Springer), 235
- Chartas et al. (2009) Chartas, G., Kochanek, C. S., Dai, X., Poindexter, S., Garmire, G. 2009, ApJ, 693, 174
- Conroy & van Dokkum (2012) Conroy, C., van Dokkum, P. G. 2012, ApJ, 747, 69
- Courbin et al. (2011) Courbin, F., Chantry, V., Revaz, Y. et al. 2011, A&A, 536, A53
- Courteau et al. (2014) Courteau, S., Cappellari, M., de Jong, R. S. et al. 2014, RvMP, 86, 47
- Dai et al. (2010a) Dai, X., Bregman, J. N., Kochanek, C. S., Rasia, E. 2010a, ApJ, 719, 119
- Dai et al. (2010b) Dai, X., Kochanek, C. S., Chartas, G. et al. 2010b, ApJ, 709, 278
- Dalal & Kochanek (2002) Dalal, N., & Kochanek, C. S. 2002, ApJ, 572, 25
- Diemand & Moore (2011) Diemand, J., Moore, B. 2011, Advanced Science Letters, Volume 4, Number 2, February 2011, pp. 297-310
- Einasto (1965) Einasto J. 1965, Trudy Astrofizicheskogo Instituta Alma-Ata, 5, 87
- Fadely et al. (2010) Fadely, R., Keeton, C. R., Nakajima, R., Bernstein, G. M. 2010, ApJ, 711, 246
- Falco et al. (1999) Falco, E. E., Impey, C. D., Kochanek, C. S. et al. 1999, ApJ, 523, 617
- Gavazzi et al. (2007) Gavazzi, R., Treu, T., Rhodes, J. D. et al. 2007, ApJ, 667, 176
- Gnedin et al. (2004) Gnedin, O. Y., Kravtsov, A. V., Klypin, A. A., Nagai, D. 2004, ApJ, 616, 16
- Gonzalez et al. (2013) Gonzalez, A. H., Sivanandam, S., Zabludoff, A. I., Zaritsky, D. 2013, ApJ, 778, 14
- Guerras et al. (2013) Guerras, E., Mediavilla, E., Jiménez-Vicente, J., et al. 2013, ApJ, 746, 160
- Jiang & Kochanek (2007) Jiang, G., Kochanek, C. S. 2007, ApJ, 671, 1568
- Jiménez-Vicente et al. (2012) Jiménez-Vicente, J., Mediavilla, E., Muñoz, J. A., & Kochanek, C. S. 2012, ApJ, 751, 106
- Jiménez-Vicente et al. (2014) Jiménez-Vicente, J., Mediavilla, E., Kochanek, C. S. et al. 2014, 783, 47
- Keeton et al. (2003) Keeton, C. R., Gaudi, B. S., Petters, A. O. 2003, ApJ, 598, 138
- Keeton et al. (2006) Keeton, C. R., Burles, S., Schechter, P. L., & Wambsganss, J. 2006, ApJ, 639, 1
- Kochaneck (2004) Kochanek, C. S. 2004, ApJ, 605, 58
- Kochanek et al. (2006) Kochanek, C. S., Morgan, N. D., Falco, E. E. et al. 2006, ApJ, 640, 47
- Koopmans et al. (2006) Koopmans, L. V. E., Treu, T., Bolton, A. S., Burles, S., Moustakas, L. A. 2006, ApJ, 649, 599
- Lehár et al. (2000) Lehár, J., Falco, E. E., Kochanek, C. S. et al. 2000, ApJ, 538, 584
- Leier et al. (2011) Leier, D., Ferreras, I., Saha, P., Falco, E. E. 2011, ApJ, 740, 97
- Mandelbaum, Seljak & Irata (2008) Mandelbaum, R., Seljak, U., Hirata, C. M. 2008, JCAP, 08, 006
- Maoz & Rix (1993) Maoz, D. & Rix, H.-W. 1993, ApJ, 423, 425
- Mediavilla et al. (2009) Mediavilla, E., Muñoz, J. A., Falco, E., et al. 2009, ApJ, 706, 1451
- Mediavilla et al. (2011a) Mediavilla, E., Mediavilla, T., Muñoz, J. A., et al. 2011a, ApJ, 741, 42
- Mediavilla et al. (2011b) Mediavilla, E., Muñoz, J. A., Kochanek, C. S., et al. 2011b, ApJ, 730, 16
- Morgan et al. (2008) Morgan, C. W., Kochanek, C. S., Dai, X., Morgan, N. D., Falco, E. E. 2008, ApJ, 689, 755
- Morgan et al. (2010) Morgan, C. W., Kochanek, C. S., Morgan, N. D., Falco, E. E. 2010, ApJ, 712, 1129
- Morgan et al. (2012) Morgan, C. W., Hainline, L. J., Chen, B. et al. 2012, ApJ, 756, 52
- Mortonson et al. (2005) Mortonson, M. J., Schechter, P. L., & Wambsganss, J. 2005, ApJ, 628, 594
- Mosquera et al. (2013) Mosquera, A. M., Kochanek, C. S., Chen, B., Dai, X., Blackburne, J. A., Chartas, G. 2013, ApJ, 769, 53
- Motta et al. (2012) Motta, V., Mediavilla, E., Falco, E., & Munoz, J. A. 2012, ApJ, 755, 82
- Muñoz et al. (2004) Muñoz, J. A., Falco, E. E., Kochanek, C. S., McLeod, B. A., & Mediavilla, E. 2004, ApJ, 605, 614
- Navarro, Frenk & White (1997) Navarro, J. F., Frenk, C. S., White, S. D. M. 1997, ApJ, 490, 493
- Oguri, Rusu & Falco (2014) Oguri, M., Rusu, C. E., Falco, E. E. 2014, MNRAS, 439, 2494
- Planck (2013) Planck Collaboration, Ade P. A. R. et al. 2013, arXiv:1303.5076
- Pooley et al. (2009) Pooley, D., Rappaport, S., Blackburne, J. A., et al. 2009, ApJ, 697, 1892
- Pooley et al. (2012) Pooley, D., Rappaport, S., Blackburne, J. A.; Schechter, P. L., Wambsganss, J. 2012, ApJ, 744, 111
- Romanowsky & Kochanek (1999) Romanowsky, A. J., Kochanek, C. S. 1999, ApJ, 516, 18
- Rusin & Kochanek (2005) Rusin, D., Kochanek, C. S. 2005, ApJ. 623, 666
- Schechter et al. (2014) Schechter, P. L., Pooley, D., Blackburne, J. A., Wambsganss, J. 2014, arXiv:1405.0038
- Schechter & Wambsganss (2004) Schechter, P. L., & Wambsganss, J. 2004, in IAU Symposium, Vol. 220, Dark Matter in Galaxies, ed. S. Ryder, D. Pisano, M. Walker, & K. Freeman, Ast. Soc. of the Pacific, 103
- Shakura & Sunyaev (1973) Shakura, N. I. & Sunyaev, R. A. 1973, A&A, 24, 337
- Sluse et al. (2012) Sluse, D., Chantry, V., Magain, P., Courbin, F., Meylan, G. 2012, A&A, 538, A99
- Sonnenfeld et al. (2012) Sonnenfeld, A., Treu, T., Gavazzi, R. et al. 2012, ApJ, 752, 163
- Tortora et al. (2010) Tortora, C., Napolitano, N. R., Romanowsky, A. J., Jetzer, P. 2010, ApJ, 721, L1
- Treu (2010) Treu, T. 2010, ARA&A, 48, 87
- Treu et al. (2010) Treu, T., Auger, M. W., Koopmans, L. V. E. et al. 2010, ApJ, 709, 1195
- van Dokkum & Conroy (2010) van Dokkum, P. G., Conroy, C. 2010, Nature, 468, Iss. 7326, 940
- van Dokkum & Conroy (2011) van Dokkum, P. G., Conroy, C. 2011, ApJ, 735, L13
- Wambsganss (2006) Wambsganss, J. 2006, Saas-Fee Advanced Course 33: Gravitational Lensing: Strong, Weak and Micro, 453