Coexistence of Bloch electrons and glassy electrons in Ca10(Ir4As8)(Fe2-xIrxAs2)5 revealed by angle-resolved photoemission spectroscopy
Abstract
Angle-resolved photoemission spectroscopy of Ca10(Ir4As8)(Fe2-xIrxAs2)5 shows that the Fe 3 electrons in the FeAs layer form the hole-like Fermi pocket at the zone center and the electron-like Fermi pockets at the zone corners as commonly seen in various Fe-based superconductors. The FeAs layer is heavily electron doped and has relatively good two dimensionality. On the other hand, the Ir 5 electrons are metallic and glassy probably due to atomic disorder related to the Ir 5 orbital instability. Ca10(Ir4As8)(Fe2-xIrxAs2)5 exhibits a unique electronic state where the Bloch electrons in the FeAs layer coexist with the glassy electrons in the Ir4As8 layer.
pacs:
75.30.Fv, 75.30.Gw, 74.25.Jb, 79.60.-iThe discoveries of the superconductivity in the layered LaOFeP Kamihara2006 and LaOFeAs Kamihara2008 systems have induced intensive research activities on the physical properties of Fe pnictides. The Fe pnictide superconductors commonly have the FeAs layers, where each Fe ion is tetrahedrally coordinated by four pnictogen ions and the Fe ions form a square lattice. The FeAs layers are separated by the spacer layers such as LaO, and modifications of the spacer layers often play essential roles in control of the superconducting properties of the FeAs layers. Recently, Ca10(Pt4As8)(Fe2-xPtxAs2)5 with Pt4As8 spacer layer has been discovered Kakiya2011 ; Ni2011 ; Lohnert2011 and has been attracting great interest due to a possible interplay between the Pt4As8 layer and the FeAs layer. Ca10(Pt4As8)(Fe2-xPtxAs2)5 exhibits superconductivity at 38 K and the Pt4As8 spacer layer is considered to provide electrons to the superconducting FeAs layer. The Pt4As8 spacer layer consists of PtAs4 square-planar geometry and is predicted to be metallic. Namely, the Pt 5 orbitals hybridize with the Fe 3 states at the Fermi level (). However, such hybridization between the Pt 5 and Fe 3 orbitals at is not clearly observed by angle-resolved photoemission spectroscopy (ARPES), indicating that the Pt4As8 spacer layer is semiconducting. Neupane2012 ; Thirupathaiah2013 On the other hand, another recent ARPES study has shown that the Pt 5 states have small contribution to the Fermi surfaces, partly consistent with the theoretical prediction. Shen2013 In case of Ca10(Pt4As8)(Fe2-xPtxAs2)5, the contribution of the Pt 5 states at is rather small even though it may exist as predicted by the theory.
Isostructural Ca10(Ir4As8)(Fe2-xIrxAs2)5 is another member of the iron-based superconductors with = 16 K. Kudo2013 This material has square-planer Ir4As8 layers, which are isotypic to the Pt4As8 layers in Ca10(Pt4As8)(Fe2-xPtxAs2)5. The band-structure calculation for Ca10(Ir4As8)(Fe2-xIrxAs2)5 predicts that the Ir 5 orbitals have relatively large contribution to the density of states at compared to Ca10(Pt4As8)(Fe2-xPtxAs2)5. Kudo2013 In addition, a recent x-ray diffraction study by Sugawara et al. has reported doubling of the unit cell along the -axis below 100 K which is attributed to the Ir 5 orbital crossover. Sugawara2014 In this context, an ARPES study on Ca10(Ir4As8)(Fe2-xIrxAs2)5 is highly interesting and important in order to reveal electronic structure of the Ir4As8 layer as well as its impact on the FeAs layer. In this work, on the basis of photoemission spectroscopy, we discuss the unusual electronic structure of Ca10(Ir4As8)(Fe2-xIrxAs2)5 where Bloch-like Fe 3 electrons forming the hole and electron Fermi pockets coexist with metallic and glassy Ir 5 electrons.
The single crystal samples of Ca10(Ir4As8)(Fe2-xIrxAs2)5 were prepared as reported in the literature. Kudo2013 The lattice constants and are 8.725 and 20.70 around 20 K Sugawara2014 . The ARPES measurements were performed at beamline 28A of Photon Factory, KEK using a SCIENTA SES-2002 electron analyzer with circularly polarized light. The total energy resolution was set to 20 - 30 meV for the excitation energies from 41 - 67 eV. The base pressure of the spectrometer was in the Pa range. The single crystals of Ca10(Ir4As8)(Fe2-xIrxAs2)5, oriented by ex situ Laue diffraction, were cleaved at 20 K under the ultrahigh vacuum and the spectra were acquired at 20 K within 12 hours after the cleaving. was determined using the Fermi edge of gold reference samples.
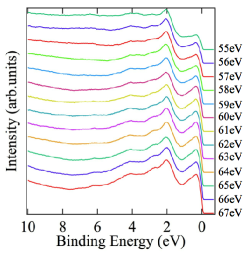
The valence-band photoemission spectra of Ca10(Ir4As8)(Fe2-xIrxAs2)5 taken at photon energies from = 55 eV to 67 eV are displayed in Fig. 1. The peak near dramatically gains its intensity in going from = 55 eV to 67 eV, consistent with the Fe 3-3 resonance behavior observed in LaFeAsO1-xFx. Malaeb2008 In contrast, the intensity of the region from 2 eV to 4 eV below does not depend appreciably on the photon energy. The valence-band spectra are basically consistent with the density of states calculated by Kudo et al. Kudo2013 The calculation indicates that the structure near is dominated by the Fe 3 orbitals with a mixture of the Ir 5 orbitals, consistent with the Fe 3-3 resonance. On the other hand, the structures ranging from 2 eV to 4 eV below can be assigned to the Ir 5 orbitals which are mixed with the Fe 3 orbitals. The overall agreement with the band-structure calculation suggests that the Ir 5 electrons contribute to the density states at as predicted by the calculation.
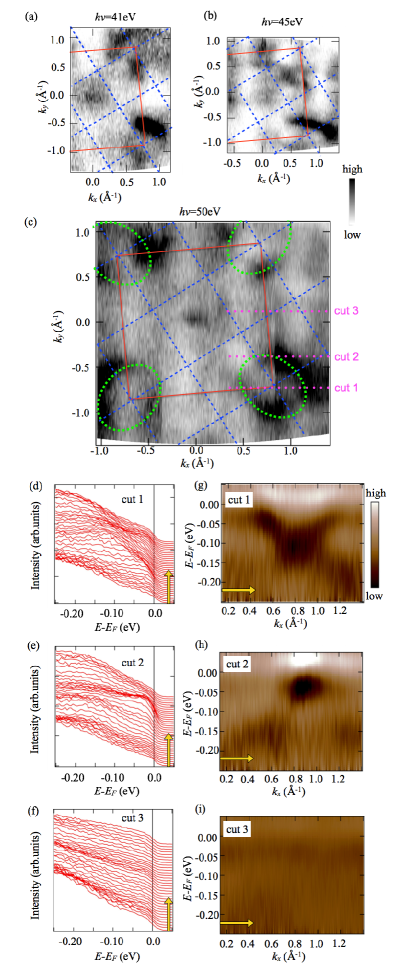

Figures 2(a)-(c) show the Fermi surface maps taken at = 41 eV, 45 eV, and 50 eV. In the Fermi surface maps, the ARPES intensity is integrated within energy window ¡ 5 meV and is displayed as a function of and . Here, (or ) is the electron momentum approximately along the Fe-Fe direction of the FeAs layer, and the two-dimensional Brillouin zone for the FeAs layer is indicated by the solid lines in Figs. 2(a)-(c). The hole-like Fermi pocket at the zone center and the electron-like Fermi pockets at the zone corners are observed by ARPES as commonly seen in various Fe-based superconductors. Here, one can safely conclude that the Fermi pockets are derived from the FeAs layer. The Fermi surface maps of Figs. 2(a), (b), and (c) are taken at = 41 eV, 45 eV, and 50 eV, which correspond to (momentum perpendicular to the FeAs layer or the Ir4As8 layer) of 3.64 ( ), 3.78 ( ), and 3.95 ( ) at the zone center (), respectively. Whereas the area of the hole-like Fermi pocket at the zone center is very small, those of the electron-like Fermi pockets at the zone corners are relatively large for all the values, indicating that the FeAs layer is heavily electron doped. On the other hand, the Fermi surfaces from the Ir4As8 layer are apparently absent which may contradict with the theoretical prediction of the metallic Ir4As8 layer.
Figures 2(d), (e), and (f) show the ARPES intensity or the energy distribution curves along cuts 1, 2, and 3 in the Fermi surface map of Fig. 2(c), respectively. In Figs. 2(g), (h), and (i), the second derivatives are plotted as functions of the momentum along cuts 1, 2, an 3. The low value of corresponds to the peak in . Firstly, dispersion of the electron-like band is clearly seen in Figs. 2(d) as well as in the second derivative plot in Fig. 2(g). The electron-like Fermi pocket is still observed along cut 2 showing that the area of the electron-like Fermi pockets are relatively large as schematically indicated by dotted ellipse in Fig. 2(c). The bottom of the electron band at the zone corner is located around 0.1 eV below which is very far from compared to those of the various Fe-based superconductors. For example, the bottom of the electron band at zone corner is located around 0.03 eV below in optimally electron doped BaFe1-xCoxAs2 Sudayama2011 . This observation is again consistent with the heavy electron doping in the FeAs layer. Secondly, even outside of the electron-like Fermi pockets, substantial spectral weight at is observed. As shown in Fig. 2(f), the spectral weight at is seen even along cut 3 where no Fermi surface is expected and is observed indeed [also see the second derivative plot in Fig. 2(i)]. The momentum independent spectral weight at indicates glassy (and metallic) electronic states which may be induced by atomic disorder. Since the electron-like and hole-like Fermi pockets are derived from the FeAs layer, the glassy spectral weight can be attributed to the Ir4As8 layer which may be atomically disordered by the Ir 5 orbital instability. This picture is indeed consistent with the extended x-ray absorption fine structure at the Ir edge Saini2014 .
Figure 3(a) shows a Fermi surface map in the - plane. The hole-like Fermi pocket around the zone center is clearly seen in the wide region, and the dependence of the Fermi pocket is rather small. This indicates that two dimensionality of the Fe 3 bands is relatively good in the present system and would be inconsistent with the metallic Ir4As8 layer since the metallic spacer layer is expected to provide strong interlayer interaction. However, if the metallic Ir4As8 layer is strongly disordered as discussed in the previous paragraph, the interlayer interaction becomes momentum independent and, consequently, the FeAs layer can exhibit good two dimensionality although the Ir4As8 interlayer is metallic.
Figures 3(b)-(f) show energy distribution curves taken at 60 eV, 54 eV, 50 eV, 45 eV, and 41 eV. In addition to the hole-like Fermi pocket at the zone center, the momentum independent spectral weight is seen at . This is again consistent with the picture that the momentum dependent Fermi pocket is derived from the FeAs layer and that the momentum independent states are assigned to the atomically disordered Ir4As8 layer. The band dispersion of the hole band is seen in the second derivative plots of Figs. 3(g)-(k). Only one hole band is observed although three hole bands (one Fe 3 band and two Fe 3 bands) are expected from the theoretical calculations. At the zone center, the As 4 orbitals of the FeAs layer hybridize with the Fe 3 orbital and the Ir 5 orbital in the neighboring Ir4As8 layer. Here, one can speculate that the Fe 3 orbital is strongly affected by the orbital crossover between and in the Ir4As8 layer Sugawara2014 and is substantially broadened due to the Ir atomic (and orbital) disorder. On the other hand, the Fe 3 orbitals are less affected by the Ir4As8 layer and are observed by ARPES. This assignment is further supported by the fact that the dispersion of the observed hole band agrees well with that of the Fe 3 hole band reported in various systems.
In conclusion, we have studied the electronic structure of Ca10(Ir4As8)(Fe2-xIrxAs2)5 in which the metallic Ir4As8 layer with orbital degrees of freedom is expected to play important roles. The ARPES results indicate that the Ir 5 electrons are metallic and glassy probably due to atomic disorder related to the Ir 5 orbital instability Sugawara2014 . On the other hand, the Fe 3 electrons in the FeAs layer form the hole-like Fermi pocket at the zone center and the electron-like Fermi pockets at the zone corners as commonly seen in various Fe-based superconductors. While the hole band with the Fe 3 character is clearly observed, other hole bands are smeared out probably due to the strong out-of-plane disorder from the Ir4As8 layer. The ARPES results indicate that the FeAs layer is heavily electron doped and has good two dimensionality. Ca10(Ir4As8)(Fe2-xIrxAs2)5 is characterized by the coexistence of the Bloch electrons in the FeAs layer and the glassy electrons in the Ir4As8 layer at .
The authors would like to thank the valuable discussion with Dr. N. Katayama and Prof. H. Sawa. This work was partially supported by Grants-in-Aid from the Japan Society of the Promotion of Science (JSPS) (No. 22540363, No. 25400372, No. 24740238, and No. 25400356) and the Funding Program for World-Leading Innovative R&D on Science and Technology (FIRST Program) from JSPS. The synchrotron radiation experiment was performed with the approval of Photon Factory, KEK (2013G021).
References
- (1) Y. Kamihara, H. Hiramatsu, M. Hirano, R. Kawamura, H. Yanagi, T.Kamiya, and H.Hosono, J. Am. Chem. Soc. 128,10012 (2006).
- (2) Y. Kamihara, T. Watanabe, M. Hirano, and H. Hosono, J. Am. Chem. Soc. 130, 3296 (2008).
- (3) S. Kakiya, K. Kudo, Y. Nishikubo, K. Oku, E. Nishibori, H. Sawa, T. Yamamoto, T. Nozaka, and M. Nohara, J. Phys. Soc. Jpn. 80, 093704 (2011).
- (4) N. Ni, J. M. Allred, B. C. Chan, and R. J. Cava, Proc. Natl. Acad. Sci. 108, E1019 (2011).
- (5) C. Löhnert, T. Stürzer, M. Tegel, R. Frankovsky, G. Friederichs and D. Johrendt, Angew. Chem. Int. Ed. 50, 9195 (2011).
- (6) M. Nohara, S. Kakiya, K. Kudo, Y. Oshiro, S. Araki, T. C. Kobayashi, K. Oku, E. Nishibori, and H. Sawa, Solid State Commun. 152, 635 (2012).
- (7) M. Neupane, C. Liu, S. Y. Xu, Y. J. Wang, N. Ni, J. M. Allred, L. A. Wray, N. Alidoust, H. Lin, R. S. Markiewicz, A. Bansil, R. J. Cava, and M. Z. Hasan, Phys. Rev. B 85, 094510 (2012).
- (8) S. Thirupathaiah, T. Stürzer, V. B. Zabolotnyy, D. Johrendt, B. Büchner, and S. V. Borisenko, Phys. Rev. B 88, 140505 (2013).
- (9) X. P. Shen, S. D. Chen, Q. Q. Ge, Z. R. Ye, F. Chen, H. C. Xu, S. Y. Tan, X. H. Niu, Q. Fan, B. P. Xie, and D. L. Feng, Phys. Rev. B 88, 115124 (2013).
- (10) K. Kudo, D. Mitsuoka, M. Takasuga, Y. Sugiyama, K. Sugawara, N. Katayama, H. Sawa, H. S. Kubo, K. Takamori, M. Ichioka, T. Fujii, T. Mizokawa, and M. Nohara, Sci. Rep. 3, 03101 (2013).
- (11) K. Sugawara, N. Katayama, Y. Sugiyama, T. Higuchi, K. Kudo, D. Mitsuoka, M. Nohara, H. Sawa, arXiv:1402.3889.
- (12) W. Malaeb, T. Yoshida, T. Kataoka, A. Fujimori, M. Kubota, K. Ono, H. Usui, K. Kuroki, R. Arita, H. Aoki, Y. Kamihara, M. Hirano, and H. Hosono, J. Phys. Soc. Jpn. 77, 093714 (2008).
- (13) T. Sudayama,Y. Wakisaka, T. Mizokawa, S. Ibuka, R. Morinaga, T. J. Sato, M. Arita, H Namatame, M. Taniguchi, and N. L. Saini, J. Phys. Soc. Jpn. 80, 113707 (2011).
- (14) E. Paris et al., unpublished.