Demixing cascades in cluster crystals
Abstract
In a cluster crystal, each lattice site is occupied by multiple soft-core particles. As the number density is increased at zero temperature, a ‘cascade’ of isostructural phase transitions can occur between states whose site occupancy differs by unity. For low but finite temperature, each of these transitions terminates in a critical point. Using tailored Monte Carlo simulation techniques we have studied such demixing cascades in systems of soft particles interacting via potentials of the generalized exponential form . We have estimated the critical parameters of the first few transitions in the cascade as a function of the softness parameter . The critical temperature and pressure exhibit non-monotonic behaviour as is varied, although the critical chemical potential remains monotonic. The trends for the pressure and chemical potential are confirmed by cell model calculations at zero temperature. As , all the transitions that we have observed are preempted by melting although we cannot rule out that clustering transitions survive at high density.
I Introduction
Soft matter systems such as star polymers and dendrimers comprise individual molecules that can overlap substantially at high concentrations Likos (2006); Likos et al. (2007). In order to better understand the equilibrium and dynamical properties of such systems one generally appeals to theory and simulation. In so doing it is common to dispense with the finer (atomistic) detail in favour of coarse-grained descriptions. Typically these represent each molecule in terms of an ultra-soft colloidal particle which interacts with its neighbours via a short ranged two-body effective potential. The form of this potential can be parameterized from simulation and experiment. For instance, for star polymers in good solvent one finds a weakly divergent repulsive potential Jusufi et al. (1999). However, if the monomer density is sufficiently low that the centres of mass can coincide, a bounded potential is appropriate Likos (2001).
Systems described by bounded interactions have received considerable attention in recent years due to their unique equilibrium and dynamical behaviour. A prototype theoretical form for a bounded potential is the generalized exponential model (GEM) for which the interaction potential is given by
| (1) |
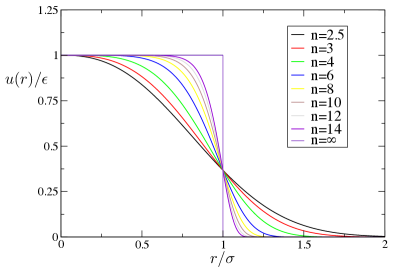
Here and set the energy and length scales respectively, while is a ‘softness’ parameter which also serves to delineate the members of the GEM- class of models. Certain members of this class have been extensively investigated by several groups Mladek et al. (2006, 2008); Zhang et al. (2010); Zhang and Charbonneau (2012); Sütő (2011); Coslovich and Ikeda (2013). For the potential is a simple Gaussian and the model is termed the Gaussian core model (GCM) Stillinger (1976); Prestipino et al. (2005); Lang et al. (2000); Likos et al. (2001); Ikeda and Miyazaki (2011); Coslovich and Ikeda (2013); while for one obtains a top hat potential known as the penetrable sphere model (PSM) Blum and Stell (1979); Marquest, C. and Witten, T.A. (1989); Likos et al. (1998). Various members of the spectrum of GEM potentials are depicted in Fig. 1.
The key feature of the equilibrium behaviour of particles interacting via the GEM- potential is that for they exhibit clustering behaviour in which particles clump together in groups. This phenomenon (the origin of which can be traced to instabilities associated with negative components in the Fourier transform of the pair potential Likos et al. (2001)) is already evident in dense liquids Klein et al. (1994); Fragner (2007), but is most striking in the crystalline phases where lattice sites are occupied by multiple particles Likos et al. (1998); Mladek et al. (2006, 2008). Activated hopping Moreno and Likos (2007); Montes-Saralegui et al. (2013) of particles between lattice sites contributes to density fluctuations and dynamical relaxation processes in such systems. Although originally only observed in the GEM models, evidence for cluster crystals has recently been reported in simulations of dendrimer models with atomistic detail Lenz et al. (2012). To date, however, there have been no experimental reports of cluster crystals in real soft matter systems.
Most studies of the GEM- family have been performed for the three cases . In the GCM () Stillinger (1976); Prestipino et al. (2005); Lang et al. (2000); Likos et al. (2001); Ikeda and Miyazaki (2011); Coslovich and Ikeda (2013), no clustering occurs, but the system exhibits two solid phases, one face centred cubic (fcc) and the other body centred cubic (bcc). As the density is increased at low temperature, reentrant melting occurs so that the highest density state is always a fluid.
For (the PSM), clustering is observed in both the fluid and solid phases Likos et al. (1998); Schmidt (1999); Suh et al. (2010); Fernaud et al. (2000); Kai and Charbonneau (2012). Although only one phase transition has been reported to date, namely the liquid-solid transition, the freezing properties are rather interesting because they exhibit crossover behaviour depending on temperature. Specifically, at high clusters form in the liquid and these freeze into a cluster crystal. By contrast at sufficiently low temperature the interparticle potential reduces to that of a system of hard spheres and the freezing transition behaves accordingly.
The GEM- potential is the most studied member of the GEM- family to date, see eg. Likos et al. (2007); Mladek et al. (2006, 2008); Neuhaus and Likos (2011); Zhang and Charbonneau (2012). This system exhibits a rich phase diagram including bcc and fcc cluster phases, as well as reentrant phase behavior. At low temperature, evidence has been found for an infinite cascade of isostructural demixing transitions between fcc phases having different site occupancies. Neuhaus and Likos (2011); Wilding and Sollich (2013).
Previously we located the critical points of the first four stable transitions in the cascade for the GEM-4 potential, ie. those which at exhibit unit jumps in the site occupancy , , , . Interestingly, within simulation uncertainties, no variation was seen in the critical temperatures for these four transitions. In the present work we extend our investigations to other members of the GEM- class. Our aim is to determine whether the demixing cascade seen for persists for other values of and, if so, how the critical parameters depend on . Additionally we seek to understand the fate of the demixing transitions as one approaches the Gaussian limit (), for which no cluster crystals appear to exist. We also consider the case of large in which the potential approaches the PSM limit.
II Methods
II.1 Monte Carlo Scheme
Crystals in which the number of particles per lattice site can vary, are not straightforward to study by simulation. To appreciate why, consider a system comprising particles in a volume . Suppose there are lattice sites so that the average occupancy is and the volume per lattice site is . Then the particle number density is simply
| (2) |
Clearly, however, a given can be realized by an infinite number of combinations of and . Equilibrium corresponds to each lattice site having a certain occupancy and a certain unit cell volume . But in order to relax to this state from some arbitrary initial state, it is in general necessary for the number of lattice sites, , and the lattice parameter to change.
Unfortunately, fluctuations in do not typically occur on simulation timescales. For a system having periodic boundary conditions, can vary only if a whole crystal plane is added or deleted. But free energy barriers prevent such large changes from happening. This is true even if one operates in an ensemble in which the system volume (and hence the lattice parameter) can fluctuate. Accordingly, if the system is initiated with a given number of lattice sites, it generally remains so for the duration of the simulation. Even if plane insertions/deletions were to occur, for a finite-sized system the consequent large relative changes in would lead to considerable discretisation effects in the values of which could be sampled.
In order to locate the equilibrium conditions, a different strategy must be taken. Specifically it has been shown Swope and Andersen (1992); Mladek et al. (2007) that equilibrium corresponds to the condition
| (3) |
where is the so-called lattice site (or cluster) chemical potential given by
| (4) |
with is the Helmholtz free energy, is the pressure and and is the standard chemical potential.
Unfortunately cannot be directly measured as a simple ensemble average at the state point of interest and therefore one must resort to more elaborate means. One approach for estimating is a direct assault on the right hand side of Eq. (4) Mladek et al. (2007): obtaining via thermodynamic integration from a reference state of known free energy, by sampling the virial and using the Widom insertion method Frenkel and Smit (2002). This process (or alternatively a direct estimation of the constrained free energy Zhang et al. (2010)), then has to be repeated for a range of values of in order to pinpoint equilibrium at the prescribed . Accordingly it can be cumbersome and laborious.
In recent work we have proposed a new Monte Carlo simulation scheme for efficiently and accurately locating the equilibrium conditions in cluster crystals. The method is framed within the great grand canonical (constant ) ensemble. For solids having fixed (a constraint imposed implicitly by free energy barriers, as described above), this ensemble does not suffer from the divergence of the partition function that occurs in equilibrium fluids Wilding and Sollich (2013). One benefit of its use is that it is fully unconstrained, allowing fluctuations in : fluctuations in permit the relaxation of the lattice parameter, while fluctuations in allow the average site occupation to vary in small steps of . Another advantage is that the great grand canonical ensemble permits the ready use of histogram reweighting to scan the fields , without the need for multiple simulations.
In order to locate equilibrium we implement a MC move that permits fluctuations in the number of lattice sites. Specifically, we define two states of the system, and , which differ by a single lattice plane of lattice sites. For the number of lattice sites is , while for it is . Biased sampling techniques are used to access regions of configuration space that allow a lattice plane to be ’switched’ in and out of the system via a Monte Carlo update. This back and forth switching between the and states allows one to measure the relative probability of finding the system in the and states
| (5) |
It can be shown Wilding and Sollich (2013) that this probability ratio provides direct access to the difference
| (6) |
and since the right hand side vanishes only when , this allows the equilibrium conditions to be estimated via an equal peak weight criterion: . In practice one locates equilibrium with the help of histogram reweighting, varying and together at fixed in such a way as to maintain some target density. The equal peak weight criterion identifies the specific combination of and that corresponds to equilibrium at this density. For further details the interested reader is referred to Ref. Wilding and Sollich (2013).
II.2 Cell model
We can study the zero temperature behaviour of demixing cascades in the GEM- models using a simple cell model inspired by Refs. Likos et al. (1998); Neuhaus and Likos (2011). We assume that the crystal consists of sites as above, and is substitutionally disordered in the sense that the number of particles at each site is drawn from some distribution . If we also assume that at the particles sit at the lattice positions, then in units where we can write down the energy of such a crystal as
| (7) | |||||
The two terms describe interactions between particles on the same and on different sites, respectively. The distance between neighbouring lattice sites is in an fcc lattice, or more generally, where is the lattice parameter. We have also denoted by the coordination number of the crystal lattice, and by the average number of particles per site. To express in terms of and the distribution of cluster sizes , one uses and , with the linear system size. A third relation is where indicates the number of particles per cubic unit cell, with for fcc. This gives and overall for the energy density
| (8) |
where is the second moment of the cluster size distribution.
One notices that the energy density worked out above only depends on two moments of the distribution of cluster sizes . The system will adopt a configuration that minimizes the energy density at given , and we can think of this as a two-step process of first minimizing w.r.t. at fixed , and then w.r.t. . The first step here can be shown to have the intuitively obvious result that only two cluster sizes occur, namely the integers either side of , which we write as and . The relative weight of these is then fixed by , and one finds where lies between zero and one.
The cell model energy, minimized at constant , thus becomes
| (9) |
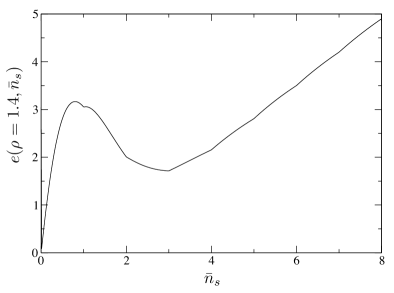
and the final energy density we want is . By way of orientation we plot vs in Fig. 2 for exponent and density . One sees kinks at integer values of , which result from the term in (9). As a consequence, when we increase the optimal value of will generally get “stuck” at an integer across a range of , before then moving smoothly to the next integer. This is shown in Fig. 3, where we plot the optimal vs , again for .
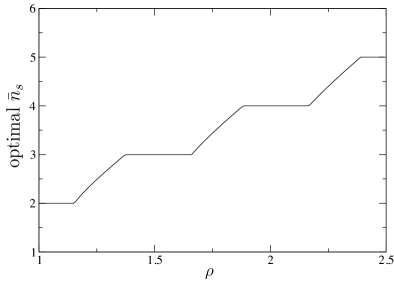
Fig. 4 shows the resulting , ie. the minimal cell model energy density as a function of density. One sees that this consists of a series of convex and concave regions. The existence of the concave regions means the system will lower its energy by macroscopic phase separation, in density regions which can be found by constructing double tangents to . On general geometrical grounds the double tangents have to touch in places where the function is convex: we have checked that these are exactly the regions where is an integer. The concave regions, which are the ones where is not an integer, then do not matter for the construction of the double tangents. One thus sees a posteriori that an analysis that does not allow substitutional disorder and assumes a fixed in each possible crystal phase would have given the same result.
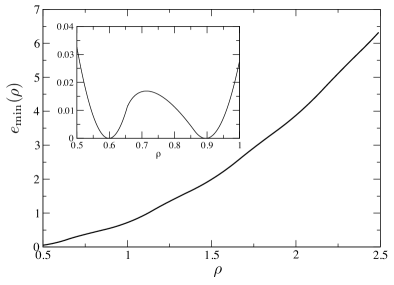
Allowing for substitutional disorder becomes important in the PSM limit , however. As we explain below, in this limit approaches a function consisting of successive straight line segments. These are already double tangents and so the system cannot lower its energy further by macroscopic phase separation. Therefore the equilibrium state at zero temperature should be a substitutionally disordered crystal, in agreement with Kai and Charbonneau (2012).
To see the behaviour in the limit, one uses the fact that the interaction potential then becomes a step function, ie. for and for . As long as nearest neighbour particles do not overlap, the term therefore drops out from the PSM energy density. The resulting expression simplifies to
| (10) | |||||
| (11) |
This is clearly an increasing function of for each fixed , and continuous at integer values of , so increasing overall. Therefore the optimal value of is the lowest one that is possible while maintaining the nearest neighbour separation – as is also reasonable from physical intuition – giving . Noting that , one then sees that the first term in the square brackets in (11) is linear in , while the second one is constant as long as remains the same. This shows that , the minimum of over , is a piecewise linear function of density. The linear segments are delimited by integer values of , which for fcc specifically is .
III Results
We have employed the MC scheme of Sec. II.1 to locate the critical points of low-density levels of the demixing cascade for a selection of GEM-n potentials. Our criterion for estimating the critical parameter was to tune the temperature and equilibrium chemical potential until the distribution of the fluctuating number density closely matched the universal Ising form, which is expected to pertain for systems with short ranged interactions and a scalar order parameter Wilding (1995); Zhang and Charbonneau (2012); Wilding and Sollich (2013). As the critical points can occur at very low temperature (particularly at large ), relaxation times for our Monte Carlo simulations were generally rather long. This prevented us performing a full finite-size scaling analysis, which would have allowed us to obtain even more precise estimates of critical point parameters. It also prevented us from reaching the PSM limit, with being the steepest potential for which we could access the critical region (see Fig. 1).
Our cell model calculations are applicable to the zero temperature limit in which a first order phase transition occurs, and therefore do not provide estimates of the critical temperature. However, since the critical temperatures of the transitions are very small, it is reasonable to expect that the model predictions for the transition pressure and chemical potential should be in reasonable accord with the critical values, or at least correctly reproduce trends with respect to variations in and the level of the cascade.
We consider the dependence of the critical point parameters on the softness parameter and the cascade level, which we index by , ie. by the occupancy at of the lower density phase of the two coexisting phases. Estimates of the critical temperature have been made for the first three stable levels of the cascade, corresponding to and for a range of values of . The results (Fig. 5) show that for levels there is a maximum in for . No such maximum occurs for level , however, because on reducing , the system melts before the maximum is reached. In fact all levels of the cascade melt as is reduced towards . This reflects the fact that as becomes smaller, the liquid region of the phase diagram expands to ever greater densities, thereby engulfing successive levels of the cascade. Such an observation is consistent with the known phase behaviour of the GCM () for which no cluster crystals have been observed Prestipino et al. (2005); Ikeda and Miyazaki (2011).
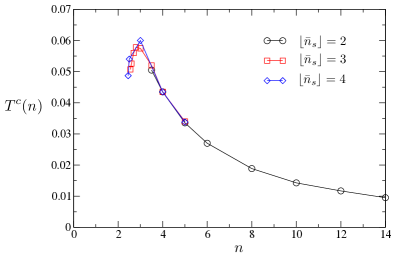
The results of Fig. 5 exhibit the further interesting feature that for a given , the critical temperatures of each level of the cascade are indistinguishable within uncertainty for . By contrast for , clearly increases between levels to . To help shed light on this observation, we have used the cell model to calculate the magnitude of the density difference (ie. the order parameter) for the transitions of the cascade, at . Since this order parameter is expected to depend on the value of the critical temperature, it should provide an analytical indicator as to whether is really independent of for a given . Fig. 6 shows the standard deviation (normalised by the mean) in the value of the order parameter at for levels . One notes that this quantity is very small across the board, in accord with the simulation findings that variations in with are small. However the variation remains non zero, and for small is considerably stronger than for large . Thus it seems likely that the apparent independence of on for merely reflects the fact that the temperature variation is smaller than can be resolved in our simulations.
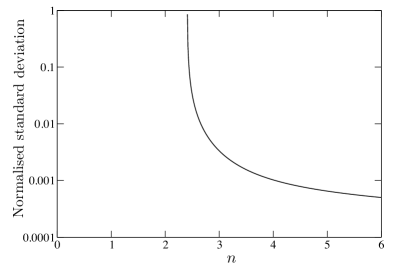
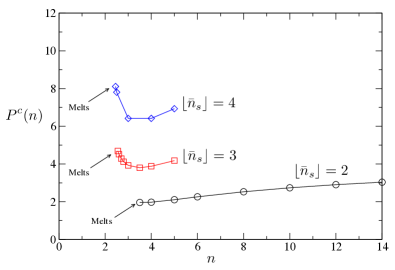
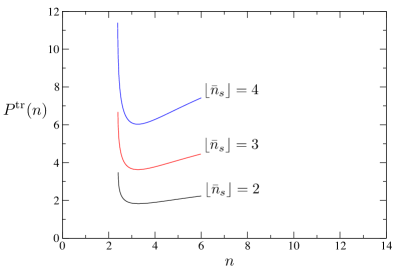
Figure 7(a) shows the simulation estimates for the critical pressure . In contrast to the case of the critical temperature, for any given there are large differences in the pressure between successive levels of the cascade. In common with the situation for the critical temperature, the pressure varies non monotonically in , with a clear minimum close to . We note that on reducing below , the critical pressure for the and levels starts to increase very rapidly, before the system melts. Similar behaviour is seen in the cell model predictions for the phase transition pressure at (Figure 7(b)). Here the curve of the coexistence pressure versus terminates at some value of below which no double tangent in can be found. The value of for which this happens lies around and is only weakly dependent on the level of the cascade. This termination presumably reflects the instability of the cluster crystal phase.
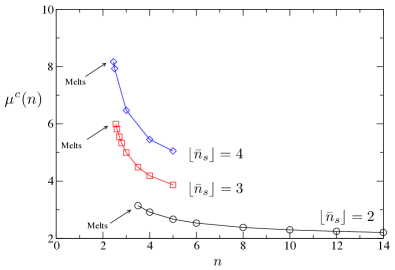
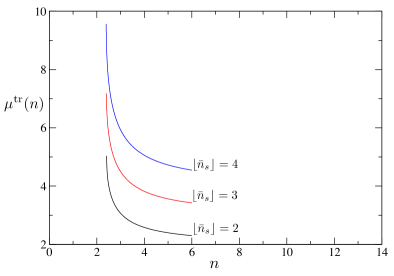
In contrast to the scenario observed for the critical temperature and pressure, monotonic behaviour is seen in the critical chemical potential . The results (Fig. 8) demonstrate that simply increases ever more rapidly as decreases until the system melts. Similar behaviour is observed for the transition chemical potential at within the cell model, with the curves for the transition chemical potential terminating at .
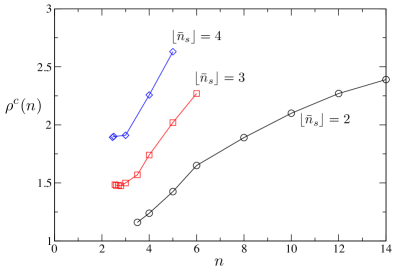
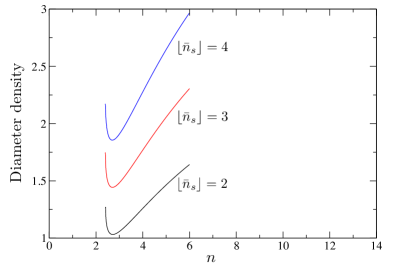
Simulation estimates of the dependence of the critical density on and are plotted in in Fig. 9(a). Here one sees hints of the approach to a minimum, at least for , although the actual minimum seems to be preempted by melting. Clear minima are visible, however, in the cell model results for the coexistence diameter density at , Fig. 9(b).
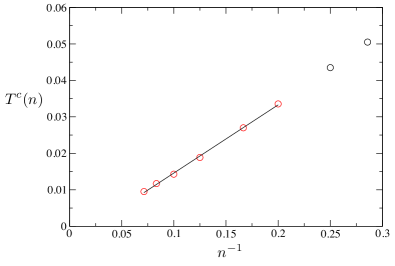
Finally, we consider the behaviour of the critical temperature at large . Fig. 10 replots our simulation estimates of for the lowest stable level of the cascade, , this being the level for which we were able to scan the largest range of . These results show that decreases rapidly with increasing . At large (ie. well away from the peak in Fig 5) we observe scaling consistent with . An extrapolation of the trend is consistent with the absence of a demixing cascade in the PSM at zero temperature, as suggested by the cell model studies, although since the largest we could study was , our data would not by themselves completely rule out a very low temperature critical point.
IV Summary and conclusions
In summary, we have used tailored Monte Carlo simulation techniques and zero temperature cell model calculations to study the behaviour of the demixing cascade as a function of the potential softness parameter in the GEM- models. For a given , the critical temperature is only very weakly dependent on the level of the cascade, with the differences being greatest for . A maximum occurs in near and non-monotonicity is also observed in the critical pressure , but not in the critical chemical potential . These latter features are corroborated by our cell model calculations for the transitions.
As (the GSM limit) the liquid region of the phase diagram expands to higher densities. This results in the melting of successive levels of the cascade. However, it is an interesting open question whether the liquid always wins in the GSM limit or whether at extremely high densities a cluster crystal can nevertheless occur.
As is increased to large values, the critical temperatures fall steadily to very low values, with the simulations suggesting . Extrapolation of the results to the PSM () limit is consistent with the absence of a demixing cascade in the PSM.
Acknowledgements.
We thank Rob Jack, Christos Likos and Bianca Mladek for helpful discussions.References
- Likos (2006) C. L. Likos, Soft Matter 2, 478 (2006).
- Likos et al. (2007) C. N. Likos, B. M. Mladek, D. Gottwald, and G. Kahl, J. Chem. Phys. 126, 224502 (2007).
- Jusufi et al. (1999) A. Jusufi, M. Watzlawek, and H. Löwen, Macromolecules 32, 4470 (1999).
- Likos (2001) C. N. Likos, Phys. Rep. 348, 267 (2001).
- Mladek et al. (2006) B. M. Mladek, D. Gottwald, G. Kahl, M. Neumann, and C. Likos, Phys. Rev. Lett. 96, 045701 (2006).
- Mladek et al. (2008) B. M. Mladek, P. Charbonneau, C. N. Likos, D. Frenkel, and G. Kahl, J. Phys: Condens. Matter 20, 494245 (2008).
- Zhang et al. (2010) K. Zhang, P. Charbonneau, and B. M. Mladek, Phys. Rev. Lett. 105, 245701 (2010).
- Zhang and Charbonneau (2012) K. Zhang and P. Charbonneau, Phys. Rev. E 86, 042501 (2012).
- Sütő (2011) A. Sütő, Comm. Math. Phys. 305, 657 (2011).
- Coslovich and Ikeda (2013) D. Coslovich and A. Ikeda, Soft Matter 9, 6786 (2013).
- Stillinger (1976) F. H. Stillinger, J. Chem. Phys. 65, 3968 (1976).
- Prestipino et al. (2005) S. Prestipino, F. Saija, and P. V. Giaquinta, Phys. Rev. E 71, 050102 (2005).
- Lang et al. (2000) A. Lang, C. N. Likos, M. Watzlawek, and H. Löwen, J. Phys. Condens. Matter 12, 5087 (2000).
- Likos et al. (2001) C. N. Likos, A. Lang, M. Watzlawek, and H. Löwen, Phys. Rev. E 63, 031206 (2001).
- Ikeda and Miyazaki (2011) A. Ikeda and K. Miyazaki, J. Chem. Phys. 135, 024901 (2011).
- Blum and Stell (1979) L. Blum and G. Stell, J. Chem. Phys. 71, 42 (1979).
- Marquest, C. and Witten, T.A. (1989) Marquest, C. and Witten, T.A., J. Phys. France 50, 1267 (1989).
- Likos et al. (1998) C. N. Likos, M. Watzlawek, and H. Löwen, Phys. Rev. E 58, 3135 (1998).
- Klein et al. (1994) W. Klein, H. Gould, R. A. Ramos, I. Clejan, and A. I. Mel’cuk, Physica A 205, 738 (1994).
- Fragner (2007) H. Fragner, Phys. Rev. E. 75, 061402 (2007).
- Moreno and Likos (2007) A. J. Moreno and C. N. Likos, Phys. Rev. Lett. 99, 107801 (2007).
- Montes-Saralegui et al. (2013) M. Montes-Saralegui, A. Nikoubashman, and G. Kahl, J. Phys.: Condens. Matter 25, 195101 (2013).
- Lenz et al. (2012) D. A. Lenz, R. Blaak, C. N. Likos, and B. M. Mladek, Phys. Rev. Lett. 109, 228301 (2012).
- Schmidt (1999) M. Schmidt, J. Phys: Condens. Matter 11, 10163 (1999).
- Suh et al. (2010) S.-H. Suh, C.-H. Kim, S.-C. Kim, and A. Santos, Phys. Rev. E 82, 051202 (2010).
- Fernaud et al. (2000) M.-J. Fernaud, E. Lomba, and L. L. Lee, J. Chem. Phys. 112, 810 (2000).
- Kai and Charbonneau (2012) Z. Kai and P. Charbonneau, J. Chem. Phys. 136, (2012).
- Neuhaus and Likos (2011) T. Neuhaus and C. N. Likos, J. Phys.: Condens. Matter 23, 234112 (2011).
- Wilding and Sollich (2013) N. B. Wilding and P. Sollich, EPL 101, 10004 (2013).
- Swope and Andersen (1992) W. C. Swope and H. C. Andersen, Phys. Rev. A 46, 4539 (1992).
- Mladek et al. (2007) B. M. Mladek, P. Charbonneau, and D. Frenkel, Phys. Rev. Lett. 99, 235702 (2007).
- Frenkel and Smit (2002) D. Frenkel and B. Smit, Understanding Molecular Simulation (Academic, San Diego, 2002).
- Wilding (1995) N. B. Wilding, Phys. Rev. E 52, 602 (1995).