High-resolution optical spectroscopy of the R Coronae Borealis star V532 Ophiuchi at maximum light ††thanks: Accepted for publication in Publications of the Astronomical Society of the Pacific. Based on observations obtained with the Harlan J. Smith Telescope of McDonald Observatory of the University of Texas at Austin.
Abstract
High-resolution optical spectra of the R Coronae Borealis (RCB) star V532 Oph at light maximum are discussed. The absolute visual magnitude MV of the star is found to be . The elemental abundances suggest the star belongs to the majority class of RCB stars but is among the most O-poor of this class with mild enhancements of heavy elements Y, Zr, Ba and La. The C2 Swan bands are weak in V532 Oph relative to R CrB. Other aspects of the high-resolution spectrum confirm that V532 Oph is representative of majority RCBs, i.e., the radial velocity is variable, circumstellar material is present and the photosphere feeds a high-velocity stellar wind.
1 Introduction
R Coronae Borealis (RCB) stars are supergiants distinguished by a very H-poor atmosphere and a propensity to decline in brightness at unpredictable times as clouds of carbon soot intercept the line of sight to the star. Yet another characteristic of RCB stars is that they are rare; a catalogue assembled by Jeffery et al. (1996) lists just 36 ‘Cool hydrogen-deficient stars’, a class which covers warm and cool RCBs as well as five H-deficient carbon (HdC) stars which have not exhibited RCB-like declines in brightness. Comprehensive understanding of the origins and behavior of RCB stars may depend on increasing the number of known RCB stars and providing thorough analyses of multi-wavelength observations of new discoveries. Fortunately, several surveys are indeed increasing the sample of RCB stars, e.g., Tisserand et al. (2008, 2011, 2013) and Miller et al. (2012). Clayton (2012) provides a comprehensive list of RCB stars known currently.
V532 Oph (catalog ), the subject of this paper, was identified as a warm RCB star by Clayton et al. (2009) from ASAS-3 photometry with confirmation provided by low-resolution optical spectroscopy. In this paper, our primary goal is to provide an abundance analysis of V532 Oph and to compare it with other RCBs. This comparison involves the abundance analysis of 14 warm RCBs by Asplund et al. (2000) and the analysis by Rao & Lambert (2003) of another recent RCB discovery V2552 Oph (Kazarovets et al. 2003; Hesselbach, Clayton, & Smith 2003). The comparison RCB stars like V532 Oph are all warm RCB with optical spectra dominated by atomic and not molecular lines. With the exception of Z UMi (Kipper & Klochkova 2006), cool RCB stars with spectra dominated by C2 and CN lines have not been subjected to abundance analyses.
Our analysis shows that V532 Oph has a composition representative of majority RCB stars but stands out with a lower than average O abundance and heavy element (Y to La) abundances greater than average. V532 Oph with V2552 Oph (catalog ), also an O-poor RCB, hint at a new correlation between the O abundance and fraction of stellar flux absorbed and reradiated as the infrared excess emission by the circumstellar dust.
2 Observations
Observations of V532 Oph were obtained on two occasions (Table 1) with the Robert G. Tull cross-dispersed echelle spectrograph of the Harlan J. Smith 2.7m reflector at the W.J. McDonald observatory (Tull et al. 1995). The spectral resolving power, , employed was 40000. The spectrum covers 3900 to 10000Å with gaps beyond about 5600Å where the echelle orders were incompletely captured on the Tektronix 2048 x 2048 CCD.
Two exposures of 30 minutes were combined for each night. A nearby hot star was observed to remove the telluric line contribution. The light curve for the period 2009 to 2014 based on AAVSO observations shows that the star was at maximum light when our observations were obtained.
| Date | Julian Date | Velocitya | |
|---|---|---|---|
| (UT) | (2450000+) | (km s-1) | |
| 2010 Apr 21 | 5307.920 | -4.6 1.5 | |
| 2011 May 16 | 5697.814 | -2.7 0.9 |
a - Heliocentric radial velocity
3 Interstellar extinction and Absolute magnitude
In addition to the stellar spectrum, the optical spectrum of V532 Oph shows absorption lines from the diffuse interstellar medium. This is not surprising since V532 Oph is located in the Galactic plane. By using strengths of interstellar lines to estimate the reddening (and extinction) and the velocities of the lines with a model of Galactic rotation to estimate the star’s distance, we obtain an estimate of the bolometric magnitude which acts as a useful constraint in fixing the stellar atmospheric parameters (see below).
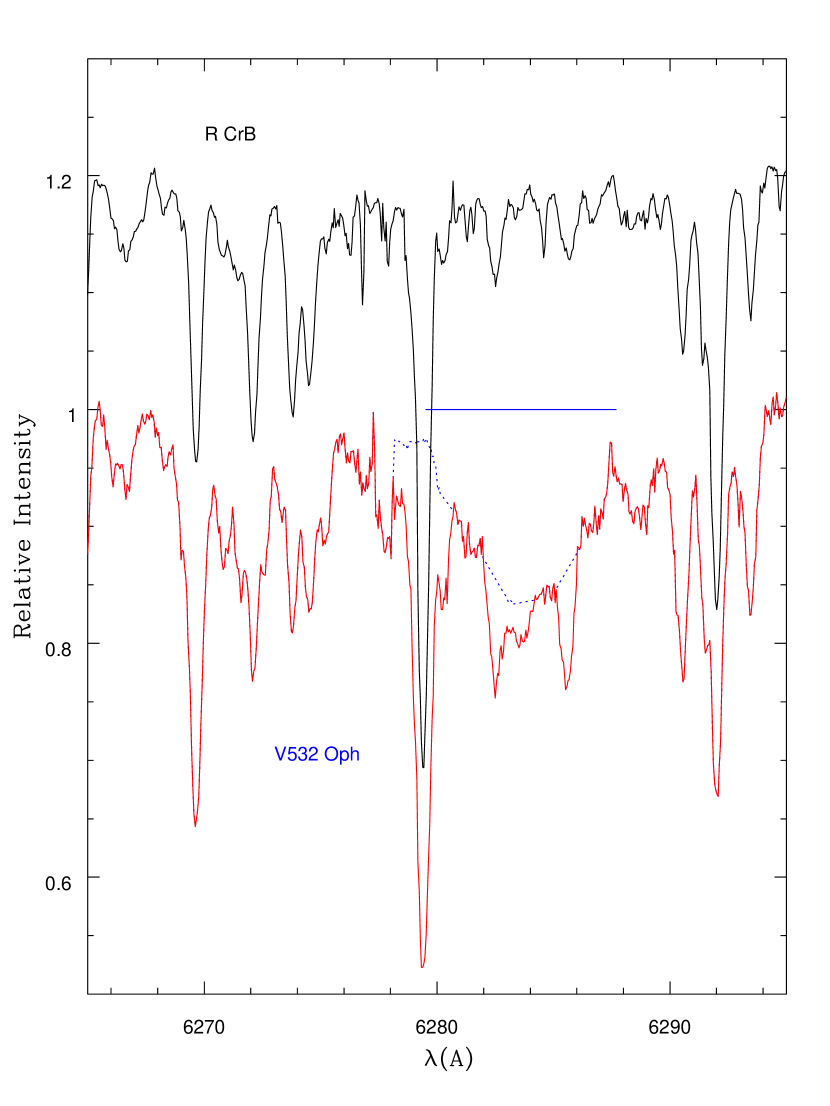
We estimated the interstellar reddening from the strength of diffuse interstellar bands (DIBs) on the high resolution spectra. Fortunately, the V532 Oph’s optical spectrum is a good match to that of R CrB (catalog ) at maximum light. R CrB is located at a high galactic latitude and suffers negligible interstellar reddening including contributions from the DIBs. Comparison of the spectra of V532 Oph and R CrB revealed the DIB features whose strength we could measure. An example is shown in Figure 1.
| Eq.W | E(B-V) | ||
|---|---|---|---|
| (Å) | (mÅ) | Herbig (1993) | Luna et al.(2008) |
| 5780 | 316 | 0.64 | 0.69 |
| 5796 | 110 | 0.70 | 0.65 |
| 6284 | 959 | 0.64 | 1.07 |
| 6375 | 28 | …. | …. |
| 6379 | 75 | 0.83 | 0.85 |
Equivalent widths of five DIBs were measured (Table 2) and the DIB equivalent width – reddening E(B-V) relations for four DIBs given by Herbig (1993) and Luna et al. (2008) were used to estimate the reddening in Table 2. The average E(B-V) is 0.76 0.14 leads to an estimate of AV of 2.36 0.43 with R of 3.1.
The referee of this paper has kindly intimated that his estimate of AV towards V532 Oph based on the calibration of Schlafly & Finkbeiner (2011), who use SDSS spectra and the E(BV) maps of Schlegel et al. (1998), is 2.43: a value very consistent with our estimate.
The light maximum V magnitude has been estimated to be 11.7 by Clayton et al. (2009) and 11.8 by Tisserand et al. (2013). We averaged AAVSO’s V band magnitudes at maximum obtained since 2010 August to present (the star seem to be recovering from a minimum in the earlier period) as 11.46 0.15 (95 measurements). This V maximum value may then be corrected for interstellar extinction resulting in V0 of 9.10 0.45.

Kinematics of the interstellar gas along the line of sight to V532 Oph are best revealed by the Na D lines, even though interstellar components must be distinguished from circumstellar components. Figure 2 shows the Na D profiles where D1 and D2 profiles are superimposed. (The oscillator strength of the D2 line is twice that of the D1 line). As an aid to identifying the interstellar Na D components, we computed the expected radial velocity with respect to the LSR with distance in the direction of V532 Oph using the model Galactic rotation given by Brand & Blitz (1993). Components with negative LSR radial velocities are not expected to occur in this direction. However, components are possibly present in the Na i D profiles of V532 Oph at -35 and -17 km s-1 which we attribute to outward-flowing circumstellar gas. There is a prominent absorption component to both Na i D lines at the LSR radial velocity of 40.5 km s-1 (marked as ISM in Figure 2).
The Galactic rotation curve suggests such a radial velocity occurs for a star at a distance of 6.17 kpc. The presence of such a cloud in front of a star provides a minimum distance to the star. This distance estimate provides an independent means of arriving at a lower limit to the absolute visual magnitude (MV) of this star. The extinction-corrected V magnitude 9.1 obtained earlier coupled with the distance estimate of 6.17 kpc provides the MV of -4.85 0.5 consistent with estimates obtained from warm RCB stars in LMC (Tisserand et al. 2009). The bolometric correction for V532 Oph (Teff of 6750 K -see later) is expected to be small: 0.019 according to Flower (1996) for normal supergiants. Thus, Mbol is expected to be about -4.9 0.5 as closely anticipated by Tisserand et al. (2009) for RCBs with mean 6750 K and a V-I color of 0.6.
4 Abundance analysis
The abundance analysis of V532 Oph followed procedures developed and applied by Asplund et al. (2000) to a sample of 14 warm RCBs. The adopted line-blanketed hydrogen-deficient model atmospheres are described by Asplund et al. (1997). An abundance ratio C/He = 1% by number of atoms was assumed. As discussed thoroughly by Asplund et al. (2000), the observed C i lines in these RCBs (also, here in V532 Oph) do not return the input C abundance but a value about 0.6 dex lower. This inconsistency referred to by Asplund et al. as ‘the carbon problem’ has yet to be explained in a self-consistent manner (i.e., the input C abundance for model atmosphere construction reproduces the observed carbon spectroscopic features e.g., C i, C ii and C2 lines) with their known -values. Asplund et al. suggest that relative abundance such as O/Fe may be insensitive to the correct resolution of the carbon problem.
Choice of the appropriate model atmosphere requires selection of effective temperature (Teff), surface gravity (), microturbulence (), and the C/He ratio (here = 1%). Since the Teff and determinations are somewhat dependent on , we began with the latter’s determination. For all species represented by lines spanning a range in equivalent widths, we determined the value of for which the standard deviation of derived abundances was at a minimum. This minimum was found for a similar value of for a majority of the species from N i to Y ii, i.e., km s-1.
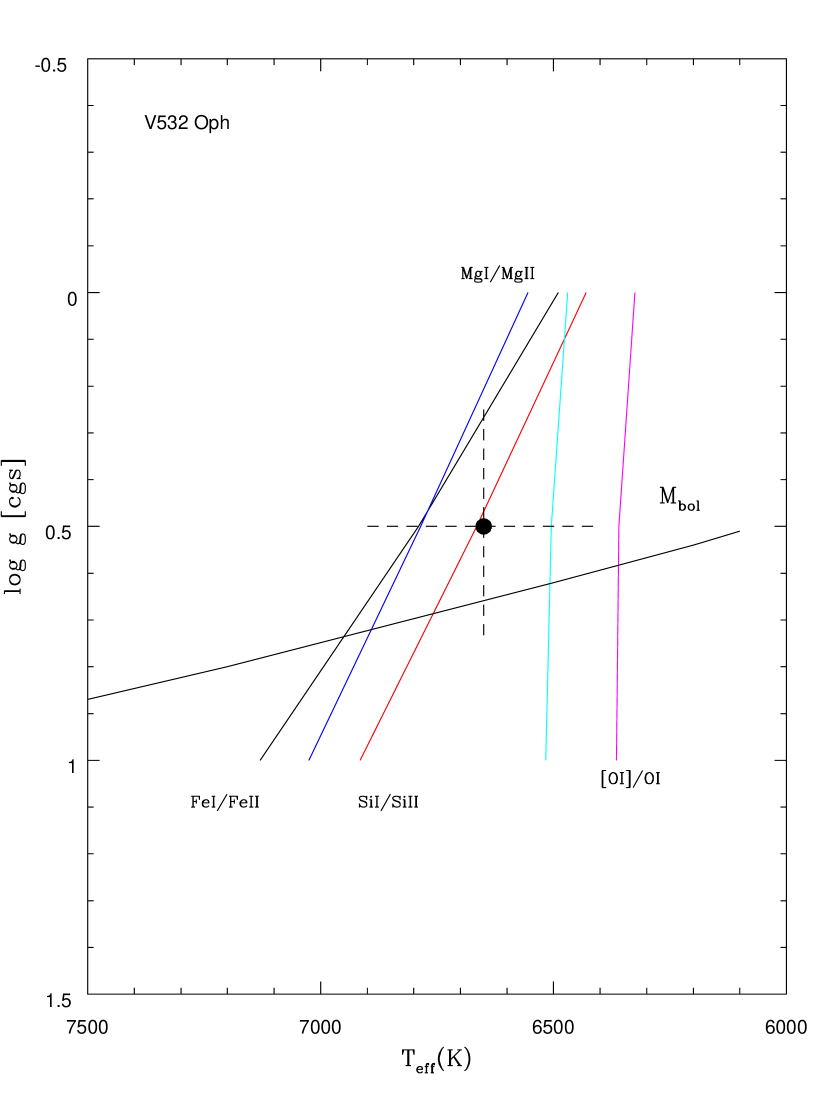
Several conditions are used to locate loci in the T plane. Ionization equilibrium was demanded using Fe i/Fe ii, Mg i/Mg ii, and Si i/Si ii to provide loci in the - log plane. Excitation equilibrium through the use of [O i] and high-excitation O i lines provides a gravity-insensitive temperature indicator. We also used the recipe suggested by Asplund et al. (2000) which adopts a of -5.0 for R CrBs, to obtain a relation between and log . The adopted parameters are indicated in Figure 3 along with the loci of various indicators in the – plane.
The stellar parameters = 6750250 K, = 0.50.3 (cgs units) and microturbulence tur = 7.51.0 km s-1 were chosen. The derived abundances are given in Table 3 along with the abundances of R CrB from Rao & Lambert (2003) and the dependence of V532 Oph’s abundances on a 250 K change in effective temperature and a 0.5 dex change in (sampling intervals in our atmospheric models) . The final column headed gives the difference between the logarithmic abundances of V532 Oph and R CrB.
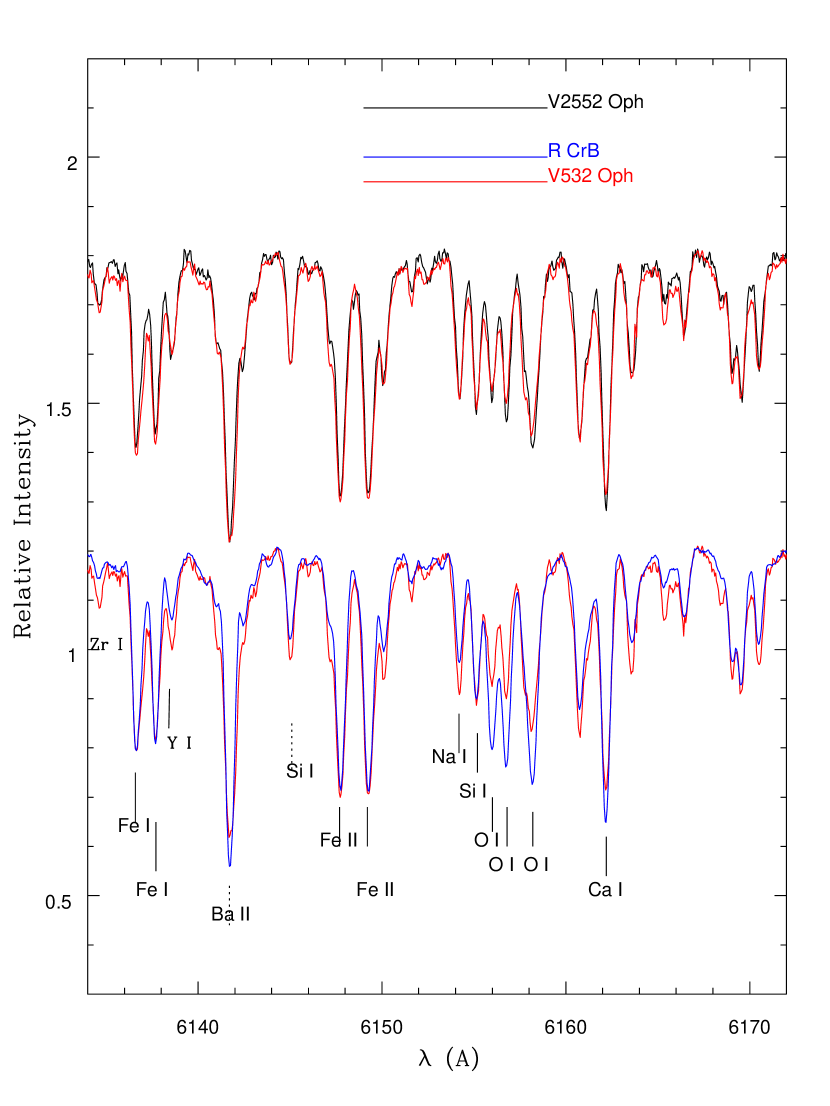
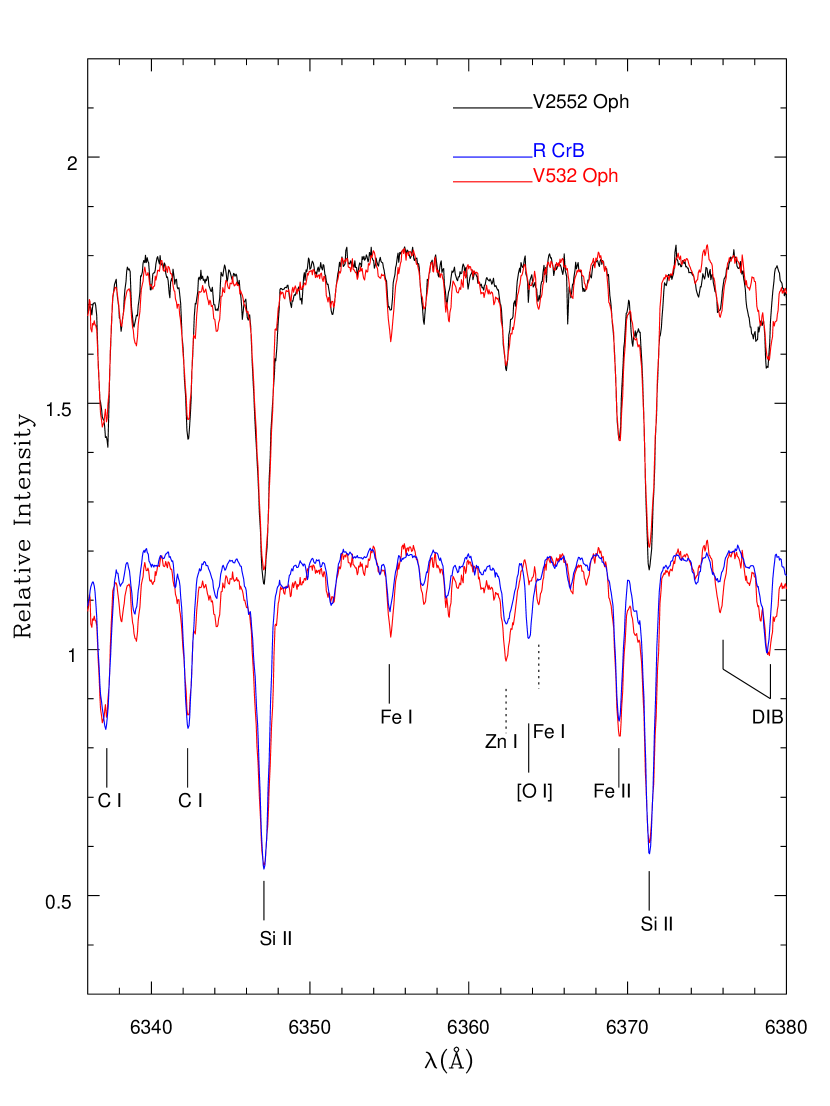
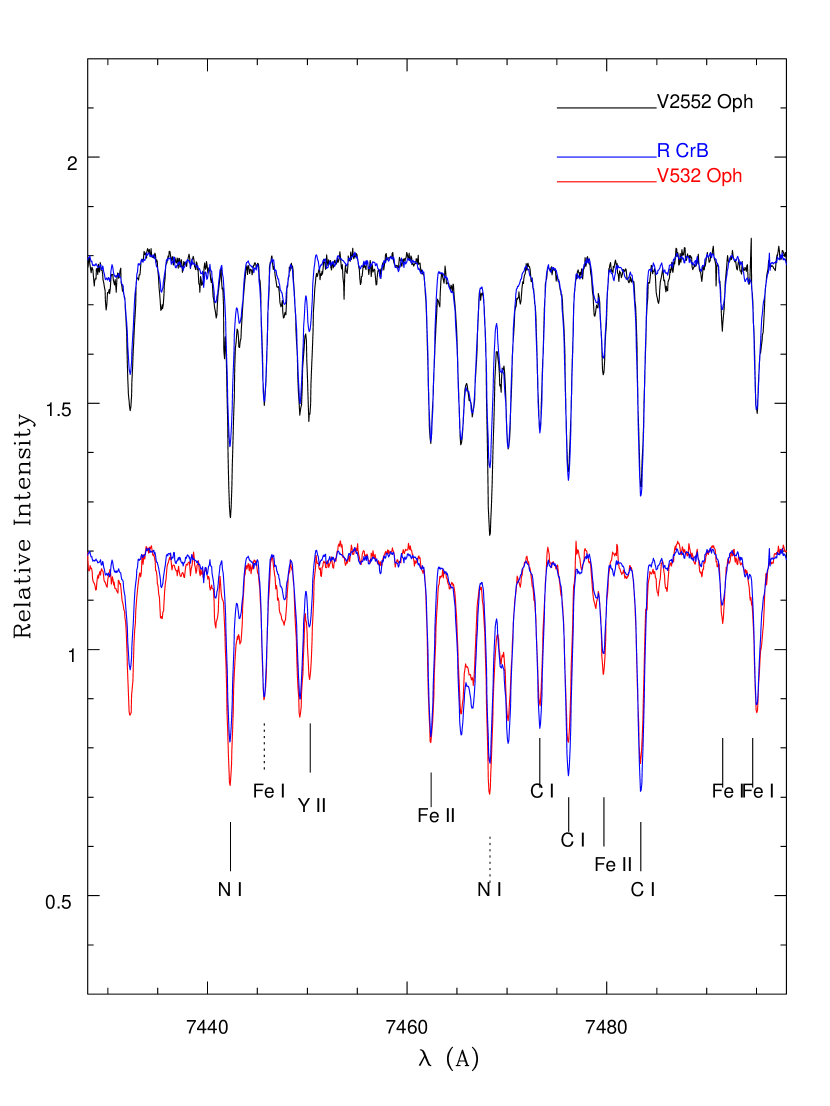
By chemical composition, V532 Oph is a representative member of the majority class of RCB stars (Lambert & Rao 1994) and is set clearly apart from the minority RCBs with their low Fe abundance and very high Si/Fe and S/Fe abundance ratios. Within the majority class, there are real differences in the abundances of certain elements (e.g., H, Li, O and Y) and very little differences in abundance ratios within the elements from Na to Ni. V532 Oph’s composition reflects these differences. For the elements Na to Ni, the composition of V532 Oph is remarkably similar to that of R CrB – entries in the column headed range from +0.16 to for these elements where the differences are comparable or even less than the measurement uncertainties. In contrast, the differences for H, Li, O and Y are much larger than these uncertainties. That these are real differences is directly shown by direct comparison of spectra. For example, the lower O abundance of V532 Oph relative to R CrB is well shown in Figures 4 and 5. Figure 4 compares spectra of R CrB, V532 Oph and V2552 Oph (coincidentally, a similarly O-poor RCB - Rao & Lambert 2003) around the 6156 Å O i multiplet. Figure 5 compares spectra of the same three stars around the 6363 Å [O i] line. (The stronger forbidden line at 6300 Å is not on the recorded portion of the spectra.) Finally, Figure 6 extends the comparison to include a Y ii line which relative to its strength in R CrB is enhanced in both V532 Oph and V2552 Oph. These three RCBs have similar atmospheric parameters and, therefore, differences in the strength of a line are a reflection of an abundance difference.
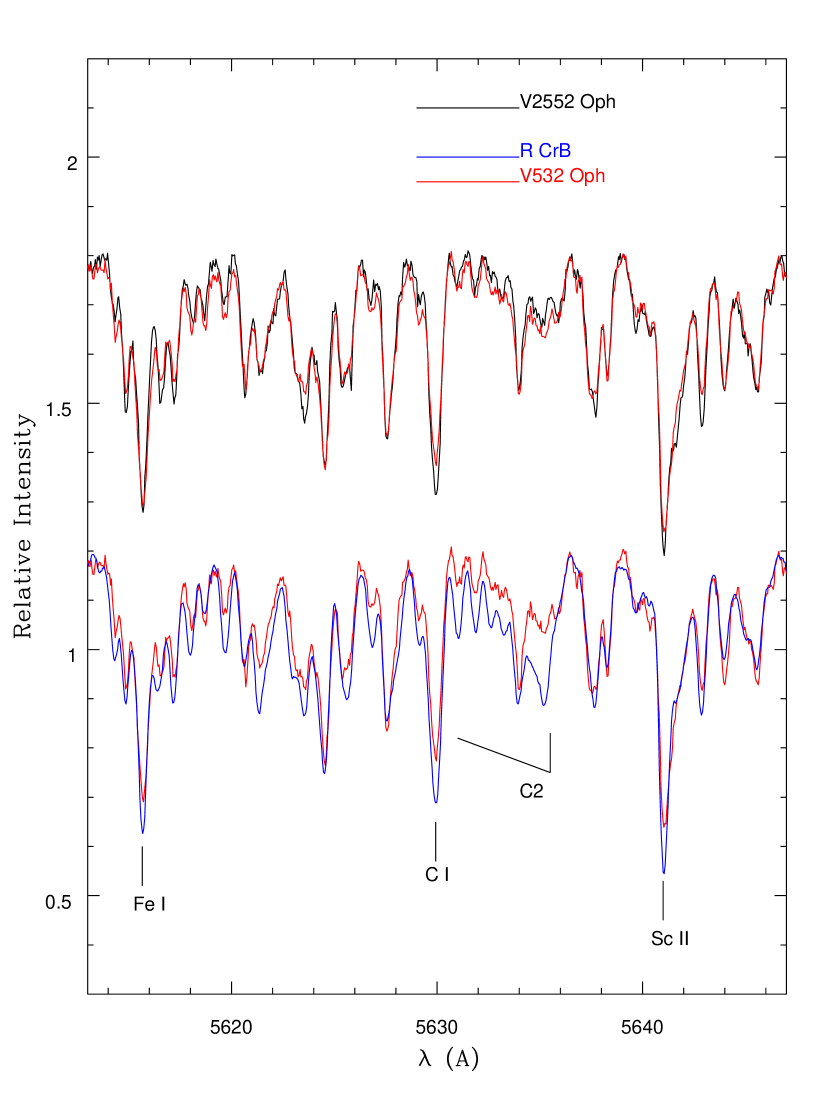
One additional spectroscopic difference between V532 Oph (and V2552 Oph) and R CrB deserves illustration, namely the weakness of the C2 Swan bands in the former pair relative to R CrB – see Figure 7. This difference was noted earlier by Clayton et al. (2009). The weaker Swan bands for V532 Oph presumably reflects the lower C abundance where the Swan band strength depends on the square of the C abundance and a 0.2 dex difference (Table 3) corresponds to nearly a factor of three decrease in the Swan band strength.
Although these samples of spectra of R CrB, V2552 Oph and V532 Oph serve to highlight differences between R CrB and the latter two stars, it should be pointed out that all three stars are fair representatives of ‘majority’ RCBs among which, as noted above, there is an intrinsic spread in abundance for O and Y elements among a few others. In Figure 8, we show histograms for O, S, Fe and Y abundances for majority and minority RCBs with R CrB, V532 Oph and V2552 Oph’s location in the histograms identified. Figure 8 clearly shows that R CrB is among the O-richest and V532 Oph with V2552 Oph are among the O-poorest majority RCBs. In contrast, the S histogram is much narrower and R CrB, V532 Oph and V2552 Oph are in the central core of the histogram. Finally, the histogram for Y shows a real 2 dex spread in Y abundances with R CrB with one of the lowest Y abundances and V532 Oph and V2552 Oph close to the mean for majority RCBs.
| V532 Oph | na | , | R CrBb | c | |
|---|---|---|---|---|---|
| Species | 250 K, 0.5 | ||||
| H i | 6.31 | 1 | 0.14, 0.12 | 6.86 | -0.55 |
| Li i | 0.97 | 1 | …. | 2.55 | -1.6 |
| C i | 8.91 0.34 | 14 | 0.01, 0.02 | 9.11 | 0.20 |
| N i | 8.570.23 | 10 | 0.17, 0.15 | 8.42 | +0.15 |
| O i | 7.900.34 | 6 | 0.11, 0.14 | 8.60 | -0.70 |
| Ne i | 8.620.21 | 3 | 0.35, 0.30 | …. | …. |
| Na i | 6.220.04 | 4 | 0.17, 0.15 | 6.11 | 0.11 |
| Mg i | 6.84 0.10 | 3 | 0.17, 0.15 | 6.81 | 0.03 |
| Mg ii | 6.89 | 1 | 0.09, 0.10 | …. | …. |
| Al i | 5.81 0.15 | 4 | 0.15, 0.15 | 5.76 | 0.05 |
| Si i | 6.93 0.21 | 7 | 0.16, 0.15 | 6.97 | -0.04 |
| Si ii | 6.82 | 1 | 0.18, 0.18 | …. | …. |
| S i | 6.76 0.23 | 7 | 0.08, 0.07 | 6.70 | 0.06 |
| K i | 4.83 | 1 | 0.25, 0.19 | 4.77 | 0.06 |
| Ca i | 5.19 0.21 | 6 | 0.22, 0.19 | 5.32 | -0.13 |
| Sc ii | 2.80 0.27 | 3 | 0.10,0.08 | 2.89 | -0.09 |
| Ti ii | 4.21 0.26 | 2 | 0.05, 0.11 | 4.05 | 0.16 |
| Fe i | 6.47 0.21 | 31 | 0.21,0.15 | 6.40 | 0.07 |
| Fe ii | 6.51 0.13 | 10 | 0.00, 0.12 | 6.40 | 0.11 |
| Ni i | 5.55 0.13 | 5 | 0.22, 0.15 | 5.49 | 0.06 |
| Cu i | 4.08 0.20 | 2 | 0.18, 0.14 | …. | …. |
| Zn i | 4.41 | 1 | 0.17, 0.14 | 4.16 | 0.25 |
| Y ii | 2.08 0.09 | 5 | 0.10, 0.08 | 1.55 | 0.53 |
| Zr ii | 2.11 0.15 | 3 | 0.08, 0.10 | 1.84 | 0.27 |
| Ba ii | 1.45 0.05 | 5 | 0.14,0.07 | 1.13 | 0.32 |
| La ii | 0.67 0.30 | 2 | 0.17, 0.03 | 0.64 | 0.03 |
a n = number of lines used in the analyses.
b From Rao & Lambert (2003).
c Abundance difference between V532Oph and R CrB.
5 V532 Oph is a typical RCB: wind and dust
Other aspects of V532 Oph’s optical spectrum at maximum light show that the star is a typical majority RCB. In particular, there is evidence for a wind off the photosphere. This is clearly shown by the extended blue wing to the O i 7771 Å line (Figure 9) and other strong lines. The implied terminal velocity indicated by each strong line correlates well with the lower excitation potential (LEP) of the line. The velocity-LEP relation is very similar to that shown for R CrB (Rao, Lambert & Shetrone 2006).


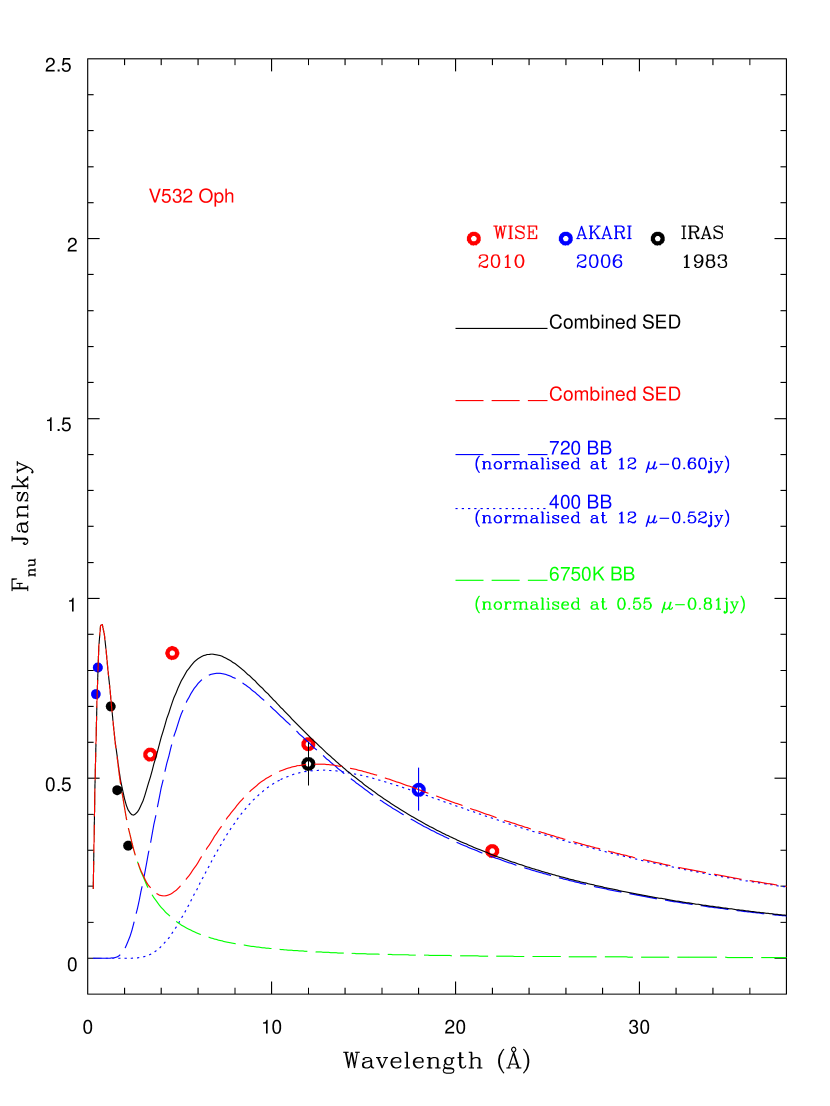
A feature of RCBs is their ability to form carbon soot. If a soot cloud intercepts the line of sight, it causes the characteristic dimming of the star. Such a cloud and others existing off the line of sight absorb starlight and emit in the infrared to provide an infrared excess. Thanks to clouds off the line of sight, an infrared excess will be present even in the absence of a cloud along the line of sight, i.e., when the star is at maximum light. Warm dust may contribute excess flux even at the K or even the H band. Clayton et al. (2009) noted that the interstellar reddening-corrected J-H , H-K colours of V532 Oph appeared unaffected by dust emission. Cooler dust gives an excess at longer wavelengths. For V532 Oph, mid-infrared measurements from the AKARI satellite (Ishihara et al. 2010) detected excess emission at 18m. IRAS also detected the source at 12m but not at 25m (Helou & Walker 1988).
Our recent investigation of Spitzer spectra explored the characteristics of infrared excesses for a large sample of RCBs (García-Hernandez et al. 2011, 2013). In this investigation, a spectral energy distribution (SED) for a star was constructed from optical and infrared photometry corrected for interstellar reddening. A SED for V532 Oph was constructed for E(B-V) = 0.76 with optical photometry from Clayton et al. (2009) and near-infrared photometry from 2MASS (Cutri et al. 2003). Mid-infrared photometry is from satellites IRAS in 1983, AKARI in 2006 and WISE (Wright et al. 2010) in 2010 (Figure 10). The infrared flux in 1983 and 2006 was similar in strength but was appreciably stronger in 2010. A blackbody fit to the stellar fluxes and the infrared emission by dust gives a stellar blackbody temperature of 6750 K and dust temperatures of 400 K in 1983 and 2006 and 700 K in 2010. The fraction of stellar flux absorbed and reemitted by the dust is R = 0.03 in 1983 and 2006 but R = 0.09 in 2010. This value of R is among the lowest values for RCB stars. It is intriguing that V532 Oph has a low O abundance and a low value of R. In a subsequent paper, we explore the possibility that the amount of circumstellar dust as measured by the fraction R is correlated with the O abundance.
6 Concluding remarks
Our high-resolution spectroscopic analysis of the recently discovered RCB V532 Oph (Clayton et al. 2009) confirms that it is a warm RCB. It belongs to the majority RCB class (Lambert & Rao 1994) with a lower than average O abundance and an average Y abundance. It exhibits a stellar wind and circumstellar gas and dust. The dust content as sampled in 1983, 2006 and 2010 is less than average for the RCB sample studied by García-Hernández et al. (2011).
References
- (1) Asplund, M., Gustafsson, B., Kiselman, D., Eriksson, K., 1997, A&A, 318, 521
- (2) Asplund, M., Gustafsson, B., Lambert, D.L., Rao, N. K., 2000, A&A, 353, 287
- (3) Brand, J., Blitz, L. 1993, A&A, 275, 67
- (4) Clayton, G.C., 2012, JAVSO, 40, 539
- (5) Clayton, G.C., Kilkenny, D., Wils, P., Welch, D.L., 2009, PASP, 121, 461
- (6) Cutri, R., et al. 2003, The IRSA 2MASS ALL-Sky Point Source Catalog ( NASA/IPAC Infrared Science Archive; Washington: NASA)
- (7) Flower, P.J., 1996, ApJ, 469, 355
- (8) García-Hernández, D.A., Kameswara Rao, N., Lambert, D.L., 2011, ApJ, 739, 37
- (9) García-Hernández, D.A., Kameswara Rao, N., Lambert, D.L., 2013, ApJ, 773, 107
- (10) Helou, G., Walker, D.W., 1988, Infrared astronomical satellite (IRAS) Catalogs and Atlases. Volume. 7 (Washington: NASA)
- (11) Herbig, G.H. 1993, ApJ, 407, 142
- (12) Hesselbach, E., Clayton, G.C., Smith, P. S., 2003, PASP, 115, 130
- (13) Ishihara, D. et al. 2010. A&A, 514, 1
- (14) Jeffery, C.S et al. 1996, in: Hydrogen deficient stars, Jeffery C.S., Heber U. (eds.). ASP conf. series vol. 96, p. 431
- (15) Kazarovets, E.V., Kireeva, N.N., Samus, N.N., Durlevich, O.V. 2003, IBVS, No. 5422
- (16) Kipper, T., Klochkova, V.G. 2006, Baltic Astr., 15, 531
- (17) Lambert, D. L., Rao, N. K. 1994, JAA, 15, 47
- (18) Luna, R et al. 2008., A&A, 480, 133
- (19) Miller et al. 2012, ApJ, 755, 98
- (20) Rao N.K., Lambert D.L., 2003, PASP, 115, 1304
- (21) Rao, N.K., Lambert, D.L., Shetrone, M.D. 2006, MNRAS, 370, 941
- (22) Schlafly, E.F., Finkbeiner, D.P. 2011, ApJ, 737, 103
- (23) Schlegel, E.J., Finkbeiner, D.P., Davis, M. 1998, ApJ, 500, 525
- (24) Tisserand, P., et al., 2008, A&A, 481, 673
- (25) Tisserand, P., et al., 2009, A&A, 501, 985
- (26) Tisserand, P., et al., 2011, A&A, 529, 118
- (27) Tisserand, P., et al., 2013, A&A, 551, 77
- (28) Tull, R.G., MacQueen, P.J., Sneden, C., Lambert, D.L., 1995, PASP, 107, 251
- (29) Wright, E.L., et al., 2010, A.J., 140, 1868
- (30)