Hot strong matter
Abstract:
The recent results on relativistic heavy-ion collisions are discussed. The most convincing quark-gluon plasma signatures at the LHC and the top RHIC energies are presented. Moreover, the possible methods of evaluating the energy threshold for deconfinement (onset of deconfinement) are described, and the corresponding results from the RHIC Beam Energy Scan and the SPS programs are shown. Additionally, the first signatures of creating dense and collectively behaving systems in collisions of small nuclei (or even in elementary interactions) are discussed. Finally, the current status of experimental search for the critical point of strongly interacting matter is summarized.
1 Introduction
It is a well established fact that matter exists in different states. For strongly interacting matter at least three are expected: normal nuclear matter (liquid), hadron gas (HG), and a system of deconfined quarks and gluons (eventually the quark-gluon plasma, QGP). In cosmology, it is believed that the early Universe consisted of QGP few microseconds after the Big Bang. Nowadays, QGP may exist in the core of neutron stars. One of the most important goals of high-energy heavy-ion collisions is to establish the phase diagram of strongly interacting matter by finding the possible phase boundaries and critical points. In principle, we want to produce the quark-gluon plasma and analyze its properties and the transition between QGP and HG. This goal seems to be truly attractive nowadays, when three heavy-ion accelerators are working and taking data. These are: Super Proton Synchrotron (SPS) at CERN, Relativistic Heavy Ion Collider (RHIC) at BNL and Large Hadron Collider (LHC) at CERN. A very hot and high energy density system is created at the top RHIC (=200 GeV) and current LHC (=2.76 TeV) energies. Therefore, these accelerators are best suited to investigate the properties of quark-gluon plasma. The region of the transition between hadron gas and QGP has been studied by the SPS experiments since more than twenty years, and from 2010 it has been also studied within the Beam Energy Scan (BES) program of the RHIC accelerator.
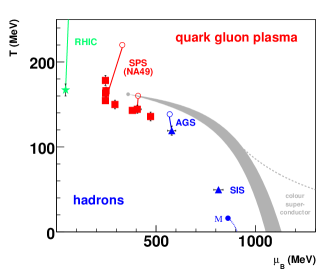
The phase diagram of strongly interacting matter (Fig. 1) is most often presented in terms of temperature () and baryochemical potential (), which reflects net-baryon density. It is believed that for large values of the phase transition is of the first order (gray band) and for low values a rapid but continuous transition (cross-over). A critical point of second order (CP) separates those two regions. The open points in Fig. 1 are hypothetical locations reached by the high-density matter droplet after dissipation of the energy of the incident nucleons from where the evolution of the expanding and cooling fireball starts. The temperatures in these points can reach from 230 MeV to about 600 MeV (from the top SPS to current LHC energies; MeV K) and the energy densities from about 3 GeV/fm3 at the top SPS energy to more than 5 and 15 GeV/fm3 at the top RHIC and LHC energies111These Bjorken’s estimates of energy densities at RHIC and LHC should be treated as lower limits (hydrodynamical models give here much higher values, especially at LHC energies). Moreover, in these estimates the so-called thermalization time was assumed to be fm/c for all energies (Bjorken’s energy density is proportional to ), whereas it is rather commonly believed that at higher energies should be smaller (most probably 0.6 fm/c at the top RHIC energy)., respectively (the energy density of normal nuclear matter is about 0.16 GeV/fm3). The closed symbols in Fig. 1 represent chemical freeze-out points [1] (chemical composition fixed; the end of inelastic interactions). The fireball then expands further until thermal (kinetic) freeze-out takes place (particle momenta are fixed). As the temperature (and energy density) decreases during the expansion, the chemical freeze-out temperature () is higher than the kinetic () one.
The energies of the CERN SPS cover a very important region of the phase diagram. First, the NA49 experiment showed that the energy threshold for deconfinement (minimum energy to create a partonic system) is located at low SPS energies ( GeV or beam energy 30 GeV; see the open point hitting the transition line in Fig. 1) [2]. Second, theoretical calculations suggest that the critical point of strongly interacting matter may be located at energies accessible at the CERN SPS. There are several such predictions available nowadays, let us mention the examples: MeV [3] ( MeV corresponds to MeV [1]), or MeV [4], or ( MeV) [5], where is the cross-over temperature at . It should be, however, stressed that lattice calculations ruling out the CP existence, and showing cross-over transition in the whole range, are also available on the market [6]. Therefore, the experimental results may be crucial in the verification of existing theoretical predictions.
2 LHC and top RHIC energies: ”QGP desert”
If we want to study QGP properties we should focus on LHC and top RHIC energies. The most famous QGP signals at the top RHIC energy are jet quenching and scaling of elliptic flow with the number of constituent quarks. Jet is a ”spray” of collimated particles originating from fragmentation of hard-scattered quark or gluon. There are several ways of studying jets: using algorithms of full jet reconstruction (but they are much more effective in elementary interactions), two-particle correlations in azimuthal angle, and studying nuclear modification factor. The last two are indirect methods of studying jets but since recently these have been the only ways of jet analysis in case of nucleus+nucleus interactions. The nuclear modification factor () is defined as:
| (1) |
where is the number of binary () collisions obtained from the Glauber model. If we want to compare central and peripheral collisions we can use:
| (2) |
For soft processes (low- region) should be smaller than one, because in this case particle production scales with the number of participants () or with the number of wounded nucleons ()222Typically denotes the number of nucleons (from both nuclei) participating in the collision, whereas is the number of participants suffering at least one inelastic interaction.. For hard processes (high- region) we expect that particle production scales with the number of binary collisions () and thus . Therefore, in the absence of nuclear effects we expected that would increase and then saturate at the value of 1. In some interactions (, , etc.) was found to be higher than one at intermediate region. This so-called Cronin effect is interpreted as probably due to initial elastic multiple low-momentum scattering of the parton (from projectile nucleon) on target nucleons. Thus, before the final hard parton+parton interaction the ”projectile parton” already has got its higher than zero. In central collisions at the top RHIC energy the long-awaited [7] suppression of high- particles was observed333See Quark Matter 2014 conference slides for the most recent results on quenching of whole jets (full jet reconstruction) both at RHIC and LHC energies.. Figure 2 (left) shows that this suppressions was a factor of five ( at high close to 0.2), but was not seen for photons (they do not interact strongly with the medium) thus confirming that the observed suppression is a final state effect, which was interpreted as due to parton energy loss while traveling through hot and dense medium produced in collision. The orange solid line in Fig. 2 (left) shows the theoretical predictions for parton energy loss in a medium with gluon density per rapidity unit , which corresponds to the temperature of the medium MeV [8]. The observed jet attenuation (jet quenching) is an evidence of the extreme energy loss of quarks or gluons traversing a large density of color charges and reflects the extreme opacity of the QGP.
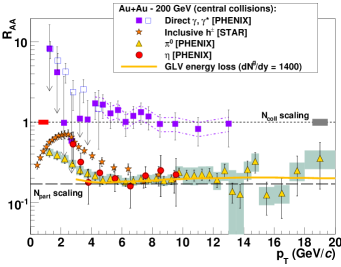
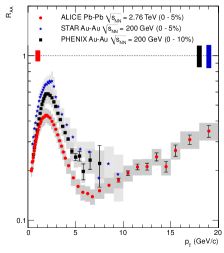
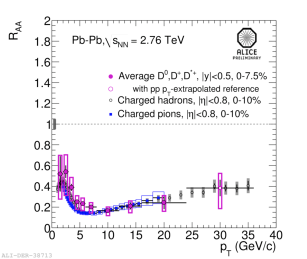
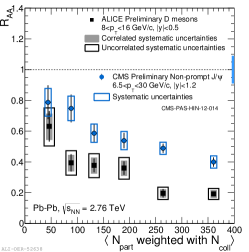
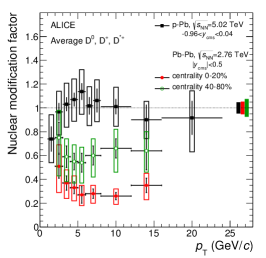
The theory expected that the energy losses (for ) due to induced gluon radiation in a dense color medium should follow hierarchy: [11], but at the top RHIC energy the suppression seems to be similar for light and heavy particles. This can be seen in Fig. 2 (right) for mesons, which at high- region show suppression similar to that of the light particles. Figure 3 presents the nuclear modification factors of different particle species in collisions at the LHC. The suppression of high- particles (at minimum =6-7 GeV/c) is even stronger than at the top RHIC (left plot). Moreover, heavy mesons are suppressed on a similar level as charged particles (middle plot). However, in contrary to the top RHIC energy, the suppression of beauty is smaller, it is . In the case of larger energy loss for charm than for beauty () we can expect . Therefore, Fig. 3 (right) is an indication of larger energy loss for charm than for beauty.
Collectivity, and in principle the scaling of elliptic flow with the number of constituent quarks, is considered as one of the most important QGP signatures in collisions at the top RHIC energy. For non-central collisions the triple differential invariant distribution of particles emitted in the final state is Fourier-decomposed as follows:
| (3) |
where is the rapidity, is the azimuthal angle of a particle in the laboratory frame (see Fig. 4), is the azimuthal angle of the reaction plane (RP) in the laboratory system (different for each event), and are the Fourier coefficients. For central collisions we have radial flow only (the transverse shape is a circle instead of the almond-shaped overlap zone seen by a red color in Fig. 4). For non-central collisions radial flow is modulated by values (flow is anisotropic). In Equation 3 represents radial flow (isotropic emission in azimuthal angle; reaction plane cannot be defined), is the directed flow and the elliptic flow (higher harmonics can be neglected444In Equation 3 the smooth almond-shaped overlap zone is assumed. See [15] for the idea of recent calculations including initial state event-by-event fluctuations in participant positions.).
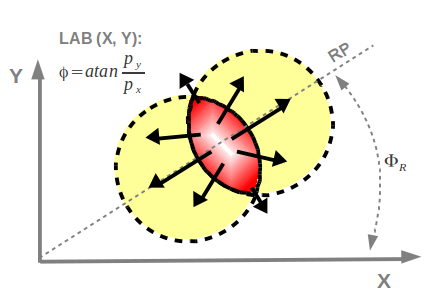
The idea of elliptic flow is schematically shown in Fig. 4, where the initial spatial anisotropy (almond-shaped zone) via rescattering(!) is transformed into pressure gradients (higher in the reaction plane) which, in turn, are converted into anisotropy in momentum space (more particles are emitted ”in-plane” than ”out-of-plane” - see the black arrows in Fig. 4). The elliptic flow is sensitive to the early ( fm/c) history of the collision. Higher pressure gradients ”in-plane” imply that the expansion of the source would gradually diminish its anisotropy, making the so-called self-quenching variable. The elliptic flow builds up early, when the anisotropy is significant, and tends to saturate as the anisotropy continues to decrease. This is unlike the radial flow which continues to grow until freeze-out and is sensitive to both early and later times of the history of the collision. Therefore, is a signature of pressure at early times.
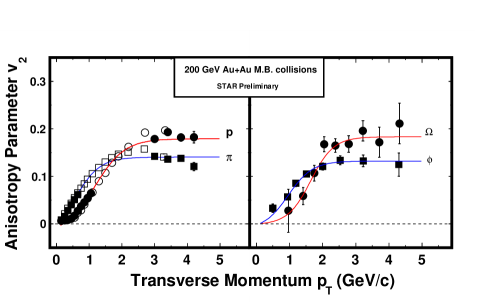
In coalescence models of hadronization (they assume QGP phase!) elliptic flow of hadrons is inherited from elliptic flow of their constituent quarks (hadron flow behaves like a sum of flows of constituent quarks). It was proposed that: and , where is the elliptic flow of a quark. Such a scaling with the number of constituent quarks (so-called NCQ scaling) was indeed observed in collisions at the top RHIC energy; it is even better seen in transverse kinetic energy , where is the particle mass. In the left panel of Fig. 5 two distinct branches are seen, one for baryons and the other for mesons. When the two axes are scaled by (right panel of Fig. 5), the two curves merge into one universal curve, suggesting that the flow is developed at the quark level, and hadrons form by the merging of constituent quarks. The NCQ scaling of is treated as a proof of the partonic collectivity (flow is originally developed on the quark level; quarks flow in QGP). The partonic collectivity is the key QGP signature at the top RHIC energies.

The another evidence of the partonic collectivity can be seen in Fig. 6, where of heavier (including ’s’ quarks) particles is compared with of pions and protons. The mesons are as heavy as protons but their is similar to of mesons, which suggests that is important! Not a particle mass. The fact that ’s’ quarks flow similarly to light ’u’ and ’d’ quarks is an another argument for the partonic collectivity (developed mostly in a deconfined phase). Moreover, and particles have small cross sections for hadronic interactions and probably freeze-out earlier, thus they are promising observables of the early stage (they should be less affected by later stage hadronic interactions). Therefore, the results on suggest that the significant part of collectivity was developed in a partonic stage.
Figure 7 presents the elliptic flow of heavy flavours: mesons (left), mesons (middle), and leptons from heavy flavour decays (right) measured in collisions at the LHC energy. Elliptic flow of mesons is similar to that of the light particles suggesting that charm quarks participate in the collective flow of the expanding medium. Moreover, the of hidden charm ( mesons) is positive (in collisions at the top RHIC energy it was consistent with zero [21]). Finally, Fig. 7 (right) shows that heavy-flavour decay muons and electrons (from ’c’ and ’b’ decays) also experience the anisotropic expansion of the medium (); the same observation was done for heavy-flavour decay electrons at the top RHIC energy [22]. Due to their huge masses ( GeV, GeV) the thermalization and flow of heavy quarks was much less probable. The results shown in Fig. 7 suggest that heavy quarks may be thermalized and may participate in the collective motion of the system! It is sometimes compared to the stones flowing with the stream.
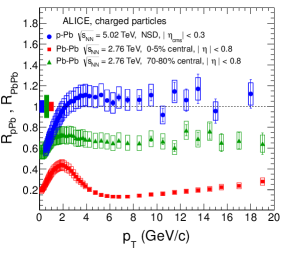
It is now quite well established that at LHC and top RHIC energies QGP is produced in heavy and systems. This is, however, a very important question whether a similar state can be created in collisions of light and intermediate mass systems. Figure 8 (left) shows the nuclear modification factor for collisions at TeV compared to in central and peripheral interactions at TeV. One sees that the suppression of high- particles can be seen even in peripheral collisions, where is only twice higher than in interactions (for a comparison in 5% most central ). At the top RHIC energy in peripheral collisions was close to one. Charged particles in collisions at LHC do not show suppression; similar observation was done for interactions at the top RHIC energy. In Fig. 8 (right) the same conclusions can be drawn from meson production. Heavy mesons in collisions at LHC also do not show suppression, but they are suppressed both in central and (semi)peripheral interactions. Figure 8 confirms that the suppression of high- particles in central, and at LHC also in peripheral collisions is not due to initial-state effects, but rather due to final state interactions in a hot and dense medium (QGP opaque to energetic partons).
Minimum bias collisions at LHC do not show similarities to heavy interactions. The situation is, however, different if we look for central interactions. Figure 9 shows an evidence of the collective flow in small systems. In (Fig. 9 (left)) collisions at LHC, and also in interactions at the top RHIC energy (not shown), a mass ordering of was observed. Such a hierarchy (for a given is lower for a higher-mass particle) is qualitatively reproduced (at lower ) by hydrodynamical models (not shown) and understood as due to radial flow. In hydro models the elliptic flow follows: , where is the transverse expansion velocity (radial flow), is a particle transverse mass, and temperature. Qualitatively a similar mass ordering of has been observed in high multiplicity collisions at LHC (Fig. 9 (middle)), and recently also in central collisions at the top RHIC energy (Fig. 9 (right)). Does () indeed flow? The another evidence of the radial flow in collisions is an increase of with increasing particle mass (see [28]). The same behaviour is well known from data [29] and can be reproduced by hydrodynamical models, where for radial flow . Surprisingly, similar effects have been also observed by the CMS experiment in (!) interactions at 0.9, 2.76, and 7 TeV [30] (so far collisions have been treated as elementary interactions, where the formation of any medium was not expected). The flow-like behaviour in LHC high multiplicity events (both mass splitting and the increase of with increasing particle mass) can be reproduced by recent hydrodynamical calculations (see for example [31]). The interaction region is small but dense and perhaps we can apply hydrodynamics to high-multiplicity and collisions.
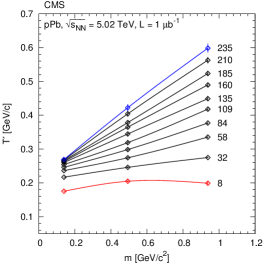
The more direct evidence of the radial flow in small systems can be seen in Fig. 10. The left panel shows inverse slope parameters () of exponential spectra (Boltzmann-type distribution: ) for different multiplicity bins ( given as the numbers next to the lines) of collisions at TeV. In the case of a static source the inverse slope parameter () is equal to the thermal (kinetic) freeze-out temperature (). In the case of an expanding source is equal to the freeze-out temperature () plus the effect of the radial flow. The example for a non-relativistic case () follows: . Figure 10 (left) shows that in LHC collisions the flow-like behaviour (increase of with a particle mass) becomes much stronger for the highest multiplicity events.
The thermal freeze-out parameters ( and the mean transverse flow velocity ) can be more precisely obtained via fits within the Blast-Wave Model [33], where spectra follow:
| (4) |
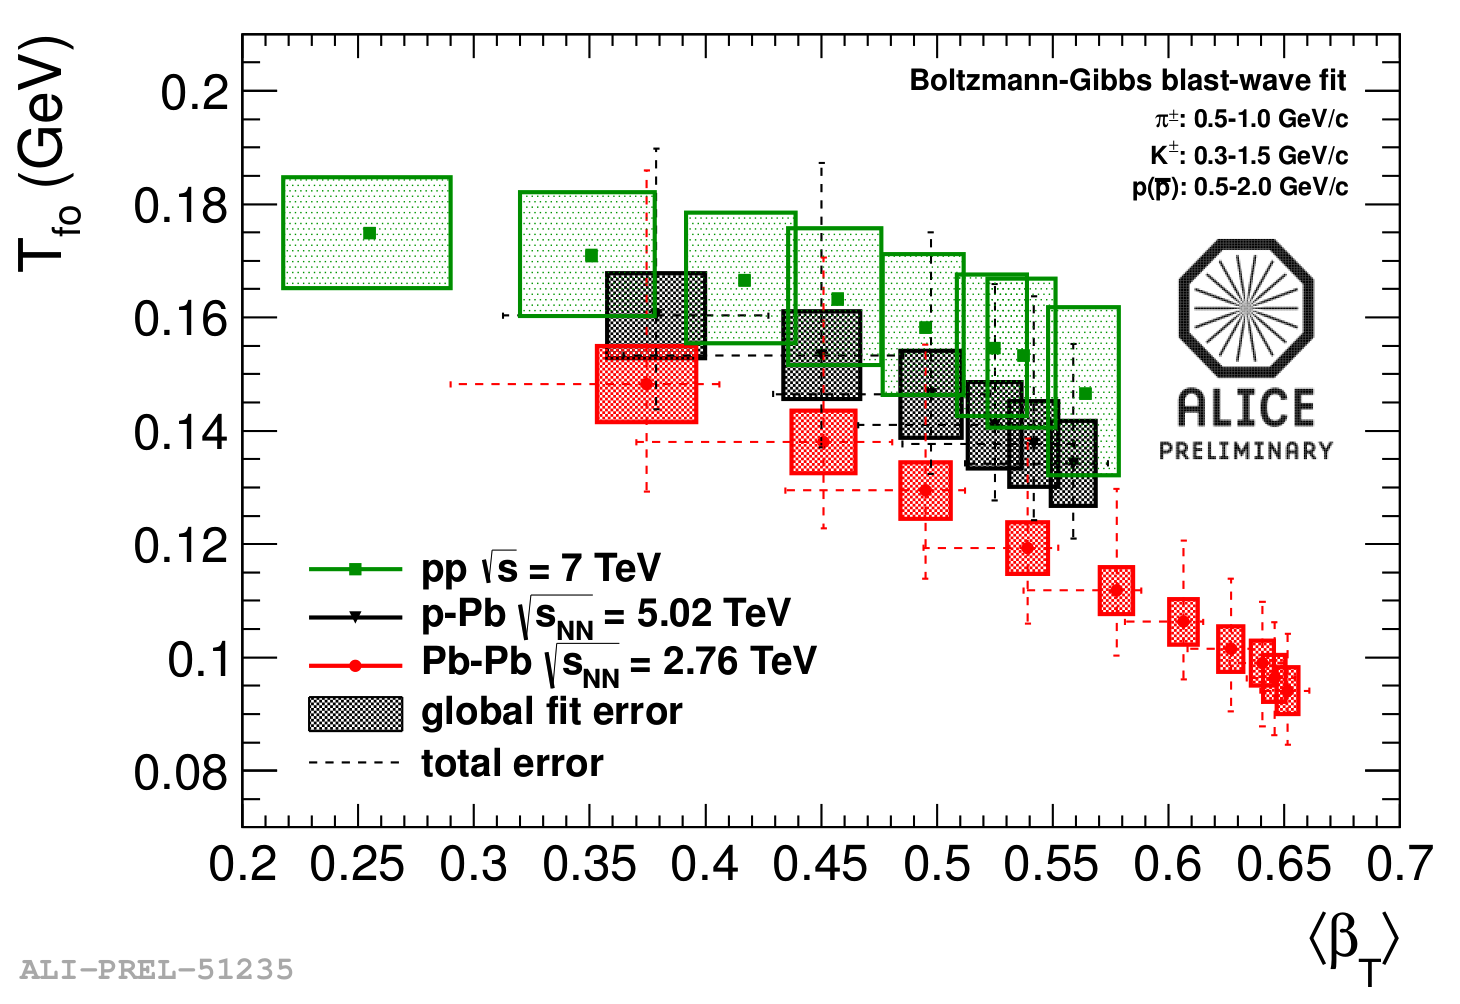
and are modified Bessel functions, , and the transverse velocity profile , where is the radius of the fireball555, and thus is smaller than . . Figure 10 (right) shows the results of the Blast-Wave Model fits for different centralities (or multiplicities) of , , and collisions at LHC energies. For more central events higher values were obtained. Moreover, a similar evolution of versus is seen in all systems. In the most central collisions =0.65c (10% higher than in at the top RHIC). In central interactions c, but similar values are also seen in collisions! Thus, Fig. 10 (right) should be considered as a possible sign of collectivity in and interactions666Other explanations are also available on the market - see LHC results [35] in the PYTHIA model with Color Reconnection [36] (CR) mechanism, which acts on a microscopic level, and therefore does not require formation of thermalized medium in a small system. Generally, there is no flow in PYTHIA, but CR (color string formation between final partons from independent hard scatterings) can mimic flow-like trends seen in data. Note, that Color Reconnections are coherent effects between strings and therefore they might be treated as a some form of collectivity!.
3 SPS and lower RHIC energies: ”boiling water”
If we want to study the phase transition region and search for the critical point of strongly interacting matter we should focus on the SPS and lower RHIC energies. There are dedicated energy scan programs both at SPS (NA49 and NA61/SHINE experiments) and at RHIC (Beam Energy Scan (BES) program with STAR and PHENIX experiments).
3.1 Looking for the onset of deconfinement energy
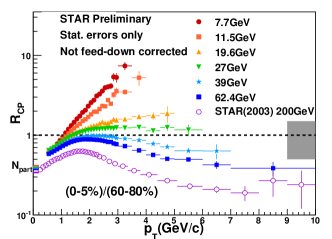
Figure 11 (left) shows the energy dependence of charged particles measured in collisions within STAR BES program. As seen, jet quenching disappear at lower energies (absence of a dense medium), and a figure of this type is quite often referred to as a ”turn-off” of QGP signature. At lower energies partonic effects become less important and cold nuclear matter effects (Cronin) start to dominate (see also HIJING results with jet quenching off [39]). Figure 11 (right) presents measured by PHENIX for neutral pions with GeV/c at three BES energies. The suppression of high- particles is similar at GeV and GeV, but significantly smaller at GeV.

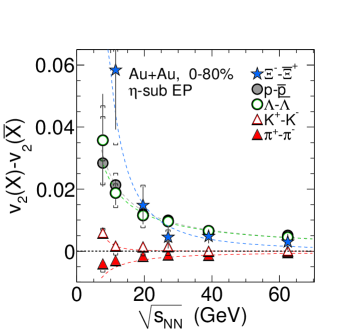
The observation of breaking of the NCQ scaling at lower energies can be also treated as a new method of estimation of the onset of deconfinement energy. This type of ”turn-off” of QGP signature was also observed by the STAR experiment within BES program. The scaling of the elliptic flow with favors partonic degrees of freedom, whereas breaking of scaling with favors hadronic degrees of freedom. Figure 12 shows the difference between of the particle and its antiparticle at lower energies. Breaking of the partonic collectivity at lower energies may be interpreted as a change of degrees of freedom in the system (departing from QGP region).
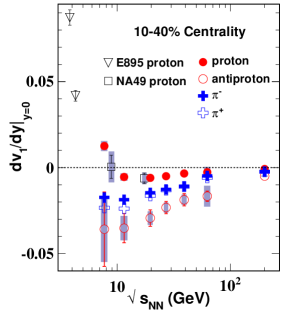
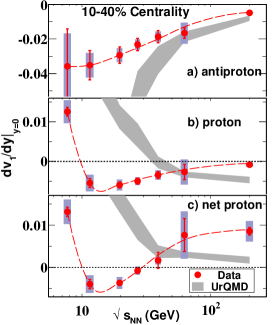
The next signature connected with the energy threshold for deconfinement is based on a measurement of the directed flow as a function of rapidity777Rapidity , where is a particle longitudinal momentum (beam direction) and its total energy.. Directed flow () was considered to be sensitive to the 1st order phase transition (strong softening of the Equation of State) [41]. In principle, the ”collapse of proton flow”, namely, the non-monotonic behaviour (positive negative positive) of proton as a function of beam energy was expected. The recent STAR results for collisions are shown in Fig. 13. The slopes are always negative for pions and anti-protons, whereas slopes for protons and net-protons change signs at lower energies and show minimum at 10–20 GeV. The additional data sets at =15 GeV are expected to be recorded by STAR in the next phase of BES program (BES-II). This may allow to determine the position of the minimum more precisely. The results shown in Fig. 13 are consistent with hydrodynamical models assuming 1st order phase transition from hadron gas to QGP [41], however, some calculations suggest that the scenario with a cross-over type transition may lead to similar structures [43].
The Beam Energy Scan program at RHIC collected data which allowed to roughly estimate the energy threshold for deconfinement. Two of the three signatures shown above are based on the observation of the disappearance of a given QGP signal seen previously at higher energies (”turn-off” of QGP signature). But we can estimate the energy threshold for deconfinement even more precisely. This was done several years ago by the NA49 experiment at CERN SPS, where ”sharp onset” of deconfinement was observed. In 2002 the NA49 experiment completed the SPS energy scan of central collisions. This program was originally motivated by predictions of the Statistical Model of the Early Stage (SMES) [44] assuming that the energy threshold for deconfinement (the lowest energy sufficient to create a partonic system) is located at low SPS energies. Several structures were expected within SMES: the kink in pion production (due to increased entropy production), the horn in the strangeness to entropy ratio, and the step in the inverse slope parameter of transverse mass spectra (constant temperature and pressure in a mixed phase). Such signatures were indeed observed in collisions by the NA49 experiment [2], thus locating the onset of deconfinement (OD) energy around 30 GeV beam energy ( GeV). Until recently the evidence of OD was based on the results of a single experiment. Last years the results on central collisions at the LHC [45] and data on central collisions from the RHIC BES program [46] were released. They allowed to verify the NA49 results and their interpretation by STAR and ALICE.
Figure 14 (left) shows production of charged pions (the total entropy is carried mainly by pions888In SMES the total entropy and the total strangeness are the same before and after hadronization (the entropy cannot decrease during the transition from QGP to hadron gas), therefore pions measure the early stage entropy.) normalized to the number of wounded nucleons versus Fermi variable (). In SMES, this ratio is proportional to the effective number of degrees of freedom () to the power of 1/4. For central collisions ( for SPS and LHC or for AGS and RHIC) a change of slope around 30 GeV ( GeV) is visible (slope in increases from 1 (AGS) to 1.3 (top SPS+RHIC) - consistent with increase by a factor of 3 in ). Such an increase is not observed for reactions (not shown). The increase in , when going from hadron gas to QGP, may be interpreted as a consequence of the activation of partonic degrees of freedom. The RHIC BES points follow the line for collisions and the LHC point999The mean pion multiplicity at LHC was estimated based on the ALICE measurement of charged particle multiplicity, see [47] for details., within a large error, does not contradict extrapolations from high SPS and RHIC energies.
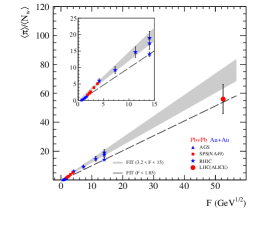
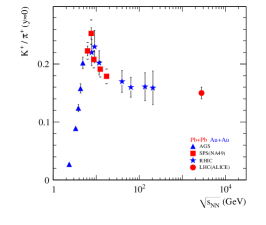
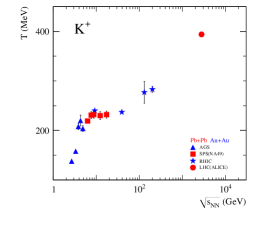
Figure 14 (middle) presents the ratio near mid-rapidity versus energy. In SMES, the ratio is proportional to strangeness/entropy densities. Results for are very different from the results for ( are not shown here; see [2]) and show a sharp peak (horn) in at GeV. As seen, RHIC results confirm NA49 measurements at the onset of deconfinement. Moreover, LHC (ALICE) data demonstrate that the energy dependence of hadron production properties shows rapid changes only at low SPS energies, and a smooth evolution is observed between the top SPS (=17.3 GeV) and the current LHC (=2.76 TeV) energies. The measure which much better reflects the total strangeness to entropy ratio in the SPS energy range is , proposed in [44], and calculated from , , and yields in acceptance. The ratio can be directly and quantitatively compared to SMES predictions. The ratio shows a distinct peak in at 30 GeV (not shown; see figure in [2]). This behavior is described (predicted) only by the model assuming a phase transition (i.e. SMES), where the maximum (horn), is the result of the decrease of strangeness carrier masses in the QGP () and the change in the number of degrees of freedom when reaching the deconfined state.
Figure 14 (right) presents inverse slope parameters () of transverse mass spectra101010 spectra were parametrized by and fits were done close to mid-rapidity. of positively charged kaons. For data one can see a strong rise at AGS, plateau at SPS, and rise towards RHIC and LHC energies. Such structure is not observed for collisions (not shown). The plateau is consistent with constant temperature and pressure in the mixed phase (latent heat) [48]. In fact, this structure (step) strongly resembles the behavior of water, where a plateau can be observed in the temperature when heat is added. Models (not shown) without phase transition do not reproduce the data, but a hydrodynamical model incorporating a deconfinement phase transition at SPS energies [49] describes the results in Fig. 14 (right) quite well.
All three structures (kink, horn, step) confirm that results agree with the interpretation of the NA49 structures as due to OD. Above the onset energy only a smooth change of QGP properties with increasing energy is expected.
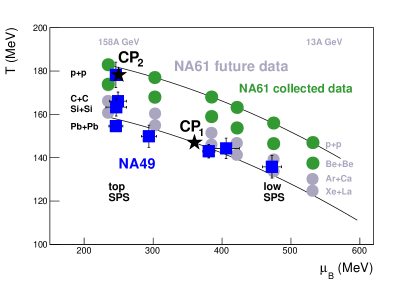
The signatures of the onset of deconfinement energy are seen at middle SPS energies for heavy and systems. This is, however, a very important question whether the onset of deconfinement can be also seen in collisions of light and intermediate mass systems. This question can be answer by the NA61/SHINE 111111SHINE SPS Heavy Ion and Neutrino Experiment. experiment which is the successor of NA49 (the main detector components are inherited from NA49 but several important upgrades were done). The main goals of the NA61 ion program are: search for the critical point, study of the properties of the onset of deconfinement, and study high physics (energy dependence of the nuclear modification factor). These goals will be achieved by performing a comprehensive scan in the whole SPS energy range ( GeV; GeV) with light and intermediate mass nuclei (, , , ). It will allow to cover a broad range of the phase diagram (the expected chemical freeze-out points are shown in Fig. 15), and to search for the onset of the horn, kink, step, etc. in collisions of light nuclei (the structures observed for / should vanish with decreasing system size).
The first NA61 results on spectra, yields, fluctuations, and correlations in collisions are already available [50, 51, 52, 53] and the kink and step plots with NA61 results can be found i.e. in [51]. Here we would like to focus on the structure which was not yet discussed above, it is on the dale [54]. According to hydrodynamical model [55] the sound velocity () is related to the width of the rapidity distribution () of pions:
| (5) |
Figure 16 (middle) shows the sound velocities obtained from the widths of rapidity spectra presented in Fig. 16 (left). Lattice QCD calculations [56] (see Fig. 16 (right)) suggest that the minimum of the sound velocity (softest point of the Equation of State) can be attributed to the phase transition between hadron gas and QGP. Surprisingly, in Fig. 16 (middle) such a minimum (dale) can be seen not only for collisions but also in data!
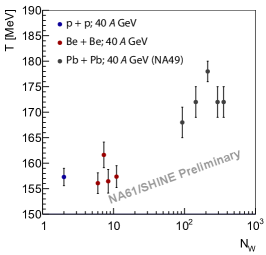
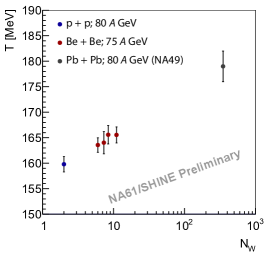
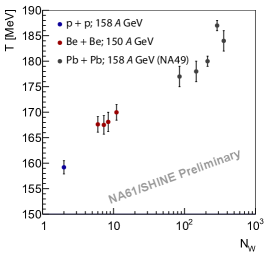
The first preliminary NA61 results from ion beams ( collisions) are also available [57]. When we consider the density of the solid state Beryllium is quite light (1.85 g/cm3) when compared to Lead (11.3 g/cm3). However, at the highest SPS energies the system created after collision seems to show the effects which were originally attributed to heavy ion interactions. Figure 17 shows mid-rapidity transverse mass spectra of in [50], [57], and [2] collisions at the top SPS energy. The spectra in collisions are approximately exponential, whereas the convex shape can be seen in and interactions. The spectra were fitted in the range GeV/c2 using the formula . The resulting inverse slope parameters () are presented in Fig.18 for three SPS energies. Here, it is worth to remind that in the case of a static source the inverse slope parameter () is equal to the thermal (kinetic) freeze-out temperature ().
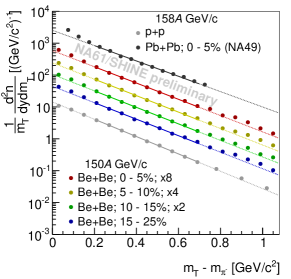
In the case of an expanding source is equal to the freeze-out temperature () plus the effect of the radial flow. The NA61 results show that at middle SPS energy (40 GeV) inverse slope parameters are similar for and collisions (). In contrast, at the top SPS energy values are significantly larger than . This result is treated as a possible evidence of the transverse collective flow in collisions at higher SPS energies (Beryllium looks heavy at the top SPS energy). The results from the analysis of other particles (kaons, protons, etc.) are expected soon and, in principle, complete Blast-Wave Model fits, as well as kink, horn, step, and dale plots should be available also for interactions.
3.2 Looking for the critical point
The critical point of strongly interacting matter can be nowadays treated as the Holy Grail of modern heavy-ion physics. We do not have solid conclusions from experimental results, and also theorists do not reach the agreement concerning the location and even the existence of the critical point (see review paper [58] and the recent lattice predictions above). Fluctuations and correlations can help to locate the critical point of strongly interacting matter. This is in analogy to critical opalescence (observed in most liquids, including water), where we expect enlarged fluctuations close to the CP. For strongly interacting matter a maximum of fluctuations is expected when the freeze-out (not the early stage!) happens near the CP. Therefore, the CP should be searched rather above the onset of deconfinement energy, found by NA49 to be GeV [2].
Over the past years several experimental observables were proposed to look for the CP in heavy ion collisions. Among them are fluctuations of mean transverse momentum and multiplicity [59], pion pair (sigma mode) and proton intermittency [60], etc. The NA49 experiment used the scaled variance of multiplicity distributions () and the measure to quantify multiplicity and average fluctuations, respectively121212In the case of no fluctuations/correlations =0, =0. For a Poisson multiplicity distribution equals 1. The is a strongly intensive measure of fluctuations (in thermodynamical models it does not depend on volume and volume fluctuations), whereas is an intensive one (it does not depend on volume but depends on volume fluctuations, and therefore NA49 used only 0-1% most central data to study in collisions). See also [61] for other new strongly intensive measures of fluctuations used since recently by NA49 and NA61. (see [62] for details). The position of the chemical freeze-out point in the () diagram can be varied by changing the energy and the size of the colliding system [1] as presented in Fig. 15 ( decreases from to interactions at the top SPS energy, and decreases with increasing energy of collisions). Therefore, NA49 analyzed the energy () dependence of and for central collisions, and their system size () dependence (, central , , and ) at the highest SPS energy.
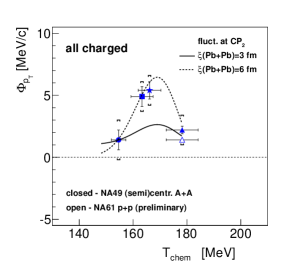
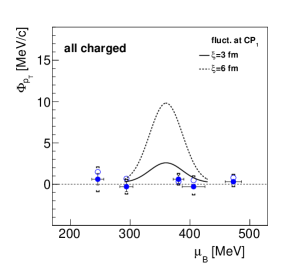
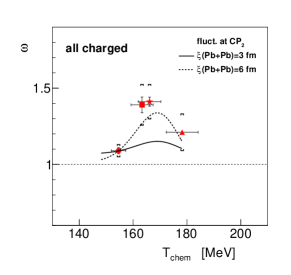
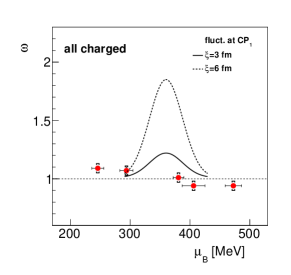
Figure 19 shows that there are no indications of the CP in the energy dependence of multiplicity and mean fluctuations in central collisions (closed points, right panels). However, the system size dependence of both measures at 158 GeV ( GeV) shows a maximum for and interactions [62] (left panels, closed symbols). The peak is even two times higher for all charged than for negatively charged particles (not shown, see [62]) as expected for the CP [59]. This result is consistent with a CP location near the freeze-out point of interactions at the top SPS energy (178 MeV, MeV; CP2 in Fig. 15). The theoretical magnitude of the CP effect has a maximum close to instead of system due to the fact that the correlation length in the model monotonically decreases with decreasing size of the colliding system (see [62] for details).
The critical point search will be continued by the NA61/SHINE experiment, where a two-dimensional scan of the phase diagram will be performed (see Fig. 15). A maximum of CP signatures (fluctuations of multiplicity, average , intermittency, etc.), so-called hill of fluctuations, is expected when the system freezes out close to CP. The first preliminary NA61 results from interactions [61, 63] are shown in Fig. 19 as open points. There is no significant difference between the energy dependence of fluctuations for NA61 and NA49 central collisions (both experiments used the same NA49 phase-space cuts). There are no indications of critical point in the energy scan of and interactions and we are waiting for the results from , , and .

Other fluctuation measures were studied both by SPS and RHIC experiments, but the general conclusion is that the energy dependence of fluctuations for heavy-ion collisions (/) does not show any effects that can be attributed to CP. NA49 and NA61 did not find any possible signatures of CP when studying the energy dependence ( and also collisions) of chemical (particle type) fluctuations [51, 53, 64, 65]. Also, electric charge [66] and azimuthal angle [64] fluctuations in central data did not show any unexpected behaviour. The RHIC BES studied: net-charge and net-proton fluctuations [67], correlations, particle ratio (chemical) fluctuations [68], but again, within the uncertainties, no clear non-monotonic behaviour, and thus no clear evidence of CP in the energy scan of collisions was observed. The ranges of the existing and future heavy-ion experiments are presented in Fig. 20.
4 Summary
At the LHC and top RHIC energies we mainly study the properties of quark-gluon plasma. The existence of QGP in / collisions at high energies is well established, but there are some interesting measurements suggesting that the collectivity may be present also in high multiplicity and collisions (but note that the collectivity does not necessarily mean QGP formation). Therefore, and events should not be treated merely as a boring reference to interactions! The radial flow may be present also in light system at higher SPS energies.
At the SPS and RHIC Beam Energy Scan energies we can study the transition region between QGP and hadron gas. Several observables (RHIC BES and NA49: , NCQ scaling of , , kink, horn, step, dale, etc.) show that the energy threshold for deconfinement in / collisions is located close to middle SPS energies. Is will be very interesting to check whether QGP may be created also in smaller systems (energy scan with small and intermediate mass systems in NA61). At SPS and RHIC BES energies we can also look for the critical point of strongly interacting matter. Fluctuations of average , multiplicity, multiplicity of low mass pairs and protons (see [69] for the last two) tend to a maximum in collisions at the top SPS. It might be connected with CP at SPS energies, which is a strong motivation for future experiments. However, it is the beginning of the story! Much more effort is needed both from experimental (corrections, proper measures of fluctuations, etc.) and theoretical (lattice, models with predicted magnitudes of fluctuation measures at CP) side.
Acknowledgements: This work was supported by the the National Science Centre, Poland grant 2012/04/M/ST2/00816. Katarzyna Grebieszkow would like to thank the organizers of XXII. International Workshop on Deep-Inelastic Scattering and Related Subjects for inviting her and giving the opportunity to present the recent results from heavy-ion experiments.
References
- [1] F. Beccatini, J. Manninen, M. Gazdzicki, Phys. Rev. C 73, 044905 (2006).
-
[2]
S.V. Afanasiev et al. (NA49 Collab.), Phys. Rev. C 66, 054902 (2002);
C. Alt et al. (NA49 Collab.), Phys. Rev. C 77, 024903 (2008). - [3] Z. Fodor, S.D. Katz, J. High Energy Phys. 0404, 050 (2004).
- [4] A. Li et al., RIKEN-BNL Workshop On Fluctuations, Correlations and RHIC Low Energy Runs, Oct. 3-5 (2011), http://www.bnl.gov/fcrworkshop/
- [5] S. Datta, R.V. Gavai, S. Gupta, Nucl. Phys. A 904-905, 883c (2013).
-
[6]
G. Endrodi, Z. Fodor, S.D. Katz, K.K. Szabo, J. High Energy Phys. 1104, 001 (2011);
P. de Forcrand, O. Philipsen, J. High Energy Phys. 0701, 077 (2007). -
[7]
J.D. Bjorken, FERMILAB-PUB-82-59-THY (1982);
J.D. Bjorken, Phys. Rev. D 27, 140 (1983);
X.N. Wang, M. Gyulassy, Phys. Rev. Lett. 68, 1480 (1992);
M. Gyulassy, M. Plumer, Phys. Lett. B 243, 432 (1990). - [8] D. d’Enterria, Nucl. Phys. A 827, 356c (2009).
- [9] L. Adamczyk et al. (STAR Collab.), arXiv:1404.6185v1.
-
[10]
B. Trzeciak (for STAR Collab.), WWND 2014 slides;
Z. Ye (for STAR Collab.), Quark Matter 2014 slides. -
[11]
R. Baier at al., Nucl. Phys. B 484, 265 (1997);
Y.L. Dokshitzer, D.E. Kharzeev, Phys. Lett. B 519, 199 (2001). - [12] K. Aamodt et al. (ALICE Collab.), Phys. Lett. B 696, 30 (2011).
-
[13]
A. Andronic (for ALICE Collab.), Journal of Phys.: Conf. Series 455, 012002 (2013);
A. Mischke, arXiv:1301.7550v1. -
[14]
C. Jena (for ALICE Collab.), WWND 2014 slides;
A. Grelli (for ALICE Collab.), arXiv:1310.7366v1. - [15] R.S. Bhalerao, CERN-2014-001 (2014) [arXiv:1404.3294v1].
- [16] U.W. Heinz, Phys. Scripta 78, 028005 (2008).
- [17] S. Shi (for STAR Collab.), Nucl. Phys. A 830, 187c (2009).
- [18] B. Abelev et al. (ALICE Collab.), Phys. Rev. Lett. 111, 102301 (2013).
- [19] E. Abbas et al. (ALICE Collab.), Phys. Rev. Lett. 111, 162301 (2013).
- [20] R. Bailhache (for ALICE Collab.), Quark Matter 2014 slides.
- [21] L. Adamczyk et al. (STAR Collab.), Phys. Rev. Lett. 111, 052301 (2013).
- [22] L. Adamczyk et al. (STAR Collab.), arXiv:1405.6348v1.
- [23] B. Abelev et al. (ALICE Collab.), Phys. Rev. Lett. 110, 082302 (2013).
- [24] B. Abelev et al. (ALICE Collab.), arXiv:1405.3452v1.
- [25] B. Abelev et al. (ALICE Collab.), arXiv:1405.4632v1.
- [26] B. Abelev et al. (ALICE Collab.), Phys. Lett. B 726, 164 (2013).
- [27] A. Adare et al. (PHENIX Collab.), arXiv:1404.7461v1.
- [28] C. Loizides, EPJ Web Conf. 60, 06004 (2013) [arXiv:1308.1377v2].
- [29] B. Abelev el al. (ALICE Collab.), Phys. Rev. C 88, 044910 (2013).
- [30] S. Chatrchyan et al. (CMS Collab.), Eur. Phys. J. C 72, 2164 (2012).
- [31] P. Bozek, B. Broniowski, Nucl. Phys. A 926, 16 (2014).
- [32] S. Chatrchyan et al. (CMS Collab.), Eur. Phys. J. C 74, 2847 (2014).
- [33] E. Schnedermann et al., Phys. Rev. C 48, 2462 (1993).
- [34] A. Timmins (for ALICE Collab.), WWND 2014 slides.
-
[35]
A.O. Velasquez (for ALICE Collab.), arXiv:1404.4354v1;
B.B. Abelev at al. (ALICE Coollab.), Phys. Lett. B 727, 371 (2013). - [36] T. Sjostrand, LU TP 13-37 (2013) [arXiv:1310.8073v1].
- [37] E. Sangaline (for STAR Collab.), Nucl. Phys. A, 904-905, 771c (2013).
- [38] J.T. Mitchell (for PHENIX Collab.), PoS(CPOD 2013)003 (2013) [arXiv:1308.2185v1].
- [39] M. Sumbera (for STAR Collab.), PoS(EPS-HEP 2013)195 (2014), [arXiv:1312.2718v1].
- [40] L. Adamczyk et al. (STAR Collab.), Phys. Rev. Lett. 110, 142301 (2013).
-
[41]
L.P. Csernai, D. Rohrich, Phys. Lett. B 458, 454 (1999);
H. Stoecker, Nucl. Phys. A 750, 121 (2005);
J. Brachmann et al., Phys. Rev. C61, 024909 (2000). - [42] L. Adamczyk et al. (STAR Collab.), Phys. Rev. Lett. 112, 162301 (2014).
- [43] V. P. Konchakovski et al., arXiv:1404.2765v1.
- [44] M. Gazdzicki, M. Gorenstein, Acta Phys. Polon. B 30, 2705 (1999).
-
[45]
J. Schukraft (for ALICE Collab.), J. Phys. G 38, 124003 (2011);
A. Toia (for ALICE Collab.), J. Phys. G 38, 124007 (2011). -
[46]
L. Kumar (for STAR Collab.), J. Phys. G 38, 124145 (2011);
B. Mohanty (for STAR Collab.), J. Phys. G 38, 124023 (2011). - [47] A. Rustamov, https://indico.cern.ch/conferenceDisplay.py?confId=144745
- [48] M. Gorenstein et al., Phys. Lett. B 567, 175 (2003).
- [49] Y. Hama et al., Braz. J. Phys. 34, 322 (2004).
- [50] N. Abgrall et al. (NA61/SHINE Collab.), Eur. Phys. J. C 74, 2794 (2014).
- [51] K. Grebieszkow (for NA61/SHINE Collab.), PoS(CPOD 2013)004 (2013).
- [52] S. Pulawski (for NA61/SHINE Collab.), PoS(CPOD 2013)056 (2013).
- [53] M. Mackowiak-Pawlowska (for NA61/SHINE Collab.), PoS(CPOD 2013)048 (2013).
- [54] M. Gazdzicki, M. Gorenstein, P. Seyboth, Acta Phys. Polon. B 42 307 (2011).
- [55] V. Shuryak, Yad. Fiz. 16, 395 (1972).
- [56] S. Borsanyi et al., J. High Energy Phys. 1011, 077 (2010).
-
[57]
E. Kaptur (for NA61/SHINE Collab.), X Polish Workshop on Relativistic Heavy-Ion Collisions (Dec. 2013)
http://www.ujk.edu.pl/homepages/mryb/10thworkshop/files/slides/kaptur.pdf - [58] M. Stephanov, Acta Phys. Polon. B 35, 2939 (2004).
- [59] M. Stephanov, K. Rajagopal, E.V. Shuryak, Phys. Rev. D 60, 114028 (1999).
-
[60]
N.G. Antoniou et al., Nucl. Phys. A 761, 149 (2005);
N.G. Antoniou, F.K. Diakonos, A.S. Kapoyannis, Phys.Rev. C 81, 011901(R) (2010). -
[61]
K. Grebieszkow (for NA49 and NA61 Collab.), X Polish Workshop
on Relativistic Heavy-Ion Collisions (Dec. 2013)
http://www.ujk.edu.pl/homepages/mryb/10thworkshop/files/slides/grebieszkow.pdf - [62] K. Grebieszkow (for NA49 Collab.), Nucl. Phys. A 830, 547c (2009), and references therein.
- [63] P. Seyboth (for NA49 and NA61 Collab.), arXiv:1402.4619v1.
- [64] K. Grebieszkow (for NA49 Collab.), Acta Phys. Polon. B 43, 609 (2012).
- [65] T. Anticic et al. (NA49 Collab.), Phys. Rev. C 89, 054902 (2014).
- [66] C. Alt et al. (NA49 Collab.), Phys. Rev. C 70, 064903 (2004).
-
[67]
L. Adamczyk et al. (STAR Collab.), arXiv:1402.1558v2;
B. Mohanty, arXiv:1402.3818v1. - [68] N.R. Sahoo (for STAR Collab.), arXiv:1407.1554v1.
-
[69]
T. Anticic et al. (NA49 Collab.), Phys. Rev. C 81, 064907 (2010);
T. Anticic et al. (NA49 Collab.), arXiv:1208.5292v2.