Slow dynamics of
salol: a pressure and temperature dependent
light scattering study.
Abstract
We study the slow dynamics of salol by varying both temperature and pressure using photon correlation spectroscopy and pressure-volume-temperature measurements, and compare the behavior of the structural relaxation time with equations derived within the Adam-Gibbs entropy theory and the Cohen-Grest free volume theory. We find that pressure dependent data are crucial to assess the validity of these model equations. Our analysis supports the entropy-based equation, and estimates the configurational entropy of salol at ambient pressure 70% of the excess entropy. Finally, we investigate the evolution of the shape of the structural relaxation process, and find that a time-temperature-pressure superposition principle holds over the range investigated.
pacs:
78.35.+c, 61.20.LC, 78.70.Ck, 64.70.PfI INTRODUCTION
The study of the supercooled liquid and glassy states in molecular systems is, nowadays, one of the most important topics in the physics of disordered materials. Though the molecular processes underlying glass formation still constitute an unsettled subject, some traces of universality in the behavior of highly viscous liquids near vitrification have been noticed. As general characteristics, on approaching the glass transition the structural () relaxation process shows i) a non-Debye behavior of the relaxation function, and ii) a dramatic increase of the relaxation time, .
Different physical routes can be covered to get vitrification. Decreasing the temperature, , is the common way to form a glass. However, varying the pressure, , also represents an effective means. Indeed, the effects on molecular motions of an isothermal compression resemble those which are caused by an isobaric cooling. For practical reasons, cooling is generally preferred, since high pressures (of the order of MPa) are necessary to produce dynamical changes similar to those obtained by changing the temperature within few tens of degrees. Anyway, the study of the relaxation pressure dependence can give an insight into the nature of the liquid-glass transition.
The past few years have actually seen a growing use of hydrostatic pressure in experimental investigations of glass formers (see for instance, Corezzi99 ; Paluch98 ; PaluchPRL2000 ; Casalini ; CasaliniJCP02 ; PaluchJCP03a ; PaluchJCP03b ; PaluchJCP02a ; PaluchJCP02b ). Such experiments provide a more stringent testing-ground for the numerous models proposed of the structural relaxation time evolution near vitrification. Among these, two are the most widely used, which are based on the free volume and configurational entropy concepts. Free volume approaches consider the decrease of unoccupied volume as the basic mechanism leading to structural arrest of a liquid system. The alternative view is that the progressive slowdown of molecular motions responsible for the glass transition is due to a reduction of the system’s configurational entropy.
In this paper, we test on salol the ability of free volume and configurational entropy models to interpret the temperature and pressure dependence of the structural relaxation time. Salol, is a good candidate since much of the thermodynamic data is known, allowing refinement on testing theoretical models. It has intensively been studied at ambient pressure with several spectroscopic techniques, like Brillouin scattering Dreyfus92 , depolarized light scattering Li92 ; Cummins93 ; Krakoviack97 , impulsive stimulated light scattering NelsonPRL95 , optical Kerr effect spectroscopy Hinze00 , neutron scattering Toulouse93 , x-ray diffraction Eckstein00 , and dielectric spectroscopy Stickel95 . On the other hand, few experiments have been carried out by varying both temperature and pressure, namely dielectric spectroscopy CasaliniJPC03 , depolarized Raman scattering Pratesi00 , and viscosity measurements Schug80 . Recently, some of us presented a preliminary investigation ComezPRE02 on salol performed in the and domain by using photon correlation spectroscopy. Here, we extend our analysis through pressure-volume-temperature (PVT) data taken in both the supercooled and crystalline phases. We show how an appropriate use of the PVT results provides a realistic estimate of the configurational contribution to the excess entropy of salol. Finally, we compare our data with the prediction of the pressure-extended Cohen-Grest model CohGre79 , derived in the frame of the free volume theory.
II THEORY
II.1 THE PRESSURE EXTENDED ADAM-GIBBS (PEAG) MODEL
The entropy model by Adam and Gibbs (AG) AG is based on the concept of configurational entropy and the assumption of cooperatively rearranging regions. Starting from the observation that the sluggish relaxation behavior governing the glass transition is a manifestation of a dearth of configurations accessible to the system, the AG theory states a relationship between the structural relaxation time, , and the configurational entropy :
| (1) |
where is nearly constant, and is the relaxation
time at very high temperature. measures the entropic
contribution arising from the possibility of a system to
rearrange its structure in different configurations, which is
typical of a liquid. Theoretically, a quantitative evaluation of
can be done in terms of the difference between the entropy
of the liquid phase and the entropy of an ideal amorphous-solid
phase (ideal glass) in which only vibrations (harmonic and
anharmonic) and secondary relaxation processes are active
GoldsteinJCP76 ; JohariJCP2000 . This quantity can, in
principle, be determined by computer simulations, but is
inaccessible to experiments in a direct manner. Some efforts have
been made to bypass a direct experimental determination of
configurational entropy in a number of liquids. Unfortunately,
the procedures proposed require an independent estimate of
vibrational contributions to the entropy over a broad range of
temperatures Phillips89 ; giapponesi or an estimate of the
excess vibrational entropy at Johari , all of which
implying non-trivial approximations. We also remark that all the
previous estimates of are based on temperature dependent
data alone, and are not constrained by pressure dependent data.
Furthermore, much literature documented the extensive use of the
experimentally accessible liquid over crystal (or glass) excess
entropy, , in place of , showing that the AG
expression works well in a number of systems with
replaced by GreetTurnbull67 ; RicAng98 . In this
context, understanding the relationship between and
is a challenging issue. A proportionality of these two
quantities at atmospheric pressure has recently been proposed
Martinez , but a verification of such hypothesis through a
relaxation experiment performed as a function of temperature
alone cannot be conclusive, as the proportionality constant would
simply renormalize the value of in Eq. (1).
Building on this background, a method based on a pressure extended Adam-Gibbs (PEAG) equation has recently been proposed by some of us Corezzicond-mat to analyze temperature and pressure dependent relaxation measurements. The pressure dependence of has been introduced in Eq. (1) writing the configurational entropy of a system at a given and as a sum of (i) an isobaric contribution at zero pressure, , and (ii) an isothermal contribution at temperature , :
| (2) |
(i) Here, the isobaric configurational term, at zero pressure, is assumed proportional to the excess entropy:
| (3) |
The parameter (1) quantifies the fraction of excess entropy at =0 arising from structural configurations. In addition, the excess entropy contains any contribution from secondary relaxation processes and vibrational motions GoldsteinJCP76 ; JohariJCP2000 ; Fischer02 . It can be evaluated from the heat capacity of the liquid and the crystal, through the equation:
| (4) | |||||
where is the entropy of fusion.
(ii) According to the Maxwell relationship , the isothermal term in Eq.(2) can be written
| (5) |
where is the configurational thermal expansion at temperature expansion . This term can be evaluated from PVT measurements as follows. The Tait equation Tait is used to describe the volume of the liquid phase as a function of and
| (6) |
where is a dimensionless constant, and is well described by , where has the dimension of pressure and of inverse of temperature VanKrevelen . Moreover, it is reasonable to presume that the pressure dependence of the thermal expansion of the ideal glass would be much smaller than that of the liquid, and can be neglected. Accordingly, the non-structural thermal expansion at can be replaced by its value at =0, i.e., . Under these assumptions, calculating the integral in Eq. (5) yields
| (7) |
where , and is the thermal expansion coefficient at zero pressure.
In conclusion, combining Eqs. [1-3] provides a formula for the structural relaxation time as a function of temperature and pressure:
| (8) |
with and given by Eq. (4) and (7), respectively. It is important to emphasize that the expression of , Eq. (7), prevents the parameter in Eq. (8) from playing the role of a simple renormalization constant.
II.2 THE PRESSURE EXTENDED COHEN-GREST (CG) MODEL
Within a free volume picture, Cohen and Grest CohGre79 derived a model to describe the behavior of dense liquids and glasses on the basis of a percolative approach. The existence is assumed of glass-like and liquid-like domains. The fraction, , of these latter increases with temperature, and a percolative (infinite) cluster does exist above a critical concentration , at which the transition from the glass to the liquid state occurs. The model predicts an analytical expression for the free volume which is valid in a broad range of temperatures:
| (9) |
where , , and are constants with the dimension of temperature, pressure, and volume, respectively. For near and greater than , a link is established between and the diffusion coefficient , which recovers the Doolittle equation doolittle , , in the case of . Here, is the molecular volume, is a constant, and is the average size of the liquid-like clusters. A similar result is assumed for the rotational correlation time, CohGre81 , where is the value of in the limit of very high temperature under isobaric conditions. On this basis, a simple equation for the structural relaxation time in the supercooled state can be written:
| (10) |
where is related to the pre-exponential factor , and the parameters and have the dimension of temperature, and must assume positive values to have a physical meaning.
Cohen and Grest incorporate the effect of pressure in their theory by including an additional term, proportional to pressure, into their expression for the local free energy. As a consequence, the pressure dependence of the relaxation time can be obtained by changing . The temperature parameter is also affected by this change, via the relationship , with a constant, which yields . The final expression for is:
| (11) |
with and . Note that this expression contains five parameters, i.e. , , , , and , only the first four appearing in the temperature dependent expression at =0, i.e. in Eq. (10).
III Experiment
III.1 PVT Measurements
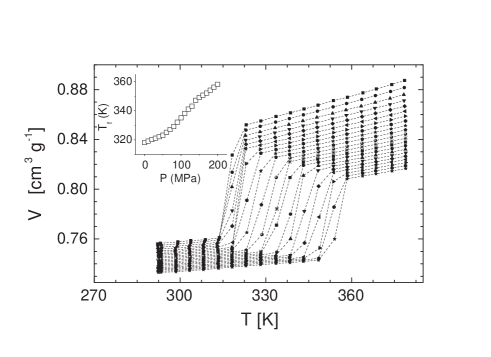
Measurements of specific volume change of crystalline and liquid salol were taken in an isothermal mode of operation by using a confining fluid technique ZolWal95 . The PVT data were acquired on a GNOMIX apparatus Gnomix described in Refs. ZolWal95, ; ZolBol76, . The sample (salol) and the confining fluid (mercury) were contained in a rigid sample cell. A thin nickel foil sample cup surrounding the sample was used to guarantee hydrostatic pressure during the experiment. Silicon oil was used as pressurizing fluid. The temperature was recorded (for operational reasons) close to the sample, but actually in the pressurizing silicon oil. At a fixed temperature, starting from the low-temperature end, pressure was increased to 200 MPa, and data were recorded in pressure intervals of 10 MPa. On completion of measurements along one isotherm, the temperature setting was increased 5 K higher, and the pressure measurements were repeated. measurements were converted into specific volume data by using a reference density value, =1.1742 g cm-3 at =323.15 K. The whole set of PVT measurements between =290 K and 380 K over the 0.1-200 MPa range of pressure is reported in Fig. 1. The step in the data at a given pressure marks the fusion/crystallization temperature.
III.2 Photon correlation measurements
Photon correlation spectroscopy (PCS) measurements under high hydrostatic pressure, up to 190 MPa, were taken at different temperatures (namely 267.1, 268.6, 271.0, 274.6, 278.3 and 280.4 K). Depolarized (VH) light scattering spectra were collected in the 90∘ geometry using an apparatus consisting of an Ar-ion laser, operating at 514.5 nm, a home made thermostated high pressure cell (a detailed description of the cell is reported in refs. FytPat82, ; Fytas84, ), and an ALV5000E digital correlator. The scattered light was collected by a single mode fiber optics and detected by an avalanche diode (Sandercock). High pressure was generated by using nitrogen pressurized by a Nova Swiss membrane compressor and introducing the gas over steel capillaries connected with the high pressure cell. The pressure was measured by a Heise gauge with a resolution of 0.3 MPa, and the temperature by a thermocouple with a typical error of 0.1 K. Special care was taken to prepare the sample avoiding crystallization on both lowering the temperature and increasing the pressure. A cleaning procedure to have dust-free cells was used consisting of rinsing the cells with freshly distilled hot acetone. Salol [2-hydroxy benzoic acid phenyl ester, 2-(HO) C6H4CO2C6H5] purchased from Aldrich company, purity 99 %, was filtered (0.22m Millipore filter) into the dust-free cylindrical cell of 10 mm o.d. at about 80∘C. The sample was then brought back to room temperature at a very slow cooling rate. The measurements were performed following isothermal curves by varying the pressure. Each isothermal run was usually done from the higher to the lower value of pressure, this procedure assuring a shorter equilibration time before starting the measurement. Finally, we checked that the diffusion time of N2 was long enough to prevent contamination of the scattering volume during the experiment. To this end the forward beam was continuously monitored on a black screen to directly visualize possible vertical gradients of the refractive index of the sample.
IV RESULTS
IV.1 Thermodynamic parameters
The and dependence of the volume can be expressed through
the Tait equation, Eq. (6), found to be valid for a wide
range of materials including liquids and polymers, for changes of
the volume up to 40 of the initial value. From the analysis
of the data at atmospheric pressure in the liquid state we
numerically find a constant value of the thermal expansion
coefficient , consistent with the
expression describing the
temperature behavior of the volume of liquid salol at
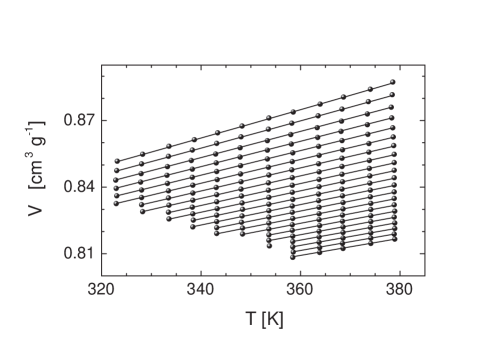
zeropressure . The whole set of PVT data in the liquid
state is then fitted by Eq. (6). In Fig. 3 the
experimental data are shown together with the result of the fit
(solid lines). An excellent agreement between experimental points
and fit curves is obtained with the values of the parameters
, , , , and reported in Tab.
1. It is possible to recognize some generality of
the parameters of the Tait equation VanKrevelen . Indeed,
the values of () and ( 4x10⁻³
K-1) have been found to be almost the same for a lot of
materials, liquids and polymers, including chlorinated biphenyl
(PCB62) CasaliniJCP02 , diglycidylether of bisphenol A
(DGEBA) PaluchJCP03a , bis-phenol-C-dimethylether (BCDE) and
bis-kresol-C-dimethylether (BKDE) PaluchJCP03b ,
phenylphthalein-dimethylether (PDE) PaluchJCP02b and
cresolphthalein-dimethylether (KDE) PaluchJCP02a .
In the crystalline phase, PVT measurements allow us to evaluate
the thermal expansivity at different pressures. In particular, we
find that
ranges from about m3 mol-1
K-1 at =0.1 MPa to about
m3 mol-1 K-1 at =200 MPa, with an
average value
m3 mol-1 K-1 over the pressure range
investigated.
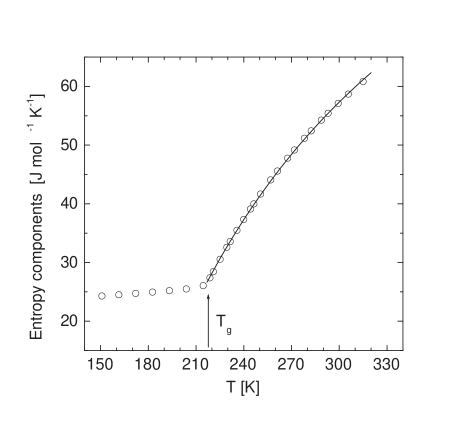
The heat capacity of crystalline, glassy, supercooled and stable liquid salol at atmospheric pressure was measured by adiabatic calorimetry Oguni ; OguniPrivate . From these data, the glass transition temperature =2171 K and the temperature of fusion =315.0 K are determined, and the excess entropy of the liquid over the crystal, , is calculated by using Eq. (4), with the value J mol-1 K-1 for the entropy of fusion. In Fig. 4 the experimental excess entropy is shown with circles.
| [m3 mol-1] | |
|---|---|
| [K-1] | |
| [MPa] | |
| [K-1] | |
IV.2 Dynamic parameters
In the PCS experiment the homodyne technique is used, which measures the normalized time correlation function of the scattering intensity . For a Gaussian process, the intensity autocorrelation function is related to the autocorrelation function of the scattered field, , through the Siegert equation Berne :
| (12) |
where is a constant. The relaxation function of a glass-forming system is generally broader than a single exponential, and experimental data are typically represented by the phenomenological Kohlrausch-Williams-Watts (KWW) function KWW :
| (13) |
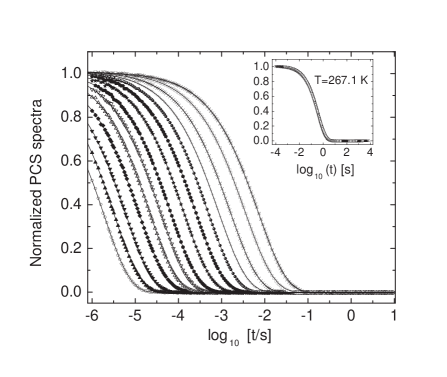
Therefore, PCS spectra are fitted by using Eqs. (12) and (13). The results show an excellent agreement between experimental data and fit curves. Typical normalized homodyne correlation spectra (symbols), taken at 267.1 K in the 88-189.5 MPa pressure range, are represented in Fig. 2 together with their KWW fits (solid lines). The values of the relaxation time and of the stretching parameter have been used to calculate the average relaxation time , through the formula
| (14) |
where is the Euler -function. The values of as a function of pressure at different temperatures are shown as symbols in Fig. 5.
Following the evolution with and of the shape of the
relaxation function, we find that no appreciable variation is
observable on the stretching parameter by changing and .
This evidence is further supported when a master plot is drawn,
showing that the spectra taken at different pressures collapse
into a single curve (see inset of Fig. 2). Our determination of
the stretching parameter () agrees with
previous results at ambient pressure and low temperatures from PCS
measurements: Berger96 , and
SidebottomSorensen . Different
techniques, such as dielectric spectroscopy
Stickel95 ; Berger96 and impulsive stimulated light
scattering Yang1995 , also found a time-temperature
superposition (TTS) principle to hold in salol at low
temperatures. Remarkably, our results indicate the validity of a
generalized time-temperature-pressure superposition (TTPS)
principle in the slow dynamic regime, and support recent finding
of only a modest broadening of the dielectric peak with
increasing pressure up to 0.7 GPa CasaliniJPC03 .
Moreover, Olsen et al. Olse01 recently reinvestigated TTS
at low temperatures for a large number of systems concluding that
a high-frequency slope of the peak close to -1/2 is
expected whenever TTS applies. To confront with this expectation,
we first evaluate, through the relationship Lind80
| (15) |
the value of a Cole-Davidson shape parameter, , corresponding to our value of in the time domain. We find =(, and then the peak actually decays approximately as at high frequencies, at any temperature and any pressure considered here.
V DISCUSSION
V.1 Check of the PEAG model
Our relaxation data are well in the range in which strong intermolecular cooperativity is expected for salol Stickel95 ; RicAng98 ; CasaliniJCP2003 . To check the consistency of the PEAG model with our relaxation data, following Sec. II.1 we need to determine both the isobaric contribution at zero pressure and the isothermal contribution at temperature of the configurational entropy, Eq. (2). The former contribution is related to the excess entropy of the liquid over its crystalline phase at ambient pressure, Eq. (3). The latter is given by Eq. (7).
The temperature behavior of the excess entropy is well described, over the whole range between and , by the function , as observed in a number of other glass formers RicAng98 . The best fit curve corresponds to the parameters J mol-1 K-1, J mol-1, (see Fig. 4). Hence, Eq. (3) becomes , where and are known, and will be free in the global fit with Eq. (8).
For what concerns the isothermal term, Eq. (7), the expressions , , and are known from the analysis of PVT data. Numerical details are reported in Tab. 2. The only parameter which couldn’t be determined experimentally is the thermal expansivity associated with non-structural contributions. Although the value of this parameter will be derived from the fit, we expect that such a value should compare well with that calculated in the crystal of salol, as our sample is grown in a polycrystalline form that should mimic better than a perfect crystal the vibrational properties of an ideal amorphous solid.
| (K) | (MPa) | (m3mol-1K-1) | (MPa) | |
|---|---|---|---|---|
| 267.1 | 88.0-189.5 | 3.588 | 1.287x10⁻⁷ | 225.1 |
| 268.6 | 110.0-180.0 | 3.588 | 1.289x10⁻⁷ | 223.5 |
| 271.0 | 115.5-185.0 | 3.588 | 1.291x10⁻⁷ | 220.9 |
| 274.6 | 140.0-185.0 | 3.588 | 1.294x10⁻⁷ | 217.3 |
| 278.3 | 155.5-190.0 | 3.588 | 1.298x10⁻⁷ | 213.6 |
| 280.4 | 150.0-194.0 | 3.588 | 1.30x10⁻⁷ | 211.5 |
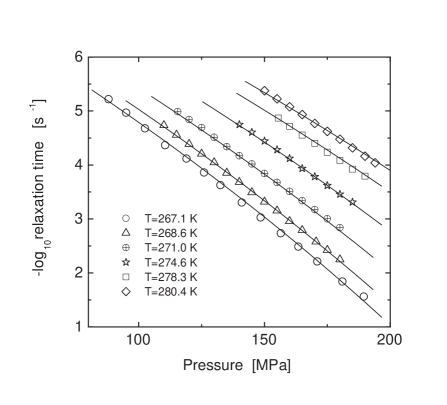
Summarizing, in the fit of relaxation time data with Eq. (8) only four parameters, specifically , , , and , remain to be adjusted. The fit is carried out simultaneously in the - domains, over the pressure range MPa at six different temperatures (=267.1, 268.6, 271.0, 274.6, 278.3, and 280.4 K). The best fit curves (solid lines in Fig. 5) correspond to the values: , J mol-1, , m3 mol-1 K-1.
It is important to remark that the value obtained for the non-structural thermal expansion compares well with the value calculated for the polycrystal of salol, while it is only in feasible agreement with that estimated by some of us, m3 mol-1 K-1, in a previous determination using a preset in Eq. (8), i.e. obtained by replacing the configurational entropy with the excess entropy ComezPRE02 . Moreover, we note that the best fit yields a value for whose uncertainty spans the variation with and of the crystal thermal expansion. Thus, it emerges that the approximation is justified, and it is unnecessary to consider a and dependence of the non-structural expansion in Eq. (5).
V.2 Check of the CG model
Various models interpreting the dynamics of supercooled liquids
provide an equation to represent data as a function of
temperature. Among these, the most frequently used is the
Vogel-Fulcher-Tamman (VFT) equation Vogel . However, its
adaptability to experimental data has been demonstrated only over
a limited range of temperatures. In fact, Stickel et al.
Stickel95 ; Stickel have shown that two VFT equations are
needed to describe the relaxation data at ambient pressure for
temperatures ranging from just above the glass transition up to
very high temperatures, because of a change of dynamics occuring
in the vicinity of a crossover temperature . On
the other hand, the CG expression at ambient pressure, by virtue
of four characteristic parameters, one more than the VFT, succeeds
in describing structural relaxation times in a broad range of
temperatures. Positive tests have been reported on several glass
forming systems CohGre79 ; CumLi97 ; SchLun99 . Recently,
Paluch et al. Paluch03 have also shown that the
characteristic temperature of the CG model can be
identified with in a number of liquids, suggesting that the
change of dynamics may be related to an onset of percolation of
the free volume. However, estimates of the free volume available
per liquid-like molecule founded on such a description clash with
estimates extracted from dilatometric measurements Paluch03 .
An interesting and not frequently exploited testing-ground for
this model is the comparison with relaxation data obtained by
varying both temperature and pressure. To do this, in the case of
salol, we analyze the temperature dependent relaxation times at
ambient pressure, available in the literature
Li92 ; Berger96 , using Eq. (10), and compare the
results with those obtained from our data at variable pressure,
using Eq. (11).
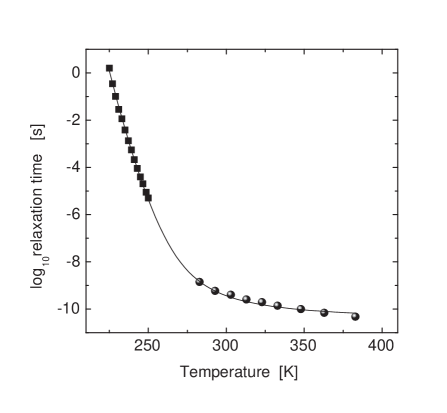
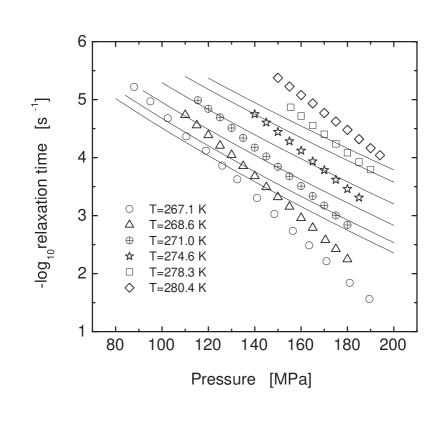
Depolarized light scattering measurements on salol performed at ambient pressure by photon correlation spectroscopy Berger96 and Brillouin and Raman spectroscopy Li92 are reported in Fig. 6, spanning a wide time-temperature range. The fit parameters of Eq. (10) are: , K, K, and K, confirming that matches the crossover temperature 265 K Stickel ; Paluch03 .
Then, we test the generalized CG equation on our data. In the fit procedure, the parameters , , , and are taken fixed to those obtained from the fit of the data at ambient pressure, these four being the same parameters which also appear in Eq. (10), and is the only free parameter. The inability of the CG equation to represent the variation of with pressure is apparent in Fig. 6, where the solid lines are generated by Eq. (11). On the other hand, treating all the parameters as free the fitting algorithm does not converge. A similar result has also been obtained for an epoxy system CorezziCPL . The inapplicability of the generalized CG equation prompts disfavor towards the robustness of the CG theory. Nevertheless, the free volume approach remains physically attractive, and we cannot exclude that the inadequacy of Eq. (11) to describe the data might be ascribed to the number of simplifications used to derive the equation, which are possibly no longer valid at high pressures.
VI Conclusions
In conclusion, we have studied the slow dynamics of salol under
variable temperature and pressure using PCS in combination with
PVT measurements. Comparing the behavior of the structural
relaxation time with equations derived within the AG entropy
theory and the CG free volume theory, we find that pressure
dependent data are crucial to assess the validity of model
equations of the glass transition. In particular, we confirm
previous work CorezziCPL showing that the pressure
dependent expression of predicted by the CG model cannot
reproduce the experimental data, despite the presence of five
adjustable parameters and an ability to parametrize
data over a broad temperature range at ambient pressure. Instead,
experimental data conform to the entropy-based PEAG
equation. Interestingly, since the parameters which control the
pressure dependence of have separately been determined via
PVT measurements, this equation requires only four adjustable
parameters in the and intervals investigated in the
present work. Remarkably, the deduced parameters yield physical
results. Especially, the fraction of excess entropy which arises
from structural configurations is realistically estimated (
70% at ambient pressure).
In an effort to determine the role played by volume and thermal
effects in driving molecular dynamics, Casalini et al.
CasaliniJPC03 have recognized that neither temperature nor
volume is the dominant variable governing the structural
relaxation of salol near , consistently with results for a
number of other glass formers PaluchJCP03b ; PaluchPRB2002 .
Conceptually, this result accords with our findings that the
dominant thermodynamic variable is configurational entropy, a
quantity which embodies both temperature and volume effects:
different relative contributions to of thermal energy and
volume reflect a different sensitivity of the number of
configurations to change following temperature and volume changes.
We believe that the positive test of the PEAG model presented here should stimulate further work on other glass formers and by different techniques.
We thank Prof. E.W. Fischer and Prof. C.A. Angell for valuable comments and suggestions .
References
- (1) S. Corezzi, P.A. Rolla, M. Paluch, J. Zioło, D. Fioretto, Phys. Rev. E 60, 4444 (1999).
- (2) M. Paluch and J. Zioło, Europhys. Lett. 44, 315 (1998).
- (3) M. Paluch, A. Patkowski, E.W. Fischer, Phys. Rev. Lett. 85 2140 (2000). M. Paluch, J. Gapinski, A. Patkowski, E.W. Fischer, J. Chem. Phys. 114, 8048 (2001).
- (4) R. Casalini et al., Phys. Rev. E 64, 41504 (2001); R. Casalini et al., Phys. Rev. E 63, 31207 (2001).
- (5) R. Casalini, M. Paluch, J.J. Fontanella, and C.M. Roland, J. Chem. Phys. 117 4901 (2002).
- (6) M. Paluch, C.M. Roland, J. Gapinski, and A. Patkowski, J. Chem. Phys. 118 3177 (2003).
- (7) M. Paluch, C.M. Roland, R. Casalini, G. Meier, and A. Patkowski, J. Chem. Phys. 118 4578 (2003).
- (8) M. Paluch, R. Casalini, A. Best, and A. Patkowski, J. Chem. Phys. 117 7624 (2002).
- (9) M. Paluch, C.M. Roland, and A. Best, J. Chem. Phys. 117 1188 (2002).
- (10) C. Dreyfus, M.J. Lebon, H.Z. Cummins, J. Toulouse , B. Bonello, and R.M. Pick, Phys. Rev. Lett. 69 3666 (1992).
- (11) G. Li, W.M. Du, A. Sakai, H.Z. Cummins, Phys. Rev. A 46 3343 (1992).
- (12) H.Z. Cummins, and W.M. Du, Phys. Rev. E 47 4223 (1993).
- (13) V. Krakoviack, C. Alba-Simionesco, M. Krauzman, J. Chem. Phys. 107 3417 (1997).
- (14) Y. Yang, and K.A. Nelson, Phys. Rev. Lett. 74 4883 (1995).
- (15) G. Hinze, D.D. Brace, S.D. Gottke, and M.D. Fayer, Phys. Rev. Lett. 84 2437 (2000).
- (16) J. Toulouse, G. Coddens, and R. Pattnaik, Physica A 201 305 (1993).
- (17) E. Eckstein, J. Qian, R. Hentschke, T. Thurn-Albrecht, W. Steffen, E.W. Fischer, J. Chem. Phys. 113 4751 (2000).
- (18) F. Stickel, E.W. Fischer, and R. Richert, J. Chem. Phys. 102 6251 (1995); C. Hansen, F. Stickel, R. Richert, and E.W. Fischer, J. Chem. Phys. 108 6408 (1998).
- (19) R. Casalini, M. Paluch, and C.M. Roland, J. Phys. Chem. A 107 2369 (2003).
- (20) G. Pratesi, A. Bellosi, and F. Barocchi, Eur. Phys. J. B 18 283 (2000).
- (21) K.U. Schug, H.E. King, and R. Bohmer, J. Chem. Phys. 109 1472 (1980).
- (22) L. Comez, D. Fioretto, H. Kriegs, and W. Steffen, Phys. Rev. E 66 32501 (2002).
- (23) M.H. Cohen and G.S. Grest, Phys. Rev. B 20 1077 (1979).
- (24) G. Adam, and J.H. Gibbs, J. Chem. Phys. 43 139 (1965).
- (25) M. Goldstein, J. Chem. Phys. 64, 4767 (1976).
- (26) G.P. Johari, J. Chem. Phys. 112 8958 (2000).
- (27) W.A. Phillips et al., Phys. Rev. Lett. 63, 2381 (1989).
- (28) S. Takahara, O. Yamamuro, and T. Matsuo, J. Phys. Chem. 99, 9589 (1995); O. Yamamuro, et al., J. Phys. Chem. B 102, 1605 (1998).
- (29) G.P. Johari, J. Chem. Phys. 112 7518 (2000); ibid. 112, 8958 (2000) and references therein.
- (30) R.J. Greet, and D. Turnbull, J. Chem. Phys. 47, 2185 (1967); J.H. Magill, J. Chem. Phys. 47, 2802 (1967); S. Takahara, O. Yamamuro, and H. Suga, J. Non-Cryst. Solids 171, 259 (1994).
- (31) R. Richert and C.A. Angell, J. Chem. Phys. 108 9016 (1998).
- (32) L.M. Martinez, and C.A. Angell, Nature (London) 410 663 (2001).
- (33) S. Corezzi, L. Comez, and D. Fioretto, preprint cond-mat/0211379.
- (34) E.W. Fischer, A. Bakai, A. Patkowski, W. Steffen, L. Reinhardt, J. Non-Cryst. Solids 307-310, 584 (2002).
- (35) Here we use the notation for thermal expansion, and for thermal expansion coefficient.
- (36) H. Schlosser, and J. Ferrante, J. Phys.: Condens. Matter 1 2727 (1989).
- (37) D.W. VanKrevelen, Properties of Polymers (Elsevier, Amsterdam, 1997).
- (38) A.K. Doolittle, J. Appl. Phys. 22 1471 (1951).
- (39) M.H. Cohen and G.S. Grest, Adv. Chem. Phys. 48 1455 (1981).
- (40) P. Zoller and D. J. Walsh, Standard Pressure-Volume-Temperature data for polymers (F.R.S.C. Du pont Company, 1995).
- (41) GNOMIX, Inc. (Boulder, CO 80304, USA).
- (42) P. Zoller, P. Bolli, V. Pahud, and H. Ackermann, Rev. Sci. Instrum. 47 948 (1976).
- (43) G. Fytas, A. Patkowski, G. Meier, and Th. Dorfmüller, Macromolecules 15, 214, (1982).
- (44) G. Fytas, A. Patkowski, G. Meier, and Th. Dorfmuller, J. Chem. Phys. 80, 2214 (1984).
- (45) For the present purposes, the atmospheric pressure (=0.1 MPa) can be considered as .
- (46) B.J. Berne and R. Pecora, Dynamic Light Scattering (Wiley, New York, 1976).
- (47) G. Williams and D.C. Watts, Trans. Faraday Soc. 66, 80 (1970).
- (48) T. Berger, Ph.D. thesis, Max Planck Institute for Polymer Research, Mainz, Germany, 1996.
- (49) D.L. Sidebottom, and C.M. Sorensen, Phys. Rev. B 40, 461 (1988).
- (50) Y. Yang, and K.A. Nelson, J. Chem. Phys. 103, 7732 (1995).
- (51) C.P. Lindsey and G.D. Patterson, J. Chem. Phys. 73, 3348 (1980).
- (52) N.B. Olsen, T. Christensen, and J.C. Dyre, Phys. Rev. Lett. 86, 1271 (2001).
- (53) T. Hikima, M. Hanaya, and M. Oguni, Sol. State Comm. 93 713 (1995).
- (54) M. Oguni, private communication.
- (55) R. Casalini, M. Paluch, and C.M. Roland, J. Chem. Phys. 118 5701 (2003).
- (56) H. Vogel, Phys. Z 222, 645 (1921); G.S. Fulcher, J. Am. Ceram. Soc. 8, 339 (1923).
- (57) F. Stickel, E.W. Fischer, and R. Richert, J. Chem. Phys. 104 2043 (1996).
- (58) H.Z. Cummins, G. Li, Y.H. Hwang, G.Q. Shen, W.M. Du J. Hernandez, and N.J. Tao, Z. Phys. B 103 501 (1997).
- (59) U. Schneider, P. Lunkneimer, R. Brand, and A. Loidl, Phys. Rev. E 59 6924 (1999).
- (60) M. Paluch, R. Casalini, and C.M. Roland, Phys. Rev. E 67 21508 (2003).
- (61) S.Corezzi, et al., Chem. Phys. Lett. 320 113 (2000).
- (62) M. Paluch, R. Casalini, and C.M. Roland, Phys. Rev. B 66 092202 (2002).