TRACING RECENT STAR FORMATION OF RED EARLY-TYPE GALAXIES OUT TO 1
Abstract
We study the mid-infrared (IR) excess emission of early-type galaxies (ETGs) on the red-sequence at 1 using a spectroscopic sample of galaxies in the fields of Great Observatories Origins Deep Survey (GOODS). In the mass-limited sample of 1025 galaxies with 1010.5 and , we identify 696 Spitzer 24 m detected (above the 5) galaxies and find them to have a wide range of NUV- and -[12 m] colors despite their red optical colors. Even in the sample of very massive ETGs on the red sequence with 1011.2 , more than 18% show excess emission over the photospheric emission in the mid-IR. The combination with the results of red ETGs in the local universe suggests that the recent star formation is not rare among quiescent, red ETGs at least out to if the mid-IR excess emission results from intermediate-age stars or/and from low-level ongoing star formation. Our colorcolor diagram including near-UV and mid-IR emissions are efficient not only for identifying ETGs with recent star formation, but also for distinguishing quiescent galaxies from dusty star-forming galaxies.
1 INTRODUCTION
Galaxies in the local universe show a bimodal distribution in the optical color-magnitude diagram. Quiescent, early-type galaxies (ETGs) populate a narrow red sequence and star-forming, late-type galaxies form a big blue cloud (Strateva et al. 2001; Blanton et al. 2003; Baldry et al. 2004; Balogh et al. 2004; Choi et al. 2007 and references therein). This bimodality extends out to at least 1 (Im et al. 2002; Bell et al. 2004; Willmer et al. 2006; Fritz et al. 2014). However, the formation and evolution of the red sequence is still not fully understood (Faber et al. 2007; Tinker et al. 2013). One of key populations to address this issue is a transition population that may be in a transition phase migrating into entirely quiescent ellipticals. In this paper we explore what fraction of red ETGs is in the transition phase and how this fraction evolves since 1; this provides important constraints on the evolution models for red sequence, especially for massive ETGs.
Current galaxy formation models suggest that massive galaxies form most their stars early (; Cowie et al. 1996; Dekel et al. 2009) and are morphologically transformed from spirals into spheroids via major mergers (Khochfar & Silk 2006; Hopkins et al. 2010). Thus, most massive quiescent galaxies are already in place at 1 (Ilbert et al. 2010, 2013; Moustakas et al. 2013), and ETGs are dominant populations for massive galaxies since 1 (Buitrago et al. 2013). Many observations also support that minor (dry) merging is the most likely process to form massive red ETGs at 1 because the gas-rich merger rate, important for ETG formation, declines very rapidly since 1 and their stellar mass growth is very limited since 1 (e.g., Cimatti et al. 2006; Ilbert et al. 2010; Moustakas et al. 2013). The minor merger scenario also seems to be one of the most efficient ways to explain a strong size evolution of massive red ETGs at least from 1 (Hopkins et al. 2006; Naab, Johansson & Ostriker 2009; Newman et al. 2012; Huertas-Company et al. 2013; Damjanov et al. 2014).
Faber et al. (2007) proposed a ‘mixed’ scenario to explain the formation of red ETGs in which star formation of blue galaxies is quenched (i.e., shutting off the gas supply) and subsequently they merge further through a series of dry mergers along the red sequence. Recent studies show that all the red-sequence galaxies are not completely quiescent: red ETGs with signs of recent star formation (e.g., Yi et al. 2005; Bressan et al. 2006; Schawinski et al. 2007; Clemens et al. 2009; Ko et al. 2009, 2012, 2013; Lee et al. 2010; Vega et al. 2010; Salim et al. 2012); late-type, dust-reddened galaxies with (or without) low-level ongoing star formation (e.g., Im et al. 2002; Wolf, Gray & Meisenheimer 2005; Bamford et al. 2009; Gallazzi et al. 2009; Wolf et al. 2009; Masters et al. 2010; Ko et al. 2012). These galaxies in the transition phase can be easily identified if the red-sequence galaxies are examined at different wavelengths. The near-ultraviolet (UV) observations reveal a diversity of ETGs depending on the amount of recent ( 1Gyr) star formation (e.g., Ferreras & Silk 2000; Kaviraj et al. 2007b). The mid-infrared (IR) observations also show that a significant fraction of ETGs has excess emission over the photospheric emission (e.g., Bressan et al. 2006; Clemens et al. 2009; Ko et al. 2009, 2012, 2013; Shim et al. 2011; Hwang et al. 2012a).
Ko et al. (2013) studied the recent star formation history of local ETGs on the red sequence in the Sloan Digital Sky Survey (SDSS; York et al. 2000). We found that among the 648 quiescent red galaxies, 55% show mid-IR excess emission over the stellar component. The mid-IR emission seems to mainly originate from the circumstellar dust around asymptotic giant branch (AGB) stars; we excluded the galaxies with active galactic nuclei (AGNs), H emission, and highly inclined disks. If we consider only bright ( 21.5) early-type galaxies, the fraction of red galaxies with recent star formation is still 39%. We concluded that the recent star formation is common among nearby quiescent, red, early-type galaxies. This is consistent with the results based on the Galaxy Evolution Explorer (; Martin et al. 2005) that residual star formation is common even for bright early-type galaxies (Yi et al. 2005; Schawinski et al. 2007; Kaviraj et al. 2007b; Salim & Rich 2010).
In this study, we use galaxies at 1 in the fields of Great Observatories Origins Deep Survey (GOODS; Dickinson et al. 2003; Giavalisco et al. 2004) to investigate the mid-IR excess emission of massive ETGs on the red sequence, which is a good indicator of current and/or recent star formation activity (12 Gyrs; Salim et al. 2009; Ko et al. 2013). Merger (minor) events are speculated to be common at high redshift among ETGs, and such events involving gaseous companion galaxies would produce signs of recent star formation that can be best caught in the mid-IR. By studying red ETGs at 1, we can test what fraction of them is in the transition phase. Section 2 describes the observational data we use. We examine the near-UV and mid-IR properties of red ETGs in Section 3, and conclude in Section 4. Throughout, we use the AB magnitude system, and adopt flat CDM cosmological parameters: km s-1 Mpc-1, and . We also assume a Salpeter initial mass function (Salpeter 1955) for stellar masses and star formation rates (SFR).
2 THE DATA AND THE SAMPLE
2.1 GOODS Sample
We use a sample of galaxies with spectroscopic redshifts in GOODS. This sample is originally constructed in Elbaz et al. (2011) and Hwang et al. (2011), and here we only give a brief summary of the data set (see also Cervantes-Sodi et al. 2012).
2.1.1 Multiwavelength Catalog of Galaxies with Spectroscopic Redshifts
GOODS is a deep multiwavelength survey covering two regions including the Hubble Deep Field North and the Chandra Deep Field South. Hereafter, we call the two GOODS fields centered on HDF-N and CDF-S GOODS-N and GOODS-S, respectively. The combined area of the two fields is approximately 320 arcmin2.
Elbaz et al. (2011) made a band-merged catalog of GOODS galaxies using the photometric data at HST ACS , Spitzer IRAC 3.6, 4.5, 5.8, 8 m, IRS peakup array 16 m (Teplitz et al. 2011), and MIPS 24 m (Magnelli et al. 2011).
Among the sources in the band-merged catalog, we use only 3630 and 3542 galaxies with reliable spectroscopic redshifts over the entire fields of GOODS-N (Cohen et al. 2000; Cowie et al. 2004; Wirth et al. 2004; Reddy et al. 2006; Barger et al. 2008; Cooper et al. 2011) and GOODS-S (Szokoly et al. 2004; Le Fèvre et al. 2004; Mignoli et al. 2005; Vanzella et al. 2006, 2007, 2008; Ravikumar et al. 2007; Popesso et al. 2009; Kurk et al. 2009; Balestra et al. 2010; Silverman et al. 2010; Xia et al. 2011; Cooper et al. 2012) respectively; a typical redshift error is .
2.1.2 Clean Index for 24 m Detected Galaxies
The 24 m flux densities and their associated errors are determined using a PSF fitting technique (Magnelli et al. 2011; Elbaz et al. 2011). Because of large PSF size at MIPS 24 m sources (FWHM), they use the position of the IRAC 3.6 m sources as priors for the source extraction at 24 m image. The advantage of this method is that it can deal with a large part of the blending issues in dense fields, and that it can provide a straightforward association of sources at different wavelengths. This method works well in general. However, there could be some galaxies in crowded regions whose flux densities are not properly deblended. To deal with these sources separately, we compute the level of contamination for each galaxy (), defined by
| (1) |
where and is the flux density of neighboring source and of target, respectively (see also Elbaz et al. 2010; Hwang et al. 2010a). is the projected distance between the target and neighbor source, and . We use at 3.6 m, and FWHM at 24 m. We use neighboring sources detected at 3.6 m image with . Note that the neighboring sources are from the photometric catalog regardless of their redshifts. For ease of computation, we require the neighboring sources to be bright enough to contaminate the flux density of target galaxy (i.e., ). Figure 1 shows this level of contamination of the galaxies with spectroscopic redshifts as a function of 24 m flux density. As expected, most galaxies are distributed around ; there are some galaxies with high (i.e., might be contaminated). We call the galaxies with “clean” (93%) and those with “blended”. In other words, flux densities of clean galaxies are contaminated less than 40%, comparable to the typical error (40%) of total IR luminosity derived from 24 m flux density (Elbaz et al. 2010).

2.1.3 Mass-limited Sample at 0.4 1.05
Figure 2 shows stellar masses of GOODS galaxies as a function of redshift. We adopt the stellar mass estimates from Elbaz et al. (2011). Stellar masses were computed using the photometric data from the band to IRAC 4.5 m using the code Z-PEG (Fioc & Rocca-Volmerange 1999). The templates used for the stellar mass estimates are from a galaxy evolution model PÉGASE.2 (Le Borgne & Rocca-Volmerange 2002). The typical error associated with the stellar mass estimate is 0.3 dex (see Elbaz et al. 2011 for details).
We define a mass-limited sample of galaxies with 1010.5 and 0.4 1.05 (enclosed by red solid lines in Figure 2) for further analysis. We use the mass limit of 1010.5 so that we can have a fair comparison with local ETGs (see Section 2.2). There are 1025 galaxies in this sample on the MIPS field, containing 654 and 371 galaxies for GOODS-N and GOODS-S, respectively.
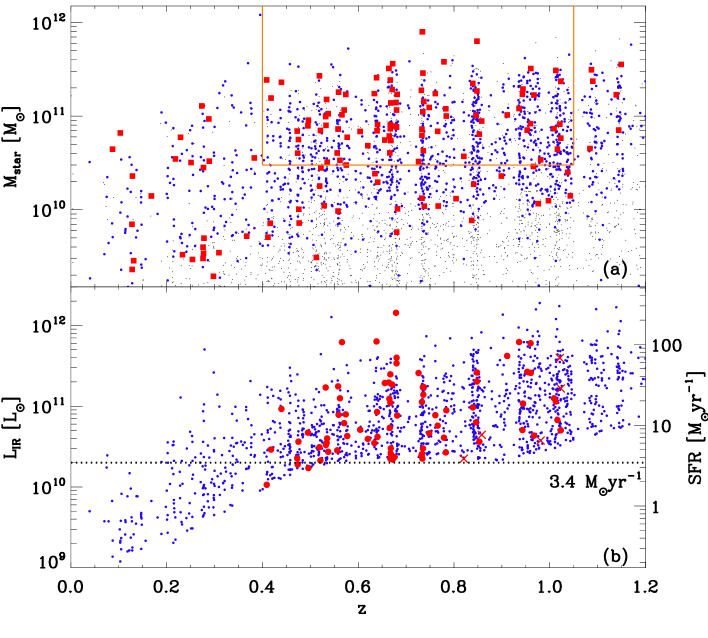
The lower panel of Figure 2 shows total IR luminosities, , as a function of redshift for 24 m detected galaxies. We compute the total IR luminosity () from the 24 m flux density using the SED templates of Chary & Elbaz (2001). Elbaz et al. (2010) found that IR luminosities from the 24 m flux densities agree well with those from PACS and SPIRE far-IR data, with a dispersion 0.15 dex. They also found that extrapolations from 24 m measurements work well up to . The 24 m detection limit (30 Jy, 5; Magnelli et al. 2009) in both GOODS fields is quite flat at 0.4 1.0, and corresponds to 1010 . This is comparable to a SFR of 3.4 using the Kennicutt (1998) relation.
We compute the rest-frame -band absolute magnitudes (), and the rest-frame (NUV), (), and [12 m] colors using the code (Arnouts et al. 1999; Ilbert et al. 2006). We use all the data available from ACS to 24 m for the SED fit. We use the SED templates generated with BC03 model (Bruzual & Charlot 2003) by assuming an exponentially declining star formation history SFR ( between 0.1 Gyr to 30 Gyr). The SEDs were generated for a grid of 44 ages (0.1 Gyr to 13.5 Gyr) and three different metallicities (Z=0.02, 0.008, and 0.004), and dust extinction was added using the formula of Calzetti et al. (2000) for between 0 to 0.5. For IR galaxy SEDs, we use Chary & Elbaz (2001) for 16 and 24 m flux densities. As a sanity check, we also compute [12 m] using the SED templates of Assef et al. (2010) for all the photometric data. The [12 m] colors from these two methods agree with a dispersion 0.2 mag, much smaller than the spread of [12 m] colors of ETGs on the red sequence (see Fig. 6).
2.1.4 Early-type Galaxies on the Red Sequence
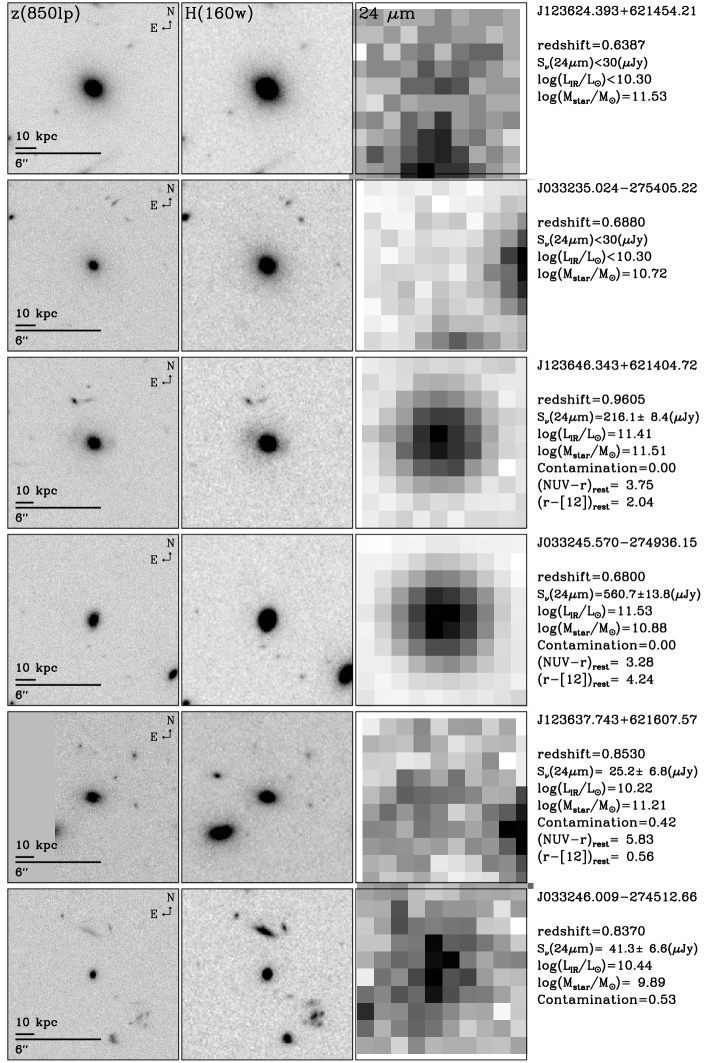
Because we are interested in the mid-IR activity of early-type galaxies, we need to identify morphologically early-type galaxies in the mass-limited sample of galaxies in Figure 2. To do that, we adopt galaxy morphology data from Hwang & Park (2009) and Hwang et al. (2011) that is based on the visual inspection of ACS images. We classify the galaxies into two groups: early types (E/S0) and late types (S/Irr). Early-type galaxies are those with little fluctuation in the surface brightness and color and with good symmetry, but late-type galaxies show internal structures and/or color variations in the pseudocolor images. This classification agrees very well () with those of Bundy et al. (2005) who also performed a visual morphological classification for GOODS galaxies. We perform additional visual classification for the galaxies in the mass-limited sample of galaxies that are not included in Hwang & Park (2009) and Hwang et al. (2011). We also verify the morphological classification of the galaxies covered by the Cosmic Assembly Near-Infrared Dark Energy Legacy Survey with the NIR HST Wide Field Camera 3 images (Grogin et al. 2011; Koekemoer et al. 2011). Figure 3 shows examples of HST and Spitzer 24 m cutout images for early-type galaxies in GOODS-N and -S. From top to bottom, they are those without 24 m detection in GOODS-N and -S, those with 24 m detection in GOODS-N and -S, and those with 24 m detection but blended in GOODS-N and -S.
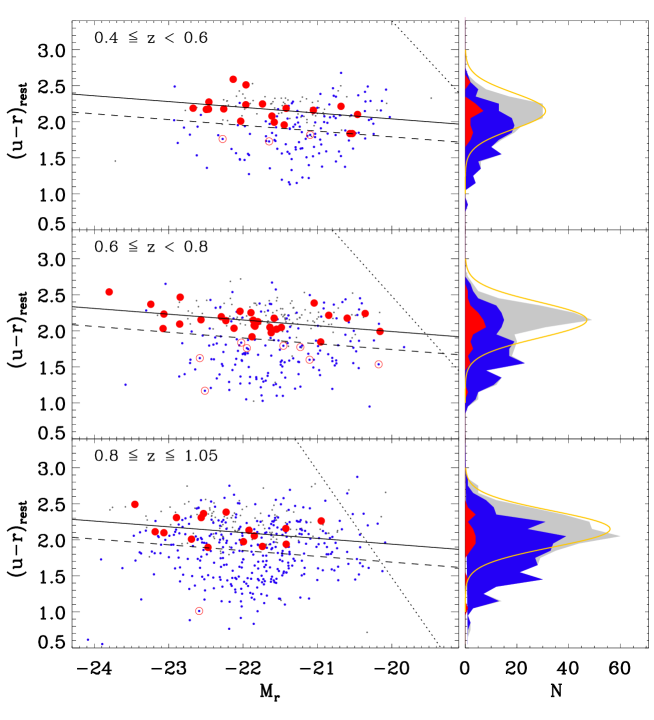
We use rest-frame color versus -band absolute magnitude () to identify red-sequence galaxies at . In Figure 4, we show the distribution of rest-frame color against in three redshift bins. Solid lines indicate a fit to the color-magnitude relation (CMR) for red-sequence galaxies with 0.08 that is derived from local SDSS galaxies (Ko et al. 2013; see Figure 4 therein). This slope is similar to SDSS luminous red galaxies (Baldry et al. 2004). This slope is also compatible with the slope of 0.07 (the standard deviation of residuals to the fit of 0.2 mag) derived from GOODS ETGs with 21 and 0.4 1.05. The red-sequence galaxies become redder by 0.1 mag from the highest redshift bin to the lowest redshift bin. Dashed lines indicate the color cut adopted in this study to separate red and blue galaxies. The CMR is moved to blueward of the linear fit by 0.25 mag to define the color cut. The amount of offset (i.e. 0.25 mag) is a standard deviation from a fit to the histogram of colors for massive ( 10) galaxies regardless of 24 m detection at 0.4 1.05.
In the result, in the mass-limited sample of 1025 galaxies (defined in Fig. 2; 32% are ETGs) 68% (696) is detected at 24 m (blue small circles in Fig. 4). Among the 696 24 m detected galaxies, 82 galaxies are ETGs (12%, red filled circles in Fig. 4) that we use for the following analysis. Among the 82 ETGs, 85% (70) are on the red sequence. Note that there are only five galaxies out of 82 ETGs flagged as “blended” (crosses in Fig. 2); their 24 m flux densities could be overestimated.
To remove the contribution of dust heated by AGN, we identify AGN-host galaxies using IRAC data (e.g., Lacy et al. 2004; Stern et al. 2005; Assef et al. 2010; Jarrett et al. 2011; Lee et al. 2012). There are only four galaxies that satisfy the AGN selection criteria of Stern et al. (2005), thus AGN contamination is negligible in the following analysis.
2.2 SDSS Sample
To compare the results of GOODS galaxies at high redshift with those in the local universe, we use the spectroscopic sample of galaxies in the SDSS Data Release 7 (DR7, Abazajian et al. 2009). We also use a photometric sample of SDSS galaxies whose redshift information is not available in the SDSS database, but available in the literature (Hwang et al. 2010b). The stellar mass estimates are from MPA/JHU DR7 value-added galaxy catalog (VAGC111http://www.mpa-garching.mpg.de/SDSS/DR7/); these are computed using SDSS five-band photometric data with the model of Bruzual & Charlot (2003) (Kauffmann et al. 2003; Gallazzi et al. 2005). We adopt galaxy morphology data from the Korea Institute for Advanced Study (KIAS) DR7 VAGC222http://astro.kias.re.kr/vagc/dr7/ (Choi et al. 2010); these are divided into two morphological types, the same criteria as for GOODS galaxies.
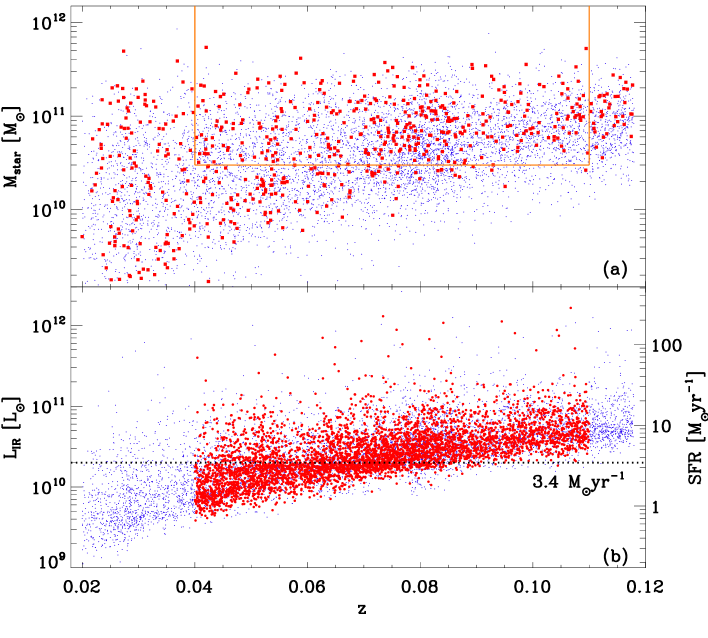
We identify the mid-IR counterparts of the SDSS galaxies in the Wide-field Infrared Survey Explorer () source catalog (see Ko et al. 2013 for details). Figure 5 shows stellar masses (a) and total IR luminosities (b) of these SDSS galaxies with 22 m detection as a function of redshift. We define a mass-limited sample at 0.04 0.11 and 1010.5 , the same mass limit as for GOODS galaxies. By adopting a method similar to the one applied to GOODS galaxies, we compute the IR luminosities for the SDSS galaxies from the 22 m flux densities. The SFRs converted from these 22 m-derived IR luminosities are consistent with those based on optical emission lines (Hwang et al. 2012a,b; Lee et al. 2013). The dashed line in Figure 5(b) represents 2 1010 , corresponding to 3.4 .
3 RESULTS AND DISCUSSION
3.1 Near-UV and Mid-IR Excess emissions of Red Early-type Galaxies
Here we examine near-UV and mid-IR emissions of red ETGs in GOODS. We first show how local galaxies and SED templates populate in near-UV/optical/mid-IR color domain (Section 3.1.1), and then discuss how high-z GOODS galaxies are distributed in this domain (Section 3.1.2).
3.1.1 At Low Redshifts: SDSS Galaxies
The optical CMR is commonly used to separate red ETGs from blue late-type galaxies out to 1 (e.g., Kodama et al. 1999; Bell et al. 2004; Faber et al. 2007). However, many studies revealed that nearby, red ETGs show a large scatter in the near-UVoptical color-magnitude diagrams with signs of recent ( Gyr) star formation. Furthermore, Ko et al. (2013) showed that a half of nearby, bright, red ETGs with 12 m detection show mid-IR excess emission over the stellar component. The mid-IR emission can have much larger contribution from intermediate-age stars than from young stars (Salim et al. 2009; Kelson & Holden 2010; Donoso et al. 2012), and can give us an unobscured view of the star formation activity. We found that most quiescent (without optical emission lines) red ETGs with near-UV excess show mid-IR excess emission, while less than 50% of red ETGs with mid-IR excess show near-UV excess emission (Ko et al. 2013). These support the idea that the mid-IR emission is sensitive to star formation with longer timescales ( 1 Gyr) than near-UV emission.
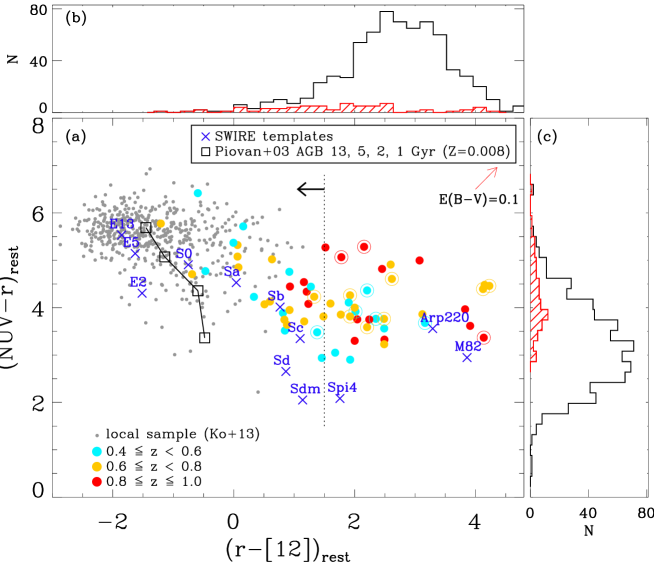
In Figure 6(a), gray dots indicate 12 m detected local (0.04 0.11) red ETGs with 1010.5 (Ko et al. 2013). In this local sample, we exclude galaxies with H emission, AGN features, and highly inclined disks. For reference, we show the extinction-free rest-frame colors of the SWIRE templates of Polletta et al. (2007) including three ellipticals (2, 5, 13 Gyr), seven spirals (S0, Sa, Sb, Sc, Sd, Sdm, Spi4), and two starbursts (M82, Arp220). These templates are generated with the GRASIL code (Silva et al. 1998) in which the effects of dusty envelopes around AGB stars are taken into account by adopting the procedure of Bressan et al. (1998). We also overplot the predictions from Single Stellar Population (SSP) models that include the emission from circumstellar dust around AGB stars (solid line; Piovan et al. 2003), along mean stellar ages (1, 2, 5, and 13 Gyr) for 40% solar metallicity. Although two models predict [12 m] colors differently, Ko et al. (2013) showed that redder [12 m] colors (mid-IR excess) and bluer NUV colors (near-UV excess) of local red ETGs seem to be consistent with the two-component SSP model predictions.
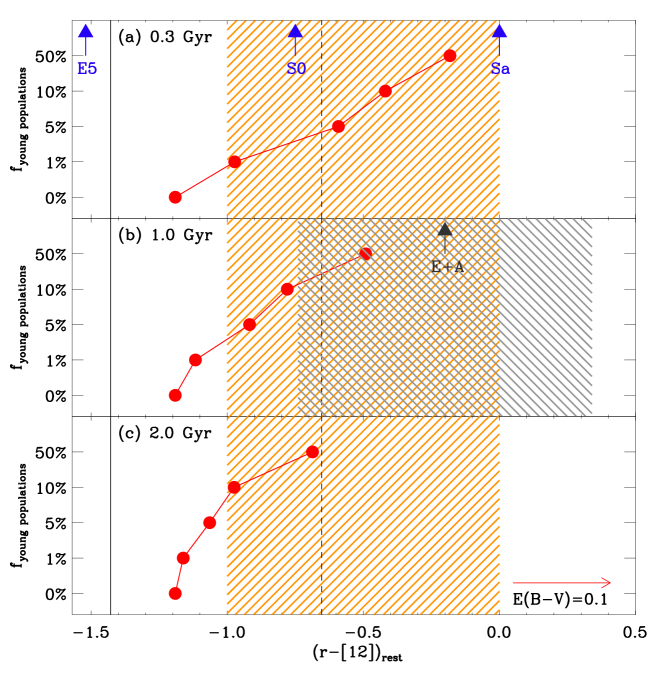
To roughly estimate a contribution of young populations to these mid-IR detected red ETGs, we plot a stellar mass fraction of young populations as a function of [12 m] colors in Figure 7. We use two-component SSP models; we assume that an old underlying population (10 Gyr; an instantaneous burst of star formation at 3) with a solar metallicity and young populations (0.3, 1.0 and 2 Gyr) with fractions of 1, 5, 10 and 50%. For comparison, we also mark [12 m] colors of the SWIRE templates of E5, S0 and Sa with arrows. Vertical solid and dashed lines in all panels represent the medain value and its standard deviation of local red ETGs with 1010.5 (gray dots in Figure 6), respectively. The [12 m] color of E5 template corresponds to the median value of local red ETGs and the color of Sa template roughly coincides with an sSFR cut (log sSFR = 10.7) to separate quiescent galaxies from star-forming ones (see Section 3.2.1 for details). Orange hatched regions in all panels indicate quiescent red ETGs with mid-IR excess defined in Section 3.2.1. This shows that only 1% of 0.3 Gyr, 5% of 1 Gyr, and 10% of 2 Gyr young populations can change [12 m] colors to move the galaxies into the mid-IR excess region, indicating that mid-IR is likely to trace star formation over longer (up to 2 Gyr) timescales. It should be noted that more than 10% of 0.3 Gyr make color bluer than our red sequence selection criterion, thus only 5% with dust extinction can explain the [12 m] color distribution of our local red ETGs. For comparison, the median value of [12 m] colors for local E+A galaxies (sign of recent starburst within 1 Gyr) from Choi et al. (2009) is shown in the middle panel of Figure 7. Among the E+A sample, we use only morphologically early-type galaxies with 1010.5. At least 10% and more than 50% of 1 Gyr populations with dust extinction can produce the color distribution of post-starburst systems, consistent with previous results (e.g., Kaviraj et al. 2007a).
3.1.2 At High Redshifts: GOODS Galaxies
In Figure 6(a), we also plot 24 m detected, GOODS red ETGs at 0.4 1.05 and 1010.5 (large circles). The upper limit of [12 m] colors from the 24 m detection limit () is indicated with vertical dotted line and arrow (i.e. [12 m] 1.5) 333This color cut is insensitive to redshift because the [12 m] color is a good proxy of sSFR, and the detection limit of (i.e., SFR) computed with the 24 m flux density is quite flat for the mass-limited sample at 0.4 1.05 in this study.. We also mark the galaxies detected ( ) at 100 m band with large open circles.
GOODS red ETGs are expected to be around 3 Gyr SSP model if we assume that they are single-burst stellar populations formed at 3 so that their age is 3 Gyr at 1. The 24 m undetected galaxies have [12 m] 1.5, suggesting that they have an old (3 Gyr) underlying population with young and intermediate-age ( 2 Gyr) populations. Most of these 24 m undetected galaxies are ETGs (76%, 250 out of 329), and are on the red sequence (see right panels of Fig. 4). However, we note that red ETGs with [12 m] 0 seem to be dust-reddened or/and have low-level ongoing star formation because two-component SSPs can not make their red colors (see Fig. 7).
On the other hand, more than half of 24 m detected GOODS red ETGs have [12 m] 1. Their colors are consistent with Spiral galaxy templates with dust extinction. Considering that Sc is more actively forming stars than Sa, their optical red colors suggest that Sa galaxies are weakly forming stars, not enough to change their integrated optical colors (similar to red spirals in Galaxy Zoo of Masters et al. 2010 and to optically passive spirals in Wolf et al. 2009). However, Sc galaxies are normal star-forming galaxies, but suffer from heavy dust extinction. Because our morphology classification is not sensitive to separate Sa from E/S0, there could be some Sa galaxies classified as ETGs in this study. Interestingly, about 41% (14/34) of galaxies with [12 m] 1.5 are detected at PACS 100 m, suggesting that some of 24 m detected, red ETGs are currently forming stars despite their early-type morphology (see Fukugita et al. 2004; Lee et al. 2006, 2010; Skibba et al. 2011; Hwang et al. 2012a; Ko et al. 2012; Martini et al. 2013).
In summary, while most GOODS ETGs remain red in the colors, they show a wide range of NUV colors (i.e., near-UV excess), indicating that a large fraction of red ETGs at 1.0 have experienced star formation within 1 Gyr or/and are undergoing low-level star formation. This is because the near-UV emission from young massive stars is more sensitive to recent star formation than the blue-band optical emission even though the contribution of young massive stars to the total stellar mass is only 1%3% (Kaviraj et al. 2007b). Similarly, a wide range of [12 m] colors seems to show a variety of mid-IR emission for GOODS red ETGs. Here the mid-IR excess emission of galaxies may attribute to intermediate-age stars (i.e., sensitive to star formation over relatively longer timescales of 2 Gyrs) or/and to low-level ongoing star foramtion. In addition, red ETGs with reddest [12 m] colors show strong mid-IR excess due to dust, thus their sSFRs are similar to normal star-forming galaxies. Therefore, near-UVoptical versus opticalmid-IR color-color diagram is very efficient for detecting ETGs with recent (within 2 Gyrs) star formation and breaking the degeneracies between dusty star-forming and quiescent galaxies.
3.2 Specific SFRs of Red Early-type Galaxies
In the local universe, low-level recent star formation of ETGs has been detected through near-UV excess emission (e.g., Yi et al. 2005; Salim & Rich 2010) and mid-IR excess emission (e.g., Bressan et al. 2006; Ko et al. 2013). With an observational result that there is no significant evolution in the optical CMR out to, at least, (e.g., Im et al. 2002; Bell et al. 2004; Willmer et al. 2006; see also Fig. 4), the evolution of red ETGs with recent star formation can provide important constraints on the formation models of present-day massive red ETGs. In this section, we first study the change in specific SFR (sSFR = SFR) of red ETGs with redshift (Section 3.2.1), and then compute the fraction of red ETGs with mid-IR excess emission in Section 3.2.2.
3.2.1 Stellar Mass Dependence
In the following, we assume that the mid-IR excess emission of red ETGs is dominated by intermediate-age stars or/and low-level current star formation. We adopt the specific SFR to trace this excess emission by taking into account an increase in the average SFRs of star-forming galaxies with redshift in Elbaz et al. (2011). Thus, the sSFR cut of ETGs with mid-IR excess emission also changes with redshift; we use the sSFR cut used for local ETGs with mid-IR excess emission as a reference.
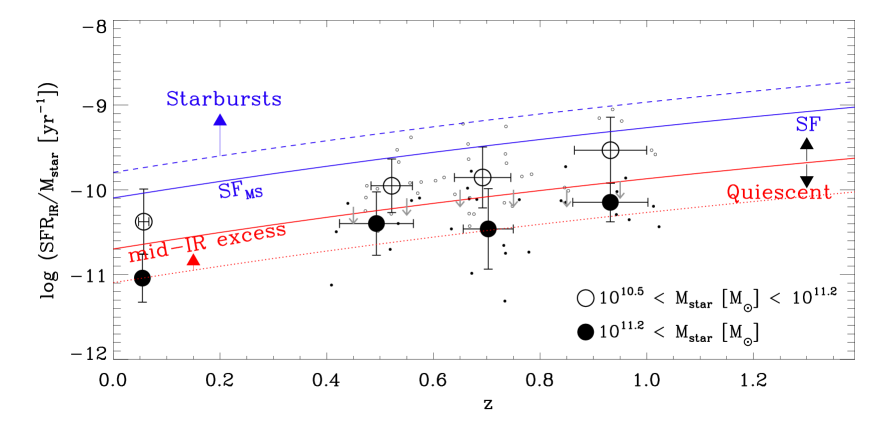
In Figure 8, we plot sSFRs of 24 m detected GOODS red ETGs and of 22 m detected SDSS red ETGs with 1010.5 as a function of redshift. We further divide the galaxy sample into two groups based on their stellar masses; large circles show median values of each bin. More massive red ETGs (filled circles) certainly have lower sSFRs values at 444The limit for sSFR is lower for more massive galaxies than less massive ones, but there are few or no red ETGs with 1011.2 above the sSFR limit (small gray downward arrows in Fig. 8) for the mass-limited sample ( 1010.5 ).. Rodighiero et al. (2010) and Karim et al. (2011) also found that more massive galaxies have lower sSFRs in this redshift range, using PACS far-IR data and stacked 1.4 GHz radio continuum emission data, respectively.
The blue solid line in Figure 8 is the mean evolutionary trend of IR-selected star-forming galaxies (i.e. main sequence galaxies, see eq. 13 and Fig. 18 in Elbaz et al. 2011). The blue dashed line is for separating starburst galaxies from main sequence galaxies (see eq. 14 in Elbaz et al. 2011). It is interesting to see that the median sSFRs for both mid-IR detected GOODS and SDSS ETGs with 109.5 are consistent with main sequence galaxies. The red solid line is a factor of 4 below the main sequence (blue solid line), indicating an sSFR cut (log sSFR = 10.7 at 0) to separate quiescent galaxies from star-forming ones (Gallazzi et al. 2009; Ilbert et al. 2010; Ko et al. 2012). Small, gray downward arrows indicate the detection limit of 24 m flux density for our mass-limited ( 1010.5 ) sample. All of them are below or around the sSFR cut for quiescent galaxies, indicating that 24 m undetected galaxies at 0.4 1.0 are quiescent systems. Galaxies with mid-IR excess are defined as those with an sSFR 0.1 sSFRMS, corresponding to the sSFR cut to select quiescent red-sequence galaxies with mid-IR excess at 0.09 (red dotted line; see Figure 15 of Ko et al. 2012).
Figure 8 shows that less massive ETGs are more likely to have mid-IR excess emission than more massive ETGs at 1, consistent with previous results for local ETGs (Ko et al. 2009, 2012, 2013); most of more massive red ETGs with 1011.2 are in the quiescent mode, but less massive red ETGs with 1011.2 show a wide spread in sSFR. If we take into account 24 m undetected galaxies as well, the plot suggests that a significant fraction of them have mid-IR excess emission. Because of 24 m flux density upper limit, it is not straightforward to compute exactly what fraction of red ETGs can be classified as ‘mid-IR excess’ in the sample of less massive ETGs. With the result for local red ETGs, these results suggest that ‘mid-IR excess’ emission, a good indicator of recent star formation, is not rare for red ETGs at 1 (especially for less massive galaxies). This conclusion is consistent with the result in Ilbert et al. (2010) who found that massive red ETGs are already in place at 1 while the intermediate-mass red ETGs are still forming at 1, leaving a trace of recent star formation.
3.2.2 Fractions of Red Early-type Galaxies with Mid-IR Excess Emission
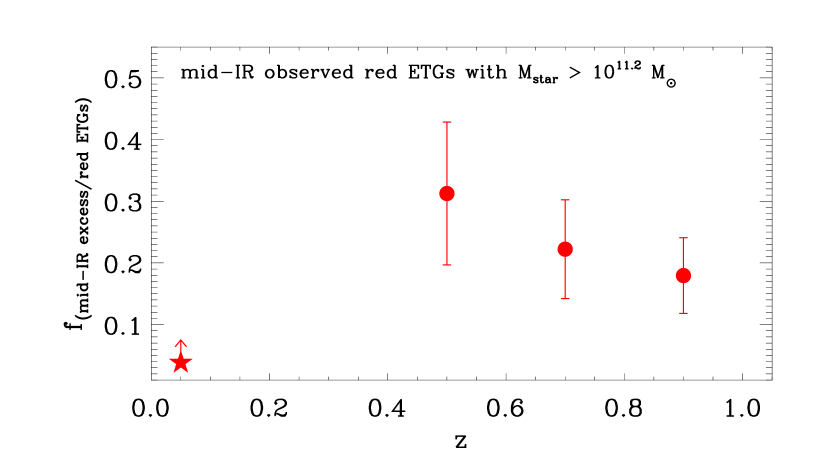
In Figure 9, we plot the fraction of GOODS red ETGs with mid-IR excess emission (defined in Fig. 8) in the sample of more massive galaxies with . We use this mass cut so that all the 24 m undetected galaxies have smaller sSFRs than the sSFR cut for mid-IR excess. In other words, 24 m undetected galaxies are quiescent systems without mid-IR excess emission. For comparison, we also show the fraction of SDSS red ETGs with mid-IR excess emission in the sample of massive galaxies using the same mass limit as for GOODS galaxies. We only use the galaxies at where the 22 m detection limit roughly corresponds to SFR 1 (see Fig. 5). This limit then ensures that most 22 m undetected galaxies in these mass and redshift ranges are quiescent systems without mid-IR excess emission (i.e., log sSFR , see Fig. 8), similar to GOODS galaxies. Despite the small redshift range, there are still some 22 m undetected galaxies with SFR 1 (e.g., see Fig. 5 for 0.05 galaxies). Therefore, the fraction for SDSS galaxies indicates a lower limit.
Figure 8 shows that the majority of massive red ETGs are in a ‘relatively’ quiescent mode at even though some of them are detected in the mid-IR. This is consistent with previous results that most massive quiescent galaxies (mainly red ETGs) are created slowly at (e.g., Borch et al. 2006; Bundy et al. 2006; Arnouts et al. 2007; Ilbert et al. 2010, 2013; Cassata et al. 2011; Kajisawa et al. 2011; Moustakas et al. 2013). For example, Ilbert et al. (2010) showed that more than 50% of galaxies with are quiescent at . However, Figure 9 shows that 18-30% of massive red ETGs can be classified as ‘mid-IR excess’ galaxies even though many of massive red ETGs are in a ‘relatively’ quiescent mode. This suggests that recent star formation is not negligible even in massive red ETGs at ; note that we conservatively consider that all massive red ETGs without mid-IR detection at have no excess emission.
4 CONCLUSIONS
We study the mid-IR excess emission of early-type galaxies on the red sequence at 1 using the spectroscopic sample of galaxies in the fields of GOODS. We find that most GOODS ETGs remain red in the colors, but a significant fraction of them show a wide range of NUV and [12 m] colors; this suggests that the fraction of young and intermediate-age stars in these massive red ETGs with 1010.5 is not negligible. The combination of near-UV and mid-IR provides not only an efficient tool to detect ETGs with recent star formation, but also to break the degeneracy between quiescent and dusty star-forming galaxies.
We also find that less massive ETGs are more likely to experience recent star formation or/and low-level ongoing star formation, consistent with the result of local red ETGs. This result is also consistent with the previous result that more massive galaxies have lower sSFRs at 1 (Rodighiero et al. 2010; Karim et al. 2011). In other words, more massive galaxies (mainly quiescent, red ETGs) are already in place at 1, but less massive galaxies continuously increase their stellar masses through several physical processes such as minor mergers (Kaviraj et al. 2009; Ilbert et al. 2010; Moustakas et al. 2013; Damjanov et al. 2014).
We explore the fraction of mid-IR excess galaxies among massive () red ETGs at 1. We find that the majority of massive red ETGs are ‘quiescent’ systems. However, more than 18% of GOODS galaxies at 0.4 1.0 still show mid-IR excess emission even though we consider all the 24 m undetected galaxies to be quiescent systems without mid-IR excess emission. These findings suggest that the recent star formation is not rare even among quiescent, red ETGs at 1, if the mid-IR excess emission results mainly from intermediate-age stars or/and low-level current star formation.
References
- (1) Abazajian, K. N., Adelman-McCarthy, J. K., Agüeros, M. A., et al. 2009, ApJS, 182, 543
- (2) Arnouts, S., Cristiani, S., Moscardini, L., et al. 1999, MNRAS, 310, 540
- (3) Arnouts, S., Walcher, C. J., Le Fèvre, O., et al. 2007, A&A, 476, 137
- (4) Assef, R. J., Kochanek, C. S., Brodwin, M., et al. 2010, ApJ, 713, 970
- (5) Baldry, I. K., Glazebrook, K., Brinkmann, J., et al. 2004, ApJ, 600, 681
- Balestra et al. (2010) Balestra, I., Mainieri, V., Popesso, P., et al. 2010, A&A, 512, A12
- (7) Balogh, M., Eke, V., Miller, C., et al. 2004, MNRAS, 348, 1355
- (8) Bamford, S. P., Nichol, R. C.; Baldry, I. K., et al. 2009, MNRAS, 393, 1324
- Barger et al. (2008) Barger, A. J., Cowie, L. L., & Wang, W.-H. 2008, ApJ, 689, 687
- (10) Bell, E. F., Wolf, C., Meisenheimer, K., et al. 2004, ApJ, 608, 752
- (11) Blanton, M. R., Hogg, D. W., Bahcall, N. A., et al. 2003, ApJ, 594, 186
- (12) Borch, A., Meisenheimer, K., Bell, E. F., et al. 2006, A&A, 453, 869
- (13) Bressan, A., Granato, G. L., & Silva, L. 1998, A&A, 332, 135
- (14) Bressan, A., Panuzzo, P., Buson, L., et al. 2006, ApJ, 639, L55
- (15) Bruzual, G., & Charlot, S. 2003, MNRAS, 344, 1000
- (16) Buitrago, F., Trujillo, I., Conselice C. J., et al. 2013, MNRAS, 428, 1460
- Bundy et al. (2005) Bundy, K., Ellis, R. S., & Conselice, C. J. 2005, ApJ, 625, 621
- (18) Bundy, K., Ellis, R. S., Conselice, C. J., et al. 2006, ApJ, 651, 120
- (19) Calzetti, D., Armus, L., Bohlin, R. C., et al. 2000, ApJ, 533, 682
- (20) Cassata, P., Giavalisco, M., Guo, Y., et al. 2011, ApJ, 743, 96
- Cervantes-Sodi et al. (2012) Cervantes-Sodi, B., Hernandez, X., Hwang, H. S., Park, C., & Le Borgne, D. 2012, MNRAS, 426, 1606
- Choi et al. (2009) Choi, Y., Goto, T., & Yoon, S.-J. 2009, MNRAS, 395, 637
- (23) Choi, Y.-Y., Park, C., & Vogeley, M. S. 2007, ApJ, 658, 884
- (24) Choi, Y.-Y., Han, D., & Kim, S. S. 2010, J. Korean Astron. Soc., 43, 191
- (25) Chary, R., & Elbaz, D. 2001, ApJ, 556, 562
- (26) Cimatti, A., Daddi, E., & Renzini, A. 2006, A&A, 453, L29
- (27) Clemens, M. S., Bressan, A., Panuzzo, P., et al. 2009, MNRAS, 392, 982
- Cohen et al. (2000) Cohen, J. G., Hogg, D. W., Blandford, R., et al. 2000, ApJ, 538, 29
- Cooper et al. (2011) Cooper, M. C., Aird, J. A., Coil, A. L., et al. 2011, ApJS, 193, 14
- Cooper et al. (2012) Cooper, M. C., Yan, R., Dickinson, M., et al. 2012, MNRAS, 425, 2116
- (31) Cowie, L. L., Songaila, A., Hu, E. M., & Cohen, J. G. 1996, AJ, 112, 839
- Cowie et al. (2004) Cowie, L. L., Barger, A. J., Hu, E. M., Capak, P., & Songaila, A. 2004, AJ, 127, 3137
- Damjanov et al. (2014) Damjanov, I., Hwang, H. S., Geller, M. J., & Chilingarian, I. 2014, arXiv:1405.2934
- (34) Dekel, A., Birnboim, Y., Engel, G., et al. 2009, Nature, 457, 451
- (35) Dickinson, M., Giavalisco, M., & GOODS Team 2003, The Mass of Galaxies at Low and High Redshift, 324
- (36) Donoso, E., Yan, L., Tsai, C., et al. 2012, ApJ, 748, 80
- (37) Elbaz, D., Hwang, H. S., Magnelli, B., et al. 2010, A&A, 518, L29
- Elbaz et al. (2011) Elbaz, D., Dickinson, M., Hwang, H. S., et al. 2011, A&A, 533, 119
- (39) Faber, S. M., Willmer, C. N. A., Wolf, C., et al. 2007, ApJ, 665, 265
- (40) Ferreras I., & Silk J. 2000, ApJ, 541, L37
- Fioc & Rocca-Volmerange (1999) Fioc, M. & Rocca-Volmerange, B. 1999, arXiv:astro-ph/9912179
- (42) Fritz, A., Scodeggio, M., Ilbert, O., et al. 2014, A&A, 563, A92
- (43) Fukugita, M., Nakamura, O., Turner, E. L., Helmboldt, J., & Nichol, R. C. 2004, ApJ, 601, L127
- (44) Gallazzi, A., Charlot, S., Brinchmann, J., White, S. D. M., & Tremonti, C. A. 2005, MNRAS, 362, 41
- (45) Gallazzi, A., Bell, E. F., Wolf, C., et al. 2009, ApJ, 690, 1883
- (46) Giavalisco, M., Ferguson, H. C., Koekemoer, A. M., et al. 2004, ApJ, 600, L93
- Grogin et al. (2011) Grogin, N. A., Kocevski, D. D., Faber, S. M., et al. 2011, ApJS, 197, 35
- (48) Hopkins, P. F., Hernquist, L., Cox, T. J., et al. 2006, ApJS, 163, 1
- (49) Hopkins, P. F., Bundy, K., Croton, D., et al. 2010, ApJ, 715, 202
- (50) Huertas-Company, M., Mei, S., Shankar, F., et al. 2013, MNRAS, 428, 1715
- Hwang & Park (2009) Hwang, H. S. & Park, C. 2009, ApJ, 700, 791
- (52) Hwang, H. S., Elbaz, D., Magdis, G., et al. 2010a, MNRAS, 409, 75
- (53) Hwang, H. S., Elbaz, D., Lee, J. C., et al. 2010b, A&A, 522, A33
- Hwang et al. (2011) Hwang, H. S., Elbaz, D., Dickinson, M., et al. 2011, A&A, 535, A60
- (55) Hwang, H. S., Geller, M. J., Diaferio, A., & Rines, K. J. 2012a, ApJ, 752, 64
- Hwang et al. (2012) Hwang, H. S., Geller, M. J., Kurtz, M. J., Dell’Antonio, I. P., & Fabricant, D. G. 2012b, ApJ, 758, 25
- (57) Ilbert, O., Arnouts, S., McCracken, H. J., et al. 2006, A&A, 457, 841
- (58) Ilbert, O., Salvato, M., Le Floc’h, E., et al. 2010, ApJ, 709, 644
- (59) Ilbert, O., McCracken, H. J., Le Fèvre, O., et al. 2013, A&A, 556, A55
- (60) Im, M., Simard, L., Faber, S. M., et al. 2002, ApJ, 571, 136
- (61) Jarrett, T. H., Cohen, M., Masci, F., et al. 2011, ApJ, 735, 112
- (62) Kajisawa, M., Ichikawa, T., Yoshikawa, T., et al. 2011, PASJ, 63, 403
- (63) Karim, A., Schinnerer, E., Martínez-Sansigre, A., et al. 2011, ApJ, 730, 61
- (64) Kauffmann, G., Heckman, T. M., White, S. D. M., et al. 2003, MNRAS, 341, 54
- Kaviraj et al. (2007) Kaviraj, S., Kirkby, L. A., Silk, J., & Sarzi, M. 2007a, MNRAS, 382, 960
- (66) Kaviraj, S., Schawinski, K., Devriendt, J. E. G., et al. 2007b, ApJS, 173, 619
- (67) Kaviraj, S., Peirani, S., Khochfar, S., Silk, J., & Kay, S. 2009, MNRAS, 394, 1713
- (68) Kelson, D. D., & Holden, B. P. 2010, ApJ, 713, L28
- (69) Kennicutt, Jr., R. C. 1998, ARA&A, 36, 189
- (70) Khochfar, S., & Silk, J. 2006, ApJ, 648, L21
- (71) Ko, J., Im, M., Lee, H. M., et al. 2009, ApJ, 695, L198
- (72) Ko, J., Im, M., Lee, H. M., et al. 2012, ApJ, 745, 181
- (73) Ko, J., Hwang, H. S., Lee, J. C., & Sohn, Y.-J. 2013, ApJ, 767, 90
- Koekemoer et al. (2011) Koekemoer, A. M., Faber, S. M., Ferguson, H. C., et al. 2011, ApJS, 197, 36
- (75) Kodama, T., Bower, R. G., & Bell, E. F. 1999, MNRAS, 306, 561
- Kurk et al. (2009) Kurk, J., Cimatti, A., Zamorani, G., et al. 2009, A&A, 504, 331
- (77) Lacy, M., Storrie-Lombardi, L. J., Sajina, A., et al. 2004, ApJS, 154, 166
- Le Borgne & Rocca-Volmerange (2002) Le Borgne, D. & Rocca-Volmerange, B. 2002, A&A, 386, 446
- Le Fèvre et al. (2004) Le Fèvre, O., Vettolani, G., Paltani, S., et al. 2004, A&A, 428, 1043
- (80) Lee, J. H., Lee, M. G., & Hwang, H. S. 2006, ApJ, 650, 148
- (81) Lee, J. H., Hwang, H. S., Lee, M. G., Lee, J. C., & Matsuhara, H. 2010, ApJ, 719, 1946
- (82) Lee, J. C., Hwang, H. S., Lee, M. G., et al. 2012, ApJ, 756, 95
- (83) Lee, J. C., Hwang, H. S., & Ko, J. 2013, ApJ, 774, 62
- (84) Magnelli, B., Elbaz, D., Chary, R. R., et al. 2009, A&A, 496, 57
- Magnelli et al. (2011) Magnelli, B., Elbaz, D., Chary, R. R., et al. 2011, A&A, 528, A35
- (86) Martin, D. C., Fanson, J., Schiminovich, D., et al. 2005, ApJ, 619, L1
- (87) Martini, P., Dicken, D., & Storchi-Bergmann, T. 2013, ApJ, 766, 121
- (88) Masters, K. L., Mosleh, M., Romer, A. K., et al. 2010, MNRAS, 405, 783
- Mignoli et al. (2005) Mignoli, M., Cimatti, A., Zamorani, G., et al. 2005, A&A, 437, 883
- (90) Moustakas, J., Coil, A. L., Aird, J., et al. 2013, ApJ, 767, 50
- (91) Naab, T., Johansson, P. H., & Ostriker, J. P. 2009, ApJ, 699, L178
- (92) Newman, A. B., Ellis, R. S., Bundy, K., & Treu, T. 2012, ApJ, 746, 162
- (93) Piovan, L., Tantalo, R., & Chiosi, C. 2003, A&A, 408, 559
- (94) Polletta, M., Tajer, M., Maraschi, L., et al. 2007, ApJ, 663, 81
- Popesso et al. (2009) Popesso, P., Dickinson, M., Nonino, M., et al. 2009, A&A, 494, 443
- Ravikumar et al. (2007) Ravikumar, C. D., Puech, M., Flores, H., et al. 2007, A&A, 465, 1099
- Reddy et al. (2006) Reddy, N. A., Steidel, C. C., Erb, D. K., Shapley, A. E., & Pettini, M. 2006, ApJ, 653, 1004
- (98) Rodighiero, G., Cimatti, A., Gruppioni, C., et al. 2010, A&A, 518, L25
- (99) Salim, S., Dickinson, M., Michael R. R., et al. 2009, ApJ, 700, 161
- (100) Salim, S., & Rich, M. 2010, ApJ, 714, L290
- (101) Salim, S., Fang, J. J., Rich, R. M., Faber, S. M., & Thilker, D. A. 2012, ApJ, 755, 105
- Salpeter (1955) Salpeter, E. E. 1955, ApJ, 121, 161
- (103) Schawinski, K., Kaviraj, S., Khochfar, S., et al. 2007, ApJS, 173, 512
- (104) Shim, H., Im, M., Lee, H. M., et al. 2011, ApJ, 727, 14
- (105) Silva, L., Granato, G. L., Bressan, A., & Danese, L. 1998, ApJ, 509, 103
- Silverman et al. (2010) Silverman, J. D., Mainieri, V., Salvato, M., et al. 2010, ApJS, 191, 124
- (107) Skibba, R. A., Engelbracht, C. W., Dale, D., et al. 2011, ApJ, 738, 89
- (108) Stern, D., Eisenhardt, P., Gorjian, V., et al. 2005, ApJ, 631, 163
- (109) Strateva, I., Ivezić, Ž, & Knapp, G. R. 2001, AJ, 122, 1861
- Szokoly et al. (2004) Szokoly, G. P., Bergeron, J., Hasinger, G., et al. 2004, ApJS, 155, 271
- Teplitz et al. (2011) Teplitz, H. I., Chary, R., Elbaz, D., et al. 2011, AJ, 141, 1
- (112) Tinker, J. L., Leauthaud, A., Bundy, K., et al. 2013, ApJ, 778, 93
- Vanzella et al. (2005) Vanzella, E., Cristiani, S., Dickinson, M., et al. 2005, A&A, 434, 53
- Vanzella et al. (2006) Vanzella, E., Cristiani, S., Dickinson, M., et al. 2006, A&A, 454, 423
- Vanzella et al. (2008) Vanzella, E., Cristiani, S., Dickinson, M., et al. 2008, A&A, 478, 83
- (116) Vega, O., Bressan, A., Panuzzo, P., et al. 2010, ApJ, 721, 1090
- (117) Willmer, C. N. A., Faber, S. M., Koo, D. C., et al. 2006, ApJ, 647, 853
- Wirth et al. (2004) Wirth, G. D., Willmer, C. N. A., Amico, P., et al. 2004, AJ, 127, 3121
- (119) Wolf, C., Gray, M. E., & Meisenheimer, K. 2005, A&A, 443, 435
- (120) Wolf, C., Aragón-Salamanca, A., Balogh, M., et al. 2009, MNRAS, 393, 1302
- Xia et al. (2011) Xia, L., Malhotra, S., Rhoads, J., et al. 2011, AJ, 141, 64
- (122) Yi, S. K., Yoon, S.-J., Kaviraj, S., et al. 2005, ApJ, 619, L111
- (123) York, D. G., Adelman, J., Anderson, J. E. Jr., et al. 2000, AJ, 120, 1579