Optical characterization of RTV615 silicone rubber compound
Abstract
Room Temperature Vulcanized (RTV) silicone compounds are commonly used to bond optical components. For our application, we needed to identify an adhesive with good ultraviolet transmission characteristics, to couple photomultipliers to quartz windows in a Heavy Gas Čerenkov detector that is being constructed for Experimental Hall C of Jefferson Lab to provide separation up to 11 GeV/c. To this end, we present the light transmission results for Momentive RTV615 silicone rubber compound for wavelengths between 195-400 nm, obtained with an adapted reflectivity apparatus at Jefferson Lab. All samples cured at room temperature have transmissions 93% for wavelengths between 360-400 nm and fall sharply below 230 nm. Wavelength dependent absorption coefficients were extracted with four samples of different thicknesses cured at normal temperature (25∘C for 7 days). The absorption coefficient drops approximately two orders in magnitude from 220-400 nm, exhibiting distinct regions of flattening near 250 nm and 330 nm. We also investigated the effect of a high temperature curing method (100∘C for 1 hour) and found 5-10% better transmission than with the normal method. The effect was more significant with larger sample thickness (3.35 mm) over the wavelength range of 220-280 nm.
keywords:
optical transmissivity; absorption coefficient; silicone RTV; photomultiplier tube; Heavy Gas C̆erenkov detector1 Introduction
Silicone adhesives are very useful materials with widespread application in optomechanics. The application may require fixing the pieces together without obscuring the transmitted optical path, thus demanding an optically transparent adhesive. Ideally, the adhesive should have a flat spectral transmittance curve throughout the spectrum of interest, imparting no coloration. Likewise, the transmittance should be high in the spectral region of interest. Room Temperature Vulcanized (RTV) materials, such as silicone adhesives, meet these requirements. Momentive 111Momentive, 180 East Broad Street, Columbus, OH 43215, USA RTV615 silicone rubber compound (henceforth referred to simply as RTV615) is a clear liquid which cures at room temperature to high strength silicone rubber with the addition of curing agents. It has good optical clarity and good mechanical properties, making it well suited for applications such as potting solar cells, and for fixing optical components together.
In our application, we used RTV615 to couple Hamamatsu 222Hamamatsu Photonics K.K., Electron Tube Division, 314-5, Shimokanzo, Iwata City, Shizuoko Prefecture, 438-0193, Japan R1584 127 mm (5′′ ) photomultiplier tubes (PMTs) to custom quartz adaptors for use in a Heavy Gas Čerenkov (HGC) detector [1] filled with C4F8O gas at Jefferson Lab Hall C 333Thomas Jefferson National Accelerator Facility, 12000 Jefferson Ave., Newport News, VA 23606, USA. The HGC will be used in threshold mode, providing charged separation in the momentum range 3-11 GeV/c, so good light collection efficiency is important to provide reliable particle identification. The R1584 photomultiplier has a spherically-shaped head with 132 mm radius of curvature, and a plano-concave quartz adaptor with similar radius of curvature is required to mate the PMT to a flat quartz viewport. Čerenkov light emission is strongly peaked in the ultraviolet (UV), with radiation extending in wavelength all the way down to the C4F8O absorption band at nm. To minimize optical loss at the interface between the quartz adapter and PMT face, we required a clear optical adhesive to fill the gap between the adapter and PMT, with good UV transmission characteristics.
The optical transmission of RTV615 has been previously measured by Klamara, et al., to be nearly 100% between 250-320 nm [2]. Subsequently, Reekie et al., measured the transmission of RTV615 between 220-250 nm for a sample thickness of 150 m [3]. However, the effective Čerenkov radiation band in our application ranges from 185-600 nm, thus an extensive study of the material transmission is required to better understand the overall photon detection efficiency of our setup.
In this report, we present the transmission results for RTV615 between 195-400 nm wavelength. Section 2 presents our sample preparation, measurement methods and associated experimental systematic uncertainties. There are two different curing methods suggested by the vendor at normal (room) and high (100∘C) temperatures. For our application, the normal temperature method is the most appropriate to avoid exposing the PMTs and quartz adapters to heat as they are bonded by RTV in situ. Thus the normal curing method is studied in more detail than the high temperature method. Section 3 presents the transmission results, and extracted wavelength dependent absorption coefficients and surface scaling factors for the normal temperature cured samples. Section 4 gives a short discussion and summary of the main conclusions.
2 Experiment
2.1 RTV615 Silicone Compound and Sample Preparation
The Momentive RTV615 A+B silicone compound consists of: RTV615 A silicone compound and RTV615 B hardener. The recommended A to B mixing ratio is 10:1 by weight and the working time is 4 hours. The RTV615 A and B compounds were sequentially added to a plastic mixing cup and the compound masses were monitored and controlled by a digital scale with precision to 0.01 g. The recommended mixing ratio was achieved to a highly accurate level, since the ratio between the instrumental uncertainty (0.01g) and the total mixing amount (20 g) is very small. After mixing, the compound was placed into a vacuum system (1 Torr) to eliminate air bubbles, then carefully poured into a 2′′ diameter dish for curing. The recommended curing time for mixed RTV615 is 6-7 days at 25∘C, or 1 hour at 100∘C [4]. Nine samples were prepared and six of them were tested. Each of the samples has a different thickness and preparation method, as listed in Table 1. All samples were shaped to fit into a 2′′ circular optical holder, and so had equal diameter.
The RTV sample thicknesses were measured with a micrometer at five random locations and averaged, the standard deviation is listed in Table 1 as the first error column. The errors in the second column were computed by assuming that the sample alignment could deviate from normal transmission by in front of the detector, and is our estimate of sample positioning/alignment uncertainties. The total error in the RTV sample thickness is the quadratic sum of the two error columns, and is a reflection of the non-uniformity of the sample convolved with the positioning systematic uncertainties.
| Sample | Mass | Thickness | Curing Method |
|---|---|---|---|
| (#) | (g) | (mm) | (Temperature ∘C) |
| 1 | 4.20 0.01 | 1.90 0.07 0.02 | Normal (25 ∘C) |
| 4 | 7.31 0.01 | 3.35 0.07 0.02 | Normal (25 ∘C) |
| 6 | 5.05 0.01 | 2.30 0.02 0.02 | Normal (25 ∘C) |
| 7 | 3.20 0.01 | 1.48 0.05 0.02 | Heat (100 ∘C) |
| 8 | 3.03 0.01 | 1.37 0.02 0.02 | Normal (25 ∘C) |
| 9 | 7.37 0.01 | 3.39 0.02 0.02 | Heat (100 ∘C) |
2.2 Measurement Setup
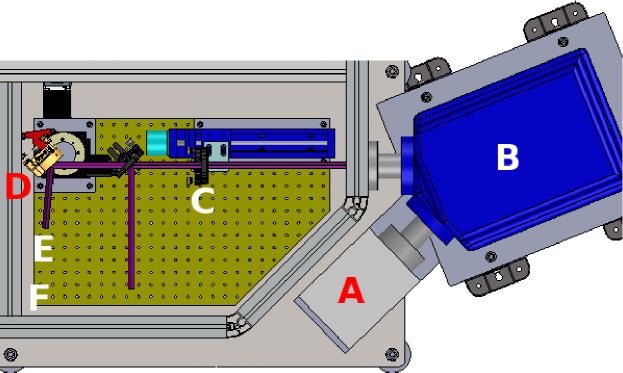
The measurements were performed with an adapted reflectivity apparatus in the care of the Jefferson Lab Detector Development Group and Free Electron Laser Facility. A schematic diagram of the setup is shown in Fig. 1. The main body of the setup is constructed in three parts: the light source box, the monochromator and the detector hutch. The light box houses a deuterium (D2) lamp and an 1.5 focussing lens. Light from the deuterium lamp passes through the monochromator and is filtered into a single wavelength, then it is focused by 4 focussing lens and reflected by a flat Deep Ultra-Violet (DUV) reflecting mirror before reaching the photodiode detector. Note that the monochromatic light is chopped by a MC-100 optical chopper at a frequency of 14 Hz, thus producing an AC signal for the detector. The distance from the monochromator exit slit to the 4 focussing lens () is 31 cm, and total distance from the focusing lens to the detector () is 69 cm. During the measurement, the sample was mounted into a 2′′ optical holder placed directly in front of the photodiode, the estimated distance from the sample to the detector is less than 3 mm. For further details on the reflectivity setup used to obtain the transmission results, please see Refs. [6, 7].

The applied measurement principle is known as the lock-in amplification technique, which is often used in astronomy to detect a very small AC signal in a narrow wavelength band from a large constant background. During the measurement, the lock-in amplifier picks up the monochromatic AC signal, then applies amplification before sending to the data acquisition system. Despite the fact that the measurement was not performed in a dark box, the detector dark noise was about V, which is much less than the measured signal ( V). The signal fluctuation is too small to be considered as a source of error. A schematic diagram of signal treatment is shown in Fig. 2.
The monochromator was calibrated and installed with a holographic 200 nm blaze (1200 G/mm) grating to optimize the performance around 200 nm wavelength. The size of the focused image was 6 mm 4 mm at 225 nm, which corresponds to the peak of the D2 lamp spectrum. The transmission measurements range from 195-400 nm in 5 nm steps. At these other wavelengths, the focussed image will be slightly larger, but still easily within the 1 cm 1 cm sensitive region of the photodiode [5]. The signal outputs from the photodiode were fed into a SR530 lock-in amplifier, set for 3 s time constant and 5 mV sensitivity. The monochromator dwell time was set for 30 s.
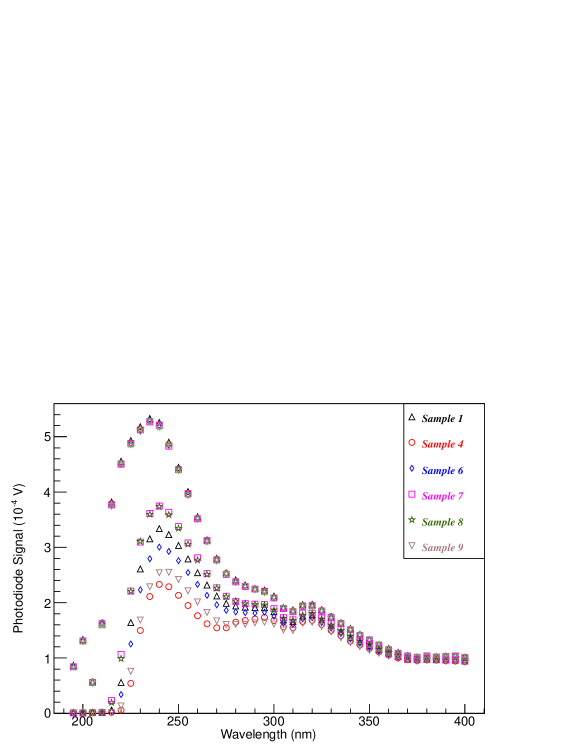
A reference spectrum was monitored before every measurement for the purpose of monitoring the lamp stability and computing the systematic uncertainty. The duration of a complete set of measurements was around six hours. The lamp stability was studied and confirmed to have less than 0.5% fluctuation by the consistency of the reference spectra in Fig. 3. The transmission results are the ratios between the measured and reference spectra.
2.3 Systematic Error Analysis
For each sample, the reference spectra were monitored prior to the acquisition of the measurement spectra. The measurement takes 5-6 hours and the six reference spectra were taken approximately 1 hour apart, where the conditions for each of the reference spectra should be identical. The differences among these measurements include systematic uncertainties such as: lamp stability, background noise, and setup vibration. The differences between the reference spectra are less than 0.5%. For each sample, six transmissions were computed, using the one measured spectrum and the six reference spectra. The average of the six transmission values was taken as the transmission, and the standard deviation was taken as the uncertainty. The transmission uncertainties are less than 1% across all measured wavelengths.
The focal length of the optical lens is wavelength dependent. When a wavelength scan is performed across a wide range of wavelengths, one needs to confirm the light beam is no larger than the effective area of the detector at all measured wavelengths due to defocusing. The effective area of the light detector used in this work is 1 cm 1 cm, and the light beam is setup to be focused to a 6 mm 4 mm vertical rectangle at 225 nm. The focussed spot size was confirmed to be projected within the detector acceptance at all wavelengths.
3 Results
3.1 Transmission Results with Different RTV Thicknesses
Fig. 4 shows the transmission results for RTV samples #1, #4, #6 and #8. These four samples were cured with the normal preparation method, and their masses and thicknesses information are listed in Table 1. All four transmission curves show similar characteristics for wavelengths between 360-400 nm as well as below 235 nm. In the 360-400 nm wavelength region, the transmission curves fluctuate around 93% with deviations of 2.5%; below 235 nm, the curves fall sharply and a cut-off occurs at 220 nm.
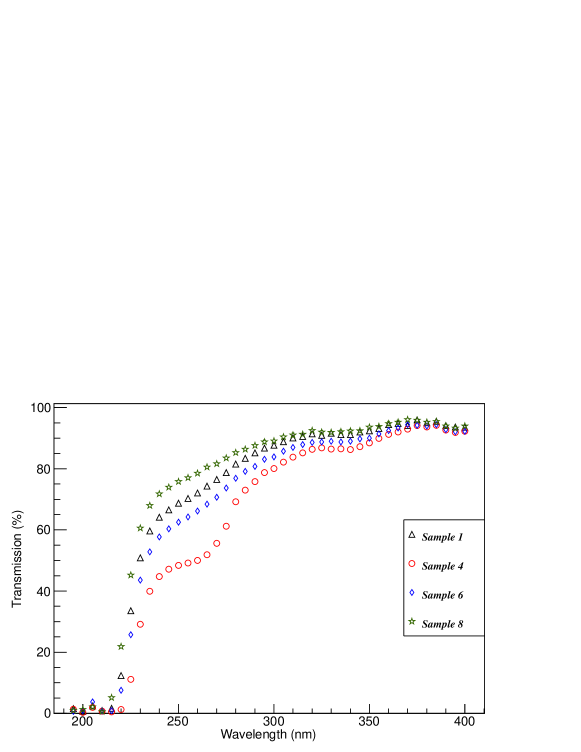
For the intermediate (235-310 nm) wavelength range, the transmission curves of the three thinner samples (#1, #6 and #8) share similar characteristics: the transmission gradually increases from 70% to 93% between 235-310 nm. The thicker sample #4 shows a sharp increase (about 35%) between 265-310 nm, and two gentler increases between 235-265 and 320-360 nm. From the comparison, it is obvious that the thinner samples have better transmission, particularly between 235-310 nm wavelengths.
3.1.1 Absorption Coefficient Fitting Results
According to Beer-Lambert’s law, the intensity of an electromagnetic wave propagating through a material drops off exponentially from the surface as
| (1) |
where is the electromagnetic wave intensity at the surface of the material, is the penetration depth, and is the absorption coefficient. The absorption depth can be computed as
| (2) |
The transmission can be expressed
| (3) |
In reality, surface reflection, and other scattering processes may cause a loss to the detected signal, therefore an additional surface scaling factor is introduced
| (4) |
where corresponds to the signal loss at zero thickness (surface only) and ranges between 0-1.
In Fig. 4, the transmission curves are shown for four different RTV thicknesses, thus the and values can be extracted by fitting the transmission data to Eq. 4 at any given wavelength. The fitting ranges of and are set to be between 0.001-2 and 0.95-1.0, and the initial fitting values are 0.1 and 0.97.
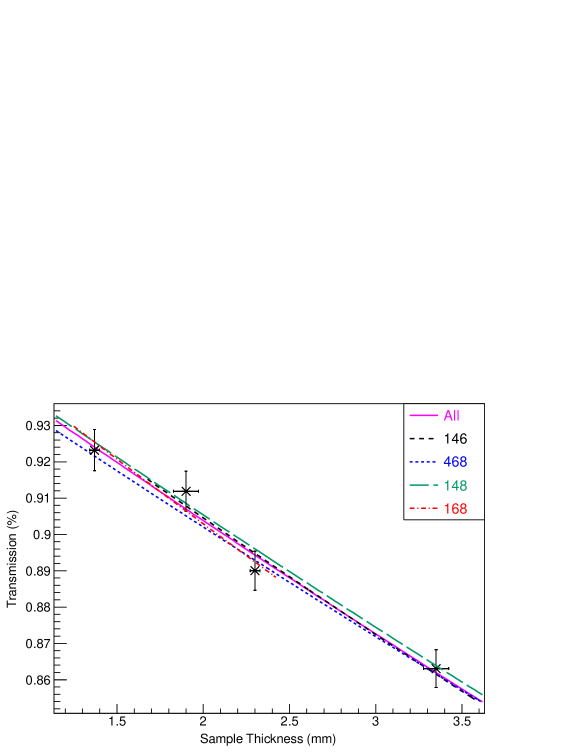
Fig. 5 shows a typical example for extracting and from the transmission results and RTV sample thicknesses at 340 nm. The five curves shown on the plot include the four data points fit and the four combinations of three data point fits. The three data point fits were performed to check the consistency of the result if a single point was excluded, for example if the thickness used for that sample was outside the assigned systematic error. Note that sample #4 is the greatest thickness, thus the 168 fit has the least coverage in sample thickness and so its fitting result is more uncertain. The curves of the three point fitting results are consistent within errors of the four point fit.
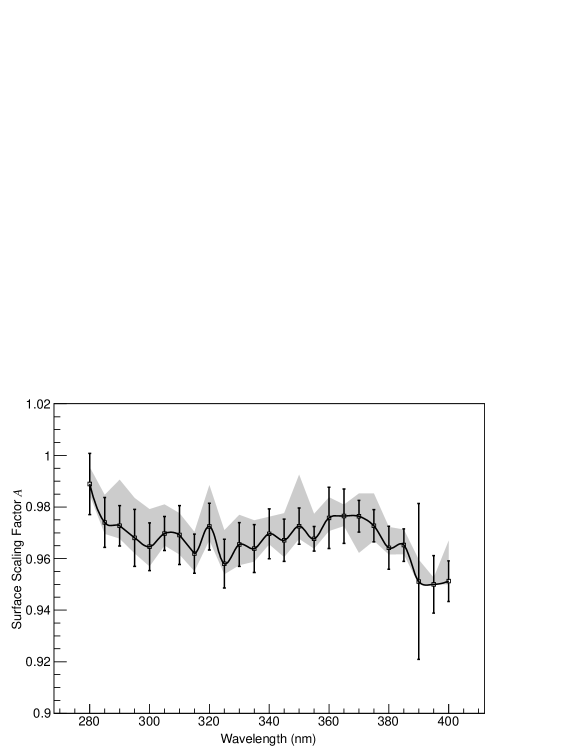
Fig. 6 shows the fitted results with all four samples in Fig. 4 from 220-400 nm. The transmissions below 220 nm are too small and too close to each other in value to provide reliable absorption coefficient fits. The shaded band around the curve is the variation of the fitted using only three out of four samples (four combinations in total), as indicated in Fig. 5. Anticipated fitted values range from 0.9-1.0 between 280-400 nm, as expected for a true surface effect from clean silicone. The data fits for 230-280 nm prefer a scaling value slightly larger than 1, consistent with 1.00 within an accuracy of about 5%. The fitted values and associated errors are somewhat larger for 220-230 nm. Since we could not identify a justifiable reason to allow the surface scaling factor to exceed 1, we fixed below 280 nm to extract the . If this restriction was lifted, it would result in a value of higher by 10-20% for 280nm.
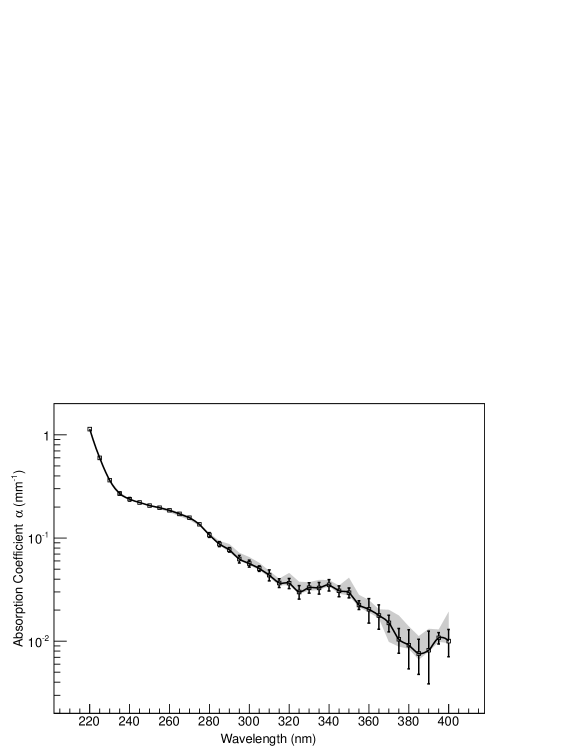
Fig. 7 shows the fitted versus wavelength curve for all four samples. The band around the curve is the variation range of the fitted using only three of four samples, as previously discussed for . The value and its error bar at any given wavelength can vary within the band. The values show an overall increasing trend as the wavelength gets shorter. Noticeably, there is a plateau between 320-350 nm and a second region with gentle slope between 235-270 nm. Since these correspond to photon energies of 3.7 and 4.9 eV, respectively, which are of the typical order of molecular transitions, these plateaus are likely caused by some aspect of the molecular structure of the cured RTV compound, such as either absorption or large-angle diffractive scattering from the molecule. In addition, the upper edge of the UV absorption begins at 230 nm.
3.2 High Temperature Curing Method
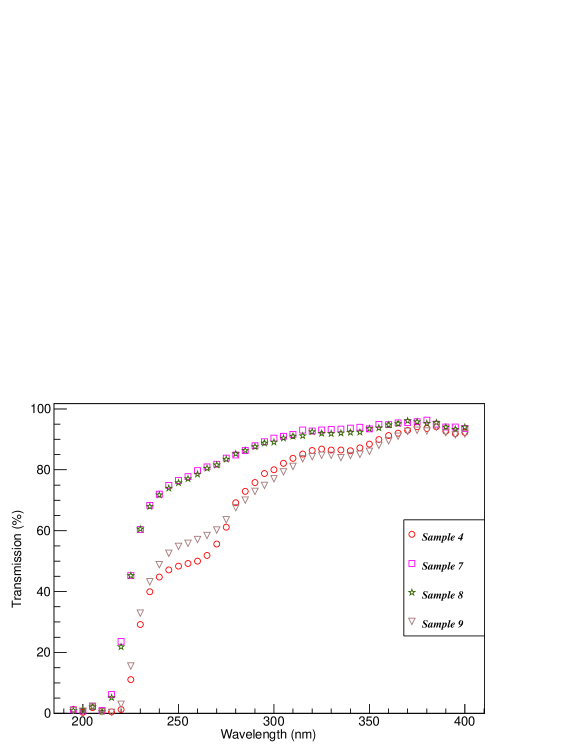
In order to directly compare the transmission results between the two recommended curing methods, we prepared two pairs of samples of similar thicknesses (masses) and their transmission results are plotted in Fig. 8. The transmission curves for samples #7 and #8 are almost identical through all wavelengths, where the former was cured with heat and the latter with the normal method. However, sample #8 is 5% thinner than sample #7, which implies the heat method may have some positive effect in terms of photon transmission. The effect of the heat method is more obvious by comparing the transmission between samples #4 and #9, where the former is cured with normal method and the latter with the heat method. The mass difference between the two samples is less than 1%. The sample #9 (heat) transmission is 5-10% higher than that of sample #4 (normal) between 235-265 nm, and the difference between the two curves are less than 2% at other wavelengths.
The material density of both normal and heat cured samples were measured to be 0.909 g/cm3 0.063 g/cm3, assuming a water density of 1 g/cm3 with no uncertainty. A buoyancy test was also carried out to compare the sample density cured by different methods. The result suggests the density difference between the normal and heat prepared samples is negligible, thus we conclude the density difference is not the cause for the deviation in the transmission for samples with different preparation methods.
4 Discussion and Summary
In this work, we present optical transmission results for RTV615 between 195-400 nm, including an extraction of the absorption coefficient versus wavelength for the first time. The previously published transmission curve between 220-250 nm in Ref. [3] shows the same falling edge at 230 nm, despite the extremely small sample thickness of 150 m. To make a more detailed comparison to our results, we extracted absorption coefficients from our transmission data between 220-250 nm, computed for 150 m thickness. The two sets of transmission results between 225-250 agree remarkably well once our calculated values are adjusted lower by 5% at all wavelengths. Given the limited wavelength range of Ref. [3], it is difficult to make a definitive statement on the origin of this difference, but it is consistent with a 5% surface effect in the transmission data of Ref. [3], for example caused by reflection from the sample surface. The 240-320 nm transmission results of Ref. [2] also share the same general trends as our data, but given the quality of those data, it is difficult to make a more quantitative comparison.
To briefly summarize, our measurements indicate that all samples cured at normal temperature have transmissions around 93% for wavelengths between 360-400 nm, and the upper edge of the UV absorption begins at 230 nm. This performace was sufficient for our intended application in a Heavy Gas Čerenkov detector. These results are also reasonably consistent with previously published data, although there may be an unexplained surface reflection in the results of Ref. [3]. We also measured the transmission versus sample thickness and extracted the absorption coefficient in units mm-1. The absorption coefficient shows an overall decreasing trend with increasing wavelength, and was found to drop approximately two orders in magnitude from 220-400 nm, exhibiting distinct regions of flattening near 250 nm and 330 nm. We also investigated the effect of a high temperature curing method (100∘C for 1 hour) and found 5-10% better transmission than with the normal method (25∘C for 7 days). The effect was more significant with larger sample thickness (3.35 mm) over the wavelength range of 220-280 nm. Since the effect of high temperature curing method was small and would have been complicated to implement in our application, we did not pursue the heat study further.
Acknowledgements
We are grateful for the support from the Jefferson Lab scientists and technical staff. We also thank G.J. Lolos, B. Sawatzky, and A. Semenov for their critical reading of the manuscript. Special thanks to Chris Gould for the use of the CAD drawing for the reflectivity setup. This work was funded in part by the Natural Sciences and Engineering Research Council of Canada (NSERC).
References
- [1] G.M. Huber, SHMS Heavy Gas C̆erenkov, HallC-doc-33-v1, January 22, 2008
- [2] W. Klamara, Th. Lindblad, M. Moszynski, L. O Norlin, Properties of Optical Grease for BaF2 Scintillators, Nuclear Instruments and Methods in Physics Research A254 (1987) 85-87.
- [3] L. Reekie, L. Chao, M. Ibsen, Fibre Gratings Written through the Coating at 244 nm and 248 nm, IEEE Colloquium on Optical Fibre Gratings, Ref. No.1999/023, pages 2/1-2/4.
- [4] Momentive RTV615 and RTV655 Technical Data Sheet. http://www.momentive.com/products/showtechnicaldatasheet.aspx?id=10333
- [5] IRD Photodiodes - AXUV Operating Principles and Apps. Opto Diode Corp, 750 Mitchel Road, Newbury Park, CA 91320. Website: www.optodiode.com
- [6] W. Li, G.M. Huber, et. al, Heavy Gas Cerenkov Mirror Reflectivity Measurements, HallC-doc-735-v1, August 23, 2012.
- [7] W. Li, Operation Manual for Reflectivity Measurement Setup of Free Electron Laser Facility at Jefferson Lab, HallC-doc-754-v1, February 22, 2013.