Corresponding Author: ]Dongming.Mei@usd.edu
Measuring Muon-Induced Neutrons with Liquid Scintillation Detector at Soudan Mine
Abstract
We report a direct detection of muon-induced high energy neutrons with a 12-liter neutron detector fabricated with EJ-301 liquid scintillator operating at Soudan Mine for about two years. The detector response to energy from a few MeV up to 20 MeV has been calibrated using radioactive sources and cosmic-ray muons. Subsequently, we have calculated the scintillation efficiency for nuclear recoils, up to a few hundred MeV, using Birks’ law in the Monte Carlo simulation. Data from an exposure of 655.1 days were analyzed and neutron-induced recoil events were observed in the energy region from 4 MeV to 50 MeV, corresponding to fast neutrons with kinetic energy up to a few hundred MeV, depending on the scattering angle. Combining with the Monte Carlo simulation, the measured muon-induced fast neutron flux is determined to be cm-2s-1 (En MeV), in a reasonable agreement with the model prediction. The muon flux is found to be ( cm-2s-1 (Eμ 1 GeV), consistent with other measurements. As a result, the muon-induced high energy gamma-ray flux is simulated to be 7.08 10-7cm-2s-1 (Eγ 1 MeV) for the depth of Soudan.
pacs:
25.30.Mr, 28.20-v, 29.25.Dz, 29.40.McI Introduction
Measuring muon-induced fast neutrons is important to the understanding of backgrounds for many rare event physics experiments including direct searches for dark matter. Dark matter is believed to account for about a quarter of the mass-energy budget of the known universe trimble . However, the nature of dark matter is still mysterious to us so far. As a candidate of dark matter, Weakly Interacting Massive Particle (WIMP) is a target for direct detection through a set of underground experiments. Some of them, such as DAMA dama , CDMS-Si cdms , CoGeNT cogent , and CRESST-II cresst have claimed positive results while others including CDMS-Ge, Xenon100, LUX cdms2 ; xenon100 ; lux , and SuperCDMS supercdms have ruled out those claims. Many experiments have set an upper limit on the mass cross-section contour of WIMPs interacting with normal matters picasso ; naiad ; zeplin ; edelweiss ; simple ; superKamiokande ; cdms2 ; xenon100 ; lux ; supercdms . The next generation ton-scale experiments aim to achieve a sensitivity of 10-48 cm2 to WIMP-Nucleon cross-section for WIMP mass of 100 GeV.
Understanding the background events is the key to the success of any dark matter search experiment. Because they behave in a manner similar to WIMPs, fast neutrons are taken as a vital background for these rare event physics experiments at deep underground. Although the cosmogenic effects are dramatically suppressed by rock overburden mei , the energy spectrum, angular and multiplicity distribution of the fast neutrons induced by muons underground are not well understood yfw ; vku ; mei ; hav ; vkl ; ggv ; mma ; har . Muon-induced neutron production rates in different targets have been recently measured by many experiments sbe ; borx ; lre through measuring neutron captures. The direct measurements of neutron energy spectrum have not yet been reported. The muon-induced fast neutrons with energy above 10 MeV are difficult to shield and can contribute to the total background budget for a given experiment. The fast neutrons, from reaction and fission decay in the surrounding rocks, are lower in energy and thus easier to stop. To characterize those neutrons as a source of background for dark matter experiments in an underground environment by deploying a neutron detector in-situ will definitely help the understanding of the experimental results.
A neutron measurement usually involves identity discrimination using scintillation detectors and energy scaling utilizing the time of flight (TOF) technique. However, the TOF measurement will largely limit the acceptance of neutrons. Because of the low neutron intensity at deep underground sites, a neutron detector with large detection efficiency is needed. In addition to the TOF technique, the recoil energy of ions in liquid scintillators can represent the energy of incident neutrons if the detector response to nuclear recoils is well understood with a Monte Carlo simulation. The EDELWEISS dark matter search experiment reported the measurements of Germanium recoils in coincidence with muon signals in scintillators edelweiss2 . The neutron-induced recoils have energies up to 60 keV, corresponding to neutron energies up to GeV, depending on the scattering angle. The LVD experiment at Gran Sasso has also reported neutron-induced recoil energy up to 300 MeV in liquid scintillators lvd . With bigger acceptance, a large liquid scintillation detector holds promise to directly measure fast neutrons in a deep underground environment.
The light response to nuclear recoils caused by neutrons within liquid scintillators are usually measured using the TOF technique or the unfolding method. The latter one requires a response function to unfold the visible energies “seen” by PMTs to the recoil energy caused by incident neutrons. Such a function has been widely studied for neutron energies from a few MeV to several hundred MeV cecil ; batch ; verb ; gul ; aksoy ; nakao with small scintillation detectors (several liters). Several Monte Carlo codes such as CECIL cecil , O5S o5s and SCINFUL scinful are developed to calculate the neutron response function in liquid scintillators.
Aimed at characterizing fast neutrons at deep underground sites, a neutron detector has been fabricated at the University of South Dakota (USD). It consists of an aluminum tube, one meter long and 5 inches in diameter, filled with 12 liters EJ-301 liquid scintillator. Two 5-inch Hamamatsu PMTs (R4144) are attached to both ends of the tube through Pyrex windows to collect the scintillation light. Detailed calibration procedures and neutron-gamma separation techniques are discussed in Ref. LSneu . In this paper, the detector responses to atmospheric neutrons are studied. We show the measured nuclear recoils with energy up to 50 MeV using two years data collected at the Soudan Mine.
II Energy calibration for high energies
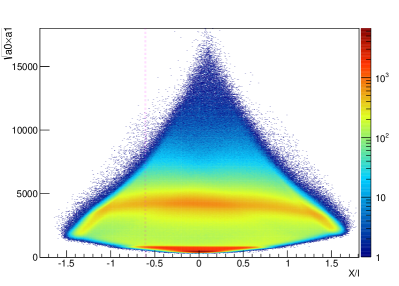
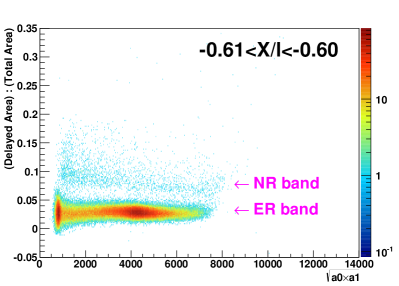
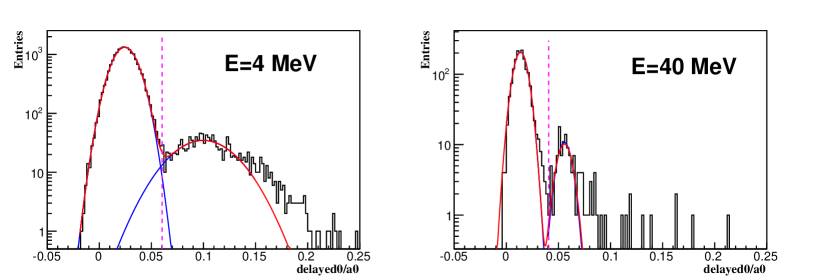
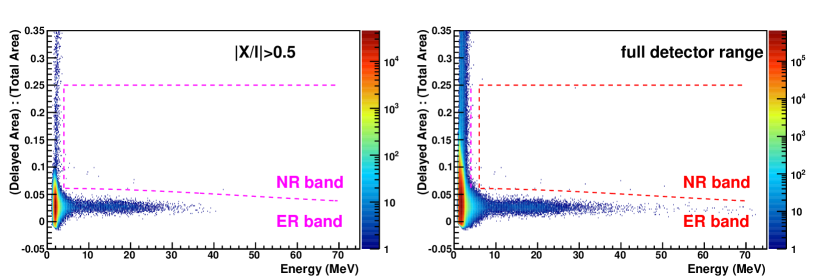
A background run with a live time of 19.4 days was conducted in a surface building at the USD campus prior to moving the detector underground. Following the calibration strategy we developed in Ref. LSneu , the detector responses to scintillation lights are shown in FIG. 1. An example of NR/ER discrimination from a very narrow position range is also shown in the right plot.
According to Ref. birkslaw , the light output is a function of the stopping power for a charged particle travelling in the scintillator
| (1) |
where stands for the scintillation efficiency and is called Birks’ constant for the specified medium. As can be seen in Eq. (1), for electrons with energies greater than keV in the scintillator, the stopping power becomes very small birkslaw which makes , as a result, the light output can be simplified to be a linear relation to higher energies.
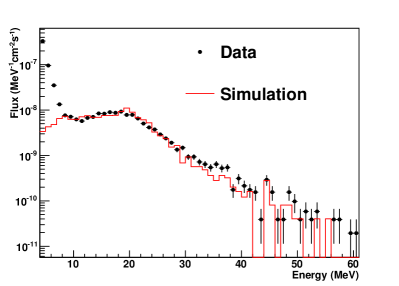
This liquid scintillation detector is calibrated from 1 MeV to 20 MeV by using 22Na (1.275 MeV), AmBe sources (4.4 MeV), and the minimum ionization peak from cosmic muons (20.4 MeV). Applying the position independent variable , where stands for the total charge converted from PMT0 and is the total charge converted from PMT1, a second order polynomial function is assumed to fit the calibration curve for energy below 20 MeV. For energies above 20 MeV, the first order approximation is a simple extension from the low energy calibration curve. Considering the background signals with the energy above 10 MeV are dominated by the well-understood surface muons, the calibration curve above 20 MeV is then adjusted by the detector response to the surface muons. A GEANT4 geant4 (GEANT4.9.5.p02 + Shielding module physics list) based simulation is conducted with a modified Gaisser’s formula modGaisser (sea level) to sample the shape of the energy spectrum and angular distribution of input muons. The simulated detector response to muons is compared with data by assuming a linear relation, justified by Eq. (1), between the light output and the energy deposition ( MeV) in the detector. The slope of the calibration line ( MeV) is then determined by fitting the detector response to the simulated muons with the corresponding data.
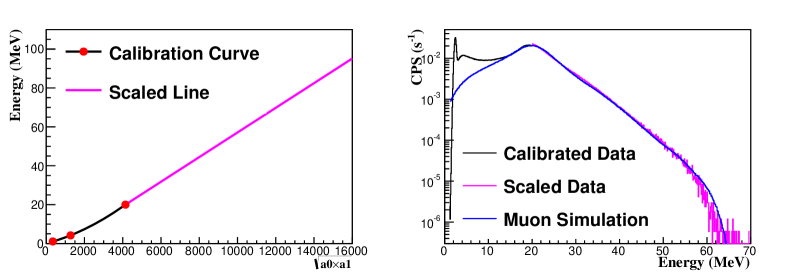
The plots in FIG. 2 demonstrate how the high energy calibration line (left) is determined by fitting data with the simulation (right). For the lower energy range ( MeV), the data are overwhelmed by the internal contamination and environmental gamma rays, which explains why the data and the muon simulation do not match at such range. It is worth mentioning that the absolute normalization of the detected muon intensity is 16.6% higher than the flux from sea level. This is reasonable because the surface muon data was taken at the campus of the University of South Dakota with an elevation of 1221 feet elevation above the sea level.
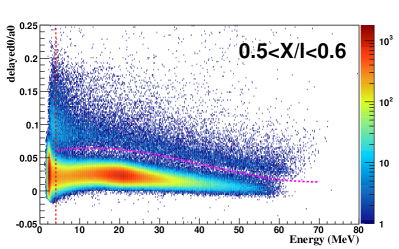
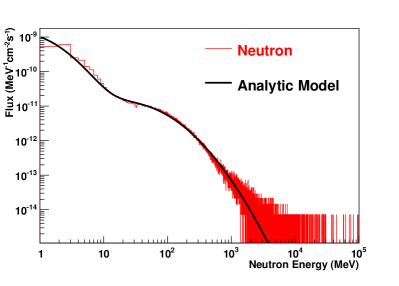
The plots in FIG. 3 and FIG. 4, as an example, represent the selected gamma rays and neutrons to reconstruct the surface muon and neutron energy spectrum. Utilizing the calibrated energy scale, we can assume that the linear relation between the energy deposition and the light output is the same for electron recoils and nuclear recoils after the correction for quenching.
III Light output response to fast neutrons
The results from the surface background run in FIG. 3 show the separation of nuclear recoils from electronic recoils. After selecting only those events from the NR band, the visible energy from nuclear recoils in the detector is shown in FIG. 5 (solid dots). The cut-off at 2 MeV is caused by energy threshold set on the trigger while the waterfall at 60-70 MeV is caused by the saturation of the Analog-to-Digital Converter (ADC) channels.
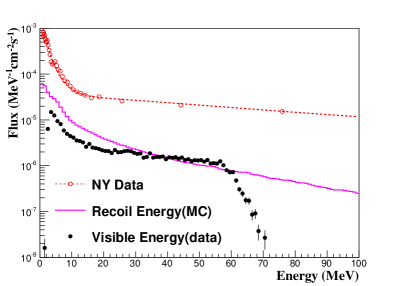
A simulation is performed by adopting the neutron energy spectrum from Ref. neuNYdata as an input. Although it is a neutron measurement in New York city, it can serve as a reasonable approximation by taking just the shape of the neutron energy spectrum with the intensity to be determined later by comparing the simulated detector response to the experimental data.
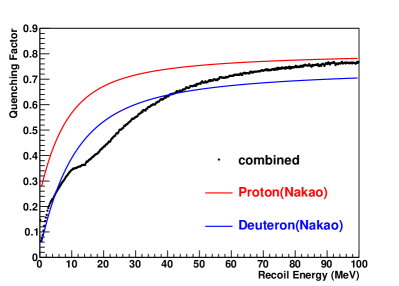
The nuclear recoils from neutrons in the detector are simulated and the result is shown in FIG. 5 (solid line). No cuts are applied to the simulated curve yet since we need to understand the light output response from nuclear recoils. The measured visible energy to nuclear recoils is also shown in FIG. 5 (black dots). A quenching factor matrix exists between the recoil energy and the visible energy “seen” by the PMTs. The light output in the liquid scintillator can be described by Birks’ relation birkslaw ; birks :
| (2) |
where represents the light output per unit path length. The quenching factor for nuclear recoils is defined as the ratio of light yield of ions to that of electrons of the same energy quenchingfactor . This definition allows us to calculate the quenching factor by rewriting Eq. (2) as:
| (3) |
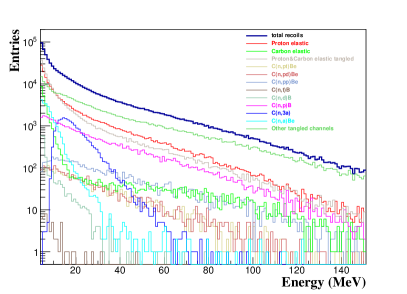
The Birks’ constant is believed to be the same for all particles in the same medium. For the liquid scintillator EJ-301, it has been measured to be 161 m/MeV ej301qf . The interactions of a fast neutron in the liquid scintillator are dominated by multiple scattering processes and therefore generate multiple ion recoils (see FIG. 6). This means that even if the total recoil energy is the same, it could be composed of single or multiple ion recoils which have different quenching factors in the scintillator. Theoretically, a combined quenching factor could be calculated if we track all scattering processes in simulations.
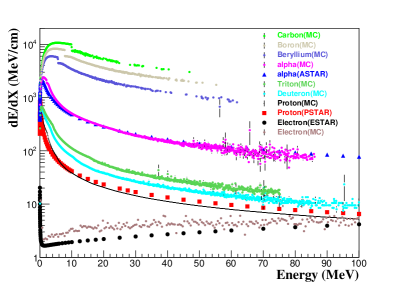
Other than the Birks’ constant, the other remaining variable is the stopping power for each ion in the scintillator. FIG. 7 summarizes the functions obtained from the simulations. The stopping power converted from the NIST web database ESTAR, PSTAR and ASTAR for electrons, protons and alphas in scintillators are also listed, respectivelyestar ; pstar ; astar . Within the web database, the material most similar to EJ-301 is the plastic scintillator. Therefore we take the mass stopping power of the plastic scintillator and convert it to be the stopping power for the liquid scintillator simply by applying the density of EJ-301 scintillator. The comparison in FIG. 7 shows that the stopping power function for alpha (ASTAR) and proton (PSTAR) have a reasonable agreement with the calculations from GEANT4 simulation. The stopping power of electrons from GEANT4 is about 20% higher than that from the ESTAR. This discrepancy is likely caused by the lack of correction for shell-effect, in GEANT4 for electrons. The stopping power we used to calculate the quenching factors are all from GEANT4 simulations. Therefore, this discrepancy is taken into account as part of the total uncertainty in deriving the measured neutron flux in section IV-B.
By applying Eq.(3) step by step for each nuclear recoil event in the simulation, a combined quenching factor function is generated as shown in FIG. 8. For the recoils with energy in the range of MeV, carbon scattering plays an important role in terms of quenching effect which drives the quenching factor much lower when compared to that of the proton only. When neutron energies approach MeV, processes start to build up. The combined quenching factor of multiple s has an even lower quenching factor when compared to single with the same total recoil energy in the scintillator. This explains why there is a “knee” at such an energy range. For high energy recoils, the most of the energy is taken by proton scatterings which make the combined quenching effect approaching to that of proton recoil in this range.
Applying the calculated quenching factor to each ion recoil in the simulation, the simulated visible energy is obtained and compared with the data (see FIG. 9).
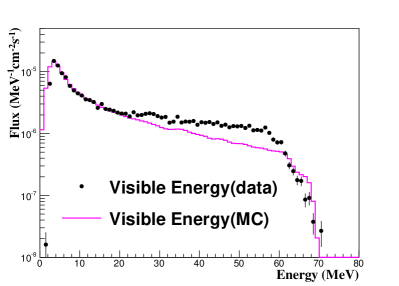
The simulated results show a good agreement with data for the energies below 20 MeV. For the energies above 20 MeV, the current simulation yields less nuclear recoil events by a factor of 2 than that of data. There are two reasons that may cause such a discrepancy. One is the limited understanding of the detector response to high energy neutrons, such as energy and position reconstructions. The other is the input source in which we only implemented neutrons in the simulation that ignored nuclear recoils induced by other possible sources such as protons, alphas, and high-energy gammas.
IV Muon and neutron measurements at Soudan Mine
The Soudan underground laboratory is located at a 690 m deep (2100 m.w.e) underground facility in the Soudan Mine, Minnesota. Several underground experiments such as MINOS minos , CDMS cdms0 , and CoGeNT cogent0 are running there. With such a large rock overburden, the background from cosmic-ray muons is dramatically suppressed. The muon flux, passing through a horizontal surface, at Soudan Mine was measured to be cm-2s-1 from the MINOS far detector minos1 . The neutron flux in the laboratory is dominated by the radioactivity from the surrounding rocks through reactions and fission decays which have the most of energies below 10 MeV. For those neutrons with higher energies, the production comes primarily from cosmic-ray muons through spallation processes.
IV.1 Simulation of muons and the muon-induced secondaries
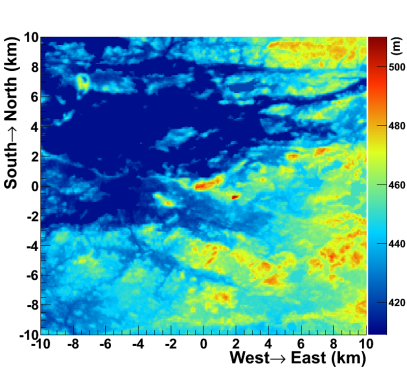
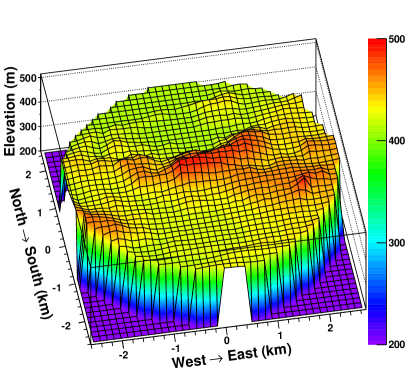
The high-energy particles produced underground are induced by cosmic-ray muons which penetrate from the Earth’s surface down to the mine. The intensity of these muons varies from one location to another, depending on the altitude, and profile of the mountains on the surface, as well as the rock densities along the path of muons. In order to quantify those cosmogenic events, a full GEANT4-based simulation has been conducted by adopting the surface mountain profile from the CGIAR satellite data usgs with the extension of 20 km 20 km as shown in FIG. 10. Note that a PeV muon has a travel distance 67 km in rocks on average. A 10 km radius would be sufficient to serve our simulation purpose. According to the information provided by MINOS experiment, its far detector situates at (longitude: 92o14’28.51443”W, latitude: 47o49’13.25409”N) location . A 20 cavern is assumed with the center located at (0, 0, -217 m) in the map.
A typical rock composition of Ely Greenstone is selected with an average rock density of 2.85 soudanRock in the simulation. Muons sampled from the modified Gaisser’s formula modGaisser are then tracked from the surface of the mountains down to the cavern. Finally, muons and the associated secondaries are collected at the ceiling and walls of the cavern with their energy and angular distribution displayed in FIG. 12.
The top-left plot in FIG. 12 compares the energy spectrum of the simulated muons in the cavern with the associated secondary neutrons and gamma-rays from surrounding rocks. The energy scale of the muons is in GeV while the neutrons and gamma-rays are in MeV. For the input surface muons, only single muons are simulated (no bundles). Therefore, the events with multiple muons in the results are due to pion decay on-flight. The comparison of their multiplicities in the top-right plot reveals the muon shower information:
-
•
The relative ratios for the production of neutrons and high-energy gamma rays are counted to be 1 GeV) 1 MeV) 1 MeV) =, which means that there are 1.15% of primary muons (Eμ 1 GeV) generated neutrons above 1 MeV and 71.5% of primary muons (Eμ 1 GeV) generated gamma rays above 1 MeV at the depth of Soudan.
-
•
The average multiplicity per muon-induced event is , which means that the average multiplicity for neutrons is about 2.6 and for gamma rays is about 9.9.
-
•
The angular distribution in the bottom plots indicate the angular correlation between the primary muon and its secondaries. Comparing to the neutrons, the gamma rays are more peak-forwarded with respect to primary muons. The angular distribution of neutrons show a little correlation with respect to primary muons angular distribution.
The reconstructed neutron energy spectrum from the Monte Carlo simulation can be expressed using an analytic model suggested in Ref. neuNYdata :
| (4) |
where the values of , , and are listed in Table 1. Note that is a normalization factor which is determined by fitting the neutron energy spectrum using Eq. 4, and are the parameters suggested in Ref. neuNYdata .
. 1 0.3500 2.1451 4.6283e-13 2 0.4106 -0.6670 1.0097e-09
By normalizing the live time to that of the input muons at the surface level, the absolute fluxes for the muons, neutrons and gamma rays in the cavern are obtained to be cm-2s-1( 1 GeV), cm-2s-1( 1 MeV), and cm-2s-1( 1 MeV), respectively. It is worth mentioning that the muon flux is defined as the muons passing through a horizontal surface where the muon flux is scaled by cos().
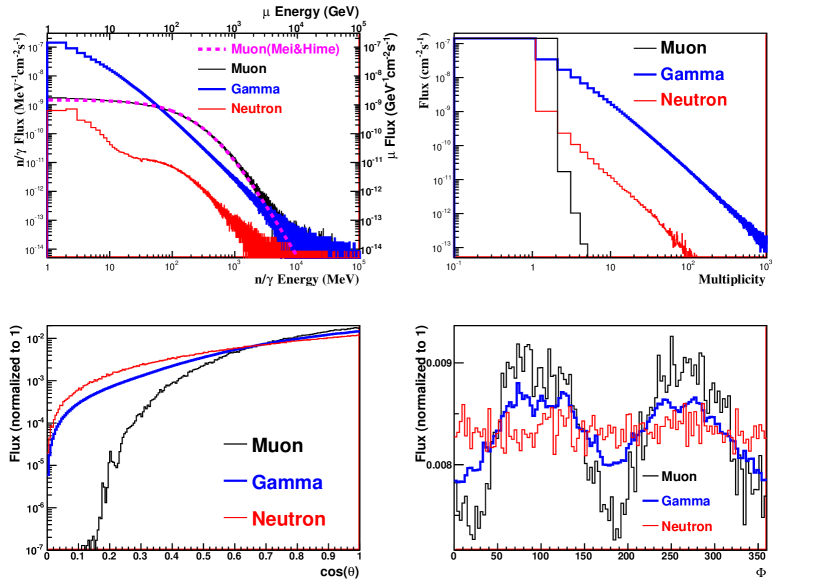
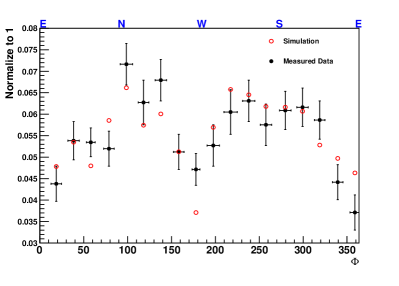
Although there are uncertainties from the input muon intensity and the rock density variations, the simulated fluxes serve as a first order of approximation for the intensity of muons and the induced secondaries in the cavern. The absolute normalization of the flux can be taken from the measurements. Note that the simulated muon flux, the shape of their energy, and angular distributions are in a good agreement with Mei&Hime prediction mei (cm-2s-1) and the muon angular distribution agrees with a measurement made by Ref. measuredphi . FIG. 13 shows the shape of muon azimuthal angle distribution compared with a measurement measuredphi made by using an active muon veto shield (room) at the Soudan Mine where the neutron detector situates inside. The bin size of the simulated azimuthal angle is reorganized according to that of the measurement data. A reasonable match is found which demonstrates the reliability of the simulations.
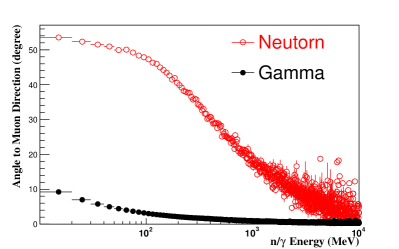
The angular correlation of shower particles with respect to the primary muon underground was studied by many authors mei ; yfw ; horn . Their simulation results show that, in general, the neutrons with kinetic energy greater than 10 MeV are rather peak-forwarded along the muon track. In our simulation, muon shower information is recorded on the ceiling and walls of a cavern with a size of 20 underground. In this case, the collected neutrons/gammas may not be produced directly from their primary muon. Also, only a solid angle of is considered, which means no back scattering particles are recorded in the simulation. The angular correlations of neutrons/gammas with respect to parent muons are shown in FIG. 14. As can be seen, the higher-energy secondaries including neutrons are rather peak-forwarded along the muon track and the lower-energy neutrons have a looser correlation.
IV.2 Measurement Results
IV.2.1 Muon flux
The detector has been taking data at the Soudan underground laboratory for about two years. The detector response to nuclear recoil (NR) and electronic recoil (ER) is measured and shown in FIG. 15. For those nuclear recoils occurring far from the PMTs (i.e., the middle of the tube), the pulse shape difference (comparing with ER event) is easier to be washed out due to the scattering and attenuation processes of photons on their way to the PMTs. Therefore their energy threshold of NR/ER separation is relatively higher than the events occurring closer to the PMTs. The left plot shows only the events with their position range in order to get better NR/ER separation especially for low energies. A 4 MeV energy threshold is set for good NR/ER separation in the left plot while a 6 MeV energy threshold is applied in the right for events from the entire detector. The events from the nuclear recoil band (see FIG. 15) are limited by the statistics. For those events with their visible energy below 4 MeV, the characterized ratio, , suffers severely from the random noise which is superimposed on the signal pulses.
The events from ER band in FIG. 15 (right plot) are picked out and normalized according to their live time. The corresponding energy spectrum is displayed in FIG. 16 (solid dots). Using the measured muons, the muon flux, passing through a horizontal surface, is determined below.
| (5) |
where , 13986 events with energy deposition greater than 10 MeV, is the number of muons across the entire detector, = 655.1 days, is the live time of the detector, = 1270 cm2, represents the detector area (12.7 cm in diameter and 100 cm in length), and = 98%, stands for the detection efficiency of muons after taking into account the saturation of detector and the muon energy loss through radiative process. Thus, the muon flux is (Eμ) = cm-2s-1 which agrees with the Monte Carlo simulation. However, = 1270 cm2, a geometric cross-section of the detector, is not an effective area of the detector subtend to muons with a pathlength greater than 5 cm in the detector for energy deposition greater than 10 MeV. This effective area must be obtained through a Monte Carlo simulation.
Taking the muons and the associated secondaries in the cavern as the input of simulation, the detector response to muon showers in the cavern is obtained with the result normalized to ER data ( MeV), for the same live time, as shown in FIG. 16 (red line). The simulated ER response to the muon shower is found to be a factor of 1.21 higher comparing to the measurement data. Taking this factor into account, we found the effective area, = 1526 cm2, which reduces the muon flux from cm-2s-1 to cm-2s-1 while the shape of muon energy and angular distribution between the MC and the ER data agree very well as shown in FIG. 12.
IV.2.2 Muon-induced neutron flux
Extracting the NR band from FIG. 15 (right plot), the detector response to nuclear recoils is shown in FIG. 17(solid dots). Utilizing the selected neutrons from the NR band, the neutron flux can be obtained as follow.
| (6) |
where is the selected neutron events per energy bin, is the detection efficiency which must be obtained through a Monte Carlo simulation since it depends strongly on neutron kinetic energy and scattering angle.
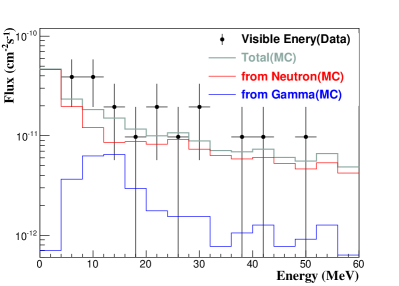
The simulated detector response to nuclear recoils takes the input muon showers from the results in FIG. 12. The normalization factor of 1.21 is also applied to all simulated NR responses (solid lines in FIG. 17). This reduces the calculated cosmogenic neutron flux, , from cm-2s-1 down to cm-2s-1 in FIG. 12, for neutrons with kinetic energy greater than 1 MeV.
Subsequently, the calculated cosmogenic gamma-ray flux is reduced from 8.57 10-7cm to be 7.08 10-7cm. The simulated NR contributions from neutrons (red line) and gamma rays (blue line) are separated. It indicates that gamma rays induced nuclear recoils are comparable to that of neutrons in the energy range of 10 to 15 MeV. In addition, the cosmogenic high-energy gamma rays are very penetrating and could undergo photonuclear reaction to create neutrons inside the shield that is close to the detector. Therefore, the cosmogenic high-energy gamma rays are an important source of background to rare event physics experiments.
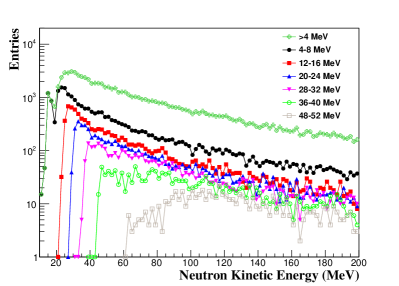
Total 24 nuclear recoil events have been observed (visible energy En4 MeV) using the liquid scintillation detector at Soudan Mine with the live time of 655.1 days. The visible recoil energies range from 4 MeV to 50 MeV which corresponds to neutron energies from 20 MeV up to a few hundred MeV, depending on the scattering angle. The contribution of neutrons with different energies to the range of the measured energy depositions is studied through simulations (see FIG. 18). It shows that 4 to 8 MeV energy depositions are mainly contributed by 20 MeV neutrons. The little peak around 15 MeV is caused by processes in the detector. The results indicate that the energy correlation between recoils and incident neutrons is obvious for low energies. The correlation becomes more obscure as energy rising.
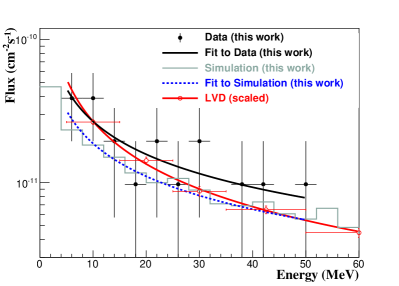
Muon induced fast neutrons underground have been reported by LVD experimentlvd at Gran Sasso depth (3.1 km.w.e). The observed proton recoil spectra is up to 300 MeV, corresponding to neutron energy up to a GeV depending on the scattering angle, with much higher statistics due to a much bigger detector. The measured recoil spectrum is parameterized by a function with neutrons(-1counter-1MeV-1 and . The spectrum and the fitted curve are normalized by a factor of and presented in FIG. 19 in order to do a shape comparison with our results. A similar fitting is also applied to our data with and . The distribution of the Soudan data from this work is more flat than that of Gran Sasso from LVD. This difference is attributed to the difference of the depth between two sites. Note that the simulated nuclear recoil curve in FIG. 18 and 19 takes a normalization factor of 1.21 from the muon measurement (see FIG. 16). Fitted with the same function to the simulation curve gives the parameter and . As can be seen in Fig. 19, the difference between the fitted curve with the measured neutron data and the fitted curve from the adjusted simulation results, using muon data, is about 30%.
We integrate the energy region above the 4 MeV energy threshold, the measured neutron flux is determined to be 2.2310-9cm-2s-1. Considering the 4 MeV energy threshold accounts for neutrons with energy above 20 MeV, the measured neutron flux, 2.2310-9cm-2s-1, corresponds to neutrons with energy greater than 20 MeV. Similarly, the simulated neutron flux, for neutron energy greater than 20 MeV, is determined to be 1.9010-9cm-2s-1.
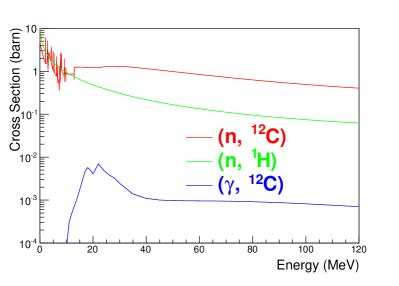
Muon electromagnetic showers produce a large amount of secondary particles which can contribute to nuclear recoils in liquid scintillators. General speaking, neutron elastic/inelastic processes are considered to be the dominated NR interaction channels comparing to muon-nucleus and photo-nuclear interactions. The simulation finds that muon showers contain a factor of 100 more gamma rays than neutrons. Considering this higher intensity and the photonuclear interaction cross-section in liquid scintillators, we evaluate the contribution to nuclear recoil, from these secondary high-energy gamma rays, in the detector. As shown in FIG. 20, gamma rays break 12C nucleus through reaction of 12C( when the energy of gamma ray exceeding 13 MeV. The contribution from 12C is less than 0.1% compared to protons above 10 MeV, while the contribution from those recoils are in the level of less than 1.0% in the NR band, according to the Monte Carlo simulation. The NR events produced through muon-nucleus processes are found to be negligible in the data.
V Discussion and Conclusion
The muons at the Earth’s surface are utilized to calibrate the detector response to high energies. The result is a reasonable approximation by assuming a linear relation between the light output and the energy deposition at high energies. Neutrons at the Earth’s surface are measured using the 12-liter liquid scintillation detector. The discrepancy between the measured data and the simulated result above 20 MeV is within a factor of 2. A full calibration using high energy neutron beam would help in terms of the energy and position calibrations for high energies so that we can confidently identify the sources of issue, either from the detector response itself or from the external input.
Muon and neutron fluxes at Soudan Mine are simulated by taking into account the surface mountain profile and rock density. Since the reality of the rock configuration is more complicated, the simulated results have to be adjusted by the measurement in terms of their absolute fluxes. The lower end of measured visible energy from neutron band is limited by the random noise (4 MeV). Given the quenching effect and the energy transfer from neutron-ion collisions, the measured neutrons should have kinetic energies above 20 MeV according to this 4 MeV threshold. The highest visible energy of 50 MeV in the neutron band accounts for the potential incident neutrons with energy about a few hundred MeV depending on the scattering angle.
The statistical error of the muon measurement is about 1.23% while it is 22.94% on the average for the neutron flux due to the relatively lower intensity at the mine. The dominant systematic uncertainty for muons comes from a 5% variation in total muon rates observed in the experiment. In addition, the energy and position calibration contributed to about 3% uncertainty determined using the Monte Carlo simulation. For neutrons, in addition to the inherited systematics from the parent muons, the systematic uncertainty is mainly from the normalization factor which contributes 30%. The uncertainty, at level of about 6% to the total flux, induced by the quenching factor matrix, is determined by the Monte Carlo simulation. Adding the sources of systematic uncertainties in quadrature, the final muon flux (Eμ 1 GeV) is determined to be ( cm and the measured neutron flux (En 1 MeV) is ( cm. The former is in a good agreement with the previous measurement made by the MINOS far detector minos1 . The latter agrees with the prediction made by Ref. mei reasonably well. Table 2 summarizes a comparison between Ref. mei and this work.
| Sources | Muon flux | Neutron flux | |
|---|---|---|---|
| (cm-2s-1) | (cm-2s-1) | ||
| Eμ 1 GeV | En 1 MeV | En20 MeV | |
| Mei&Hime mei | 2.0 10-7 | 5.8410-9 | 2.510-9 |
| MC (this work) | 1.9910-7 | 5.7210-9 | 1.910-9 |
| Data (this work) | 1.6510-7 | 2.2310-9 | |
As can be seen in Table 2, the Monte Carlo simulation with FLUKA fluka implemented by Mei&Hime mei agrees reasonably well with the Monte Carlo simulation with GEANT4 (GEANT4.9.5.p02 + Shielding module physics list) performed by this work. The difference between two simulations and the measurements made by this work is about 30%, which is mainly due to the variation of rock density in reality. Thus, our measurements provides a benchmark for both FLUKA and GEANT4 simulations.
In summary, we have demonstrated the capability of detecting cosmogenic neutrons with a 12-liter liquid scintillation detector. Although there are only 24 events (En MeV) detected in the NR band in two years, they are well separated from electron recoils. Due to relatively low cost of the whole detector, an array of hundreds of such detectors would be able to collect the sufficient statistics for studying cosmogenic neutrons in the underground laboratory to benchmark Monte Carlo simulation tools.
VI Acknowledgement
The authors wish to thank Fred Gray, Keenan Thomas, Anthony Villano and Priscilla Cushman for their invaluable suggestions and help. We would also like to thank Christina Keller, Angela Chiller, and Wenzhao Wei for careful reading of this manuscript. This work was supported in part by NSF PHY-0758120, PHYS-0919278, PHYS-0758120, PHYS-1242640, DOE grant DE-FG02-10ER46709, the Office of Research at the University of South Dakota and a 2010 research center support by the State of South Dakota. Computations supporting this project were performed on High Performance Computing systems at the University of South Dakota.
References
- (1) V. Trimble, Annual Review of Astronomy and Astrophysics, 25, 425 (1987).
- (2) R. Bernabei et al. (DAMA Collaboration), Riv. N. Cim., 26, 1 (2003).
- (3) Z. Ahmed et al. (CDMS II Collaboration), Science, 327, 1619 (2010).
- (4) C. E. Aalseth et al. (CoGeNT Collaboration), Phys. Rev. Lett., 107, 141301, (2011).
- (5) G. Angloher et al. (CRESST-II Collaboration), Eur. Phys. J. C 72, 1971 (2012).
- (6) Z. Ahmed et al. (CDMS and EDELWEISS Collaborations), Phys. Rev. D 84, 011102 (2011).
- (7) E. Aprile et al. (XENON Collaboration), Phys. Rev. Lett. 109, 181301 (2012).
- (8) D. S. Akerib et al. (LUX collaboration), Phys. Rev. Lett. 112, 091303 (2014); arXiv:1310.8214.
- (9) R. Agnese et al. (SuperCDMS Collaboration), Phys. Rev. Lett. 112 (2014) 241302, arXiv:1402.7137.
- (10) M. Barnabe-Heider et al. (PICASSO), Phys. Lett. B 624, 186 (2005).
- (11) G. J. Alner et al. (UKDMC), Phys. Lett. B 616, 17 (2005).
- (12) V. A. Kudryavtsev (UKDMC), in the Fifth International Workshop on the Identification of Dark Matter, Edinburgh, Scotland, 2004.
- (13) A. Benoit et al. (EDELWEISS Collaboration), Phys. Lett. B 616, 25 (2005).
- (14) T. A. Girard et al., Phys. Lett. B 621, 233 (2005).
- (15) S. Desai et al. (Super-Kamiokande Collaboration), Phys. Rev. D 70, 083523 (2004).
- (16) D.-M. Mei and A. Hime, Phys. Rev. D 73, 053004 (2006).
- (17) Y.-F. Wang, et al., Physical Review D 64, 013012 (2001).
- (18) V. Kudryavtsev, N. Spooner, J. McMillan, Nuclear Instruments and Methods in Physics Research A 505, 688 (2003).
- (19) H. Araujo, V. Kudryavtsev, N. Spooner, T. Sumner, Nuclear Instruments and Methods in Physics Research A 545, 398 (2005).
- (20) V. Kudryavtsev, L. Pandola, V. Tomasello, The European Physical Journal A 36, 171 (2008).
- (21) G. Gorshkov, V. Zyabkin, R. Yakovlev, Soviet Journal of Nuclear Physics, 18, 57 (1974).
- (22) M. Marino, et al., Nuclear Instruments and Methods in Physics Research A 582, 611 (2007).
- (23) H. Araujo, et al., Astroparticle Physics 29, 471 (2008).
- (24) S. Abe, et al., Physical Review C 81, 025807 (2010).
- (25) G. Bellini et al., JINST, 6, 05005 (2011).
- (26) L. Reichhart et. al. Astropart. Physics 47, 67 (2013).
- (27) B. Schmidt et. al., Astropart. Physics 44, 28 (2013).
- (28) M. Aglietta et al, Proc. of the 26th ICRC, Salt Lake City, Vol 2, 1999; arXiv:hep-ex/9905047.
- (29) R. A. Cecil B. D. Anderson and R. Madey, Nucl. Instr. and Meth., 161, 439 (1979).
- (30) R. Batchelor, W. B. Gilboy, J. B. Parker and J. H. Towle, Nucl. Instr. and Meth., 13, 70 (1961).
- (31) V. V. Verbinski, W. R. Burrus, T. A. Love, W. Zobel and N. W. Hill, Nucl. Instr. and Meth. 65, 8 (1968).
- (32) K. Gul, A. A. Naqvi and H. A. Al Juwair, Nucl. Instr. and Meth. A 278, 470 (1989).
- (33) A. Aksoy et. al., Nucl. Instr. and Meth. A 337, 486 (1994).
- (34) N. Nakao et. al., Nucl. Instr. and Meth. A 362, 454 (1995).
- (35) R. E. Textor and V. V. Verbinski, ORNL-4160, Oak Ridge National Laboratory (1968).
- (36) J. K. Dickens, ORNL-6463, Oak Ridge National Laboratory (1988).
- (37) C. Zhang, et. al., Nucl. Instr. and Meth. A 729, 138 (2013).
- (38) J. B. Birks, The Theory and Practice of Scintillation Counting, (Pergamon, New York, 1964).
- (39) S. Agostinelli, et. al., Nucl. Instr. and Meth. A 506, 250 (2003); K. Amako et al., IEEE Transactions on Nuclear Science 53, 270 (2006).
- (40) M. Guan, et. al., http://escholarship.org/uc/item/6jm8g76d.
- (41) http://www.city-data.com/city/Vermillion-South-Dakota.html.
- (42) M. S. Gordon, et. al., IEEE Transactions on Nuclear Science 51, 3427 (2004).
- (43) J. B. Birks and F. A. Black, Proc. Phys. Soc. A 64, 511i (1951).
- (44) G. Bruno, JINST 8, T05004 (2013).
- (45) H. Wan Chan Tseung, J. Kaspar, N. Tolich, Nucl. Instr. and Meth. A 654, 318 (2011).
- (46) http://physics.nist.gov/PhysRefData/Star/Text/ESTAR .html
- (47) http://physics.nist.gov/PhysRefData/Star/Text/PSTAR .html
- (48) http://physics.nist.gov/PhysRefData/Star/Text/ASTAR .html
- (49) P. Adamson et al. (MINOS Collaboration), Phys. Rev. D 73, 072002 (2006).
- (50) D. S. Akerib et al. (CDMS Collaboration), Phys. Rev. Lett. 93, 211301 (2004).
- (51) C. E. Aalseth et al. (CoGeNT Collaboration), Phys. Rev. Lett. 106, 131301 (2011).
- (52) P. Adamson et al. (MINOS Collaboration), Phys. Rev. D 81, 012001 (2010).
- (53) http://srtm.csi.cgiar.org/.
- (54) http://homepages.spa.umn.edu/schubert/far/s2rock/ position.html
- (55) K. Ruddick, Underground Particle Fluxes in the Soudan Mine, Internal Note NuMI-L-210, 1996.
- (56) N. Pastika, Bachelors Thesis, University of Minnesota, 2008.
- (57) M. Horn, Ph.D. thesis, Universität Karlsruhe, 2007.
- (58) V. A. Kudryavtsev, Computer Physics Communications, 180, 339 (2009).
- (59) M. Moszyński, et al., Nucl. Instr. and Meth. A 343, 536 (1994).
- (60) M.B. Chadwick et al., Nucl. Data Sheets 112, 2887 (2011).
- (61) A. Fass´o, A. Ferrari, P.R. Sala, “Electron-photon transport in FLUKA: status”, Proc. of the Monte Carlo 2000 Conference (Lisbon, October 23-26, 2000), A. Kling, F. Barao, M. Nakagawa, L. Tavora, P. Vaz - eds. (Springerverlag, Berlin, 2001), p.159-164; A. Fass´o, A. Ferrari, J. Ranft, P.R. Sala, “FLUKA: Status and Prospective for Hadronic Applications”, Proceedings of the Monte Carlo 2000 Conference (Lisbon, October 23-26, 2000), A.Kling, F.Barao, M.Nakagawa, L.Tavora, P.Vaz - eds., Springer-Verlag Berlin, p.955-960 (2001).