Can xenon in water inhibit ice growth? Molecular dynamics of phase transitions in water–Xe system
Abstract
Motivated by recent experiments showing the promise of noble gases as cryoprotectants, we perform molecular dynamics modeling of phase transitions in water with xenon under cooling. We follow the structure and dynamics of xenon water solution as a function of temperature. Homogeneous nucleation of clathrate hydrate phase is observed and characterized. As the temperature is further reduced we observe hints of dissociation of clathrate due to stronger hydrophobic hydration, pointing towards a possible instability of clathrate at cryogenic temperatures and conversion to an amorphous phase comprised of “xenon + hydration shell” Xe(H2O)21.5 clusters. Simulations of ice–xenon solution interface in equilibrium and during ice growth reveal the effects of xenon on the ice–liquid interface, where adsorbed xenon causes roughening of ice surface but does not preferentially form clathrate. These results provide evidence against the ice-blocker mechanism of xenon cryoprotection.
I Introduction
Ever since the original deciphering of clathrate hydrate structures by Claussen, Pauling, and others, Claussen (1951a); *1951claussenerratum; Stackelberg and Müller (1951); Claussen (1951c); Pauling and Marsh (1952) researchers have been fascinated by the interactions of hydrophobic gases with water producing these beautiful crystal structures. Natural gas hydrates are a potential source of energy Boswell (2009) and problem in fossil fuel transport; Sloan (2003) clathrates could play a role in global climate change Kaiho et al. (1996) and be used in CO2 sequestration. Park et al. (2006) Clathrate hydrates were famously proposed as a molecular explanation of general anaesthesia. Pauling (1961)
Xenon, a noble gas that readily forms a clathrate hydrate, manifests distinct physiological actions despite its chemical inertness. Owing to its strong anesthetic effect, Hecker et al. (2004) xenon is considered to be the best (though expensive) inhalation anesthetic to date and is officially approved for application as such in Germany and Russia. Xenon has an antidepressant effect (presumably due to its anti-NMDA Derwall et al. (2009) action) and is used to treat alcoholism and drug addiction. Kornetov et al. (2002) Xenon shows a protective effect on various organs subject to ischaemia–reperfusion injury Weber et al. (2005); Abraini, David, and Lemaire (2005); Derwall et al. (2009) (presumably due to its anti-NMDA effect and interference with many aspects of intracellular Ca2+ homeostasis Petzelt et al. (2003)).
An important potential application of xenon is its cryoprotective action. Prehoda (1969); Rodin, Isangalin, and Volkov (1984); Shcherbakov, Tel’pukhov, and Nikolaev (2004); Sheleg et al. (2008) In order to understand this phenomenon, the physicochemical basis of interaction of xenon with liquid water, ice and biological molecules must be understood at the microscopic level. The mechanisms that xenon’s antifreeze effect could be ascribed to include:
-
(i)
Trapping of water in clathrate hydrate in competition with ice crystals formation (akin to traditional cryoprotectants such as glycerol and DMSO).
-
(ii)
Vitrification Fahy et al. (2004) of xenon solution.
- (iii)
- (iv)
-
(v)
Protection against protein thermal denaturation. Rodin, Isangalin, and Volkov (1984)
In the present molecular dynamics study we focus on the “nonbiochemical” mechanisms (i–iii) while the interaction of xenon with biological membranes and proteins is left for follow-up studies. First we investigate the structure and properties of homogeneous xenon solution and its behavior under cooling below the freezing temperature of water. We observe the formation of clathrate phase, with a complex dependence on the concentration and temperature of solution, and a signature of another metastable amorphous phase upon deep supercooling. Then we study the process of ice growth in the presence of dissolved xenon, observing preferential adsorption of xenon on the ice surface but no preferential nucleation that could have caused an ice-blocking effect.
II Computational details
II.1 Simulation method and models
For xenon, we used Lennard–Jones interaction parameters Guillot and Guissani (1993) that were previously successfully used to study hydrophobic hydration of xenon by Paschek: Paschek (2004a) , . To simulate water, we used the TIP5P five-site rigid model. Mahoney and Jorgensen (2000) Cross-species interaction parameters were derived using the geometrical mean combination rule. TIP5P was chosen to represent water because it has pronounced directional hydrogen bonding thanks to its lone-pair virtual sites, leading to stronger tetrahedral structuring of water, which is important here because of our interest in the processes of hydrophobic hydration that is crucially dependent on the local ordering of water molecules Paschek (2004a) (especially at low temperatures Paschek (2005)), and crystal formation. The parametrization of the TIP5P model was done over a wide range of temperatures and pressures, Mahoney and Jorgensen (2000) and it correctly reproduces both the anomalous density maximum of water at 4 °C as well as the melting temperature of ice Ih ( = 275 K as observed in the present work and in earlier studies Vega, Sanz, and Abascal (2005); Vrbka and Jungwirth (2006); Wang et al. (2005); Nada and Eerden (2003)). Although the thermodynamically most stable ice polymorph is erroneously predicted by TIP5P to be ice II, Vega, Sanz, and Abascal (2005) and the proton-ordered ice Ih structure has lower predicted free energy than the (correct) disordered ice I, Nada and Eerden (2003) we still believe TIP5P to be the most reliable choice of water model for our purposes.
Molecular dynamics simulations were carried out using the gromacs package. Van Der Spoel et al. (2005) The simulation time step was 2 fs. Coulomb and Lennard-Jones interactions were truncated at a distance of 0.9 nm (as in the original TIP5P parametrization). Long-range Coulomb interactions were calculated using the Particle-Mesh Ewald method, Darden, York, and Pedersen (1993); Ewald (1921) and a standard long-range dispersion correction term was applied. Allen and Tildesley (1991) For liquid systems, preequilibration was done using the Berendsen thermostat, Berendsen et al. (1984) and production runs were performed using the Nosé–Hoover thermostat Nosé (1984); Hoover (1985) with a 0.5 ps time constant and the Nosé–Parrinello–Rahman barostat Parrinello and Rahman (1981); Nosé and Klein (1983) with a 2.0 ps time constant. For two-phase systems, production runs used the velocity rescaling thermostat Bussi, Donadio, and Parrinello (2007) and the Berendsen barostat Berendsen et al. (1984) with a 0.5 ps time constant for both, to accommodate the total energy and volume change during phase transition.
II.2 System preparation and simulation protocols
| (K) | 280 | 270 | 265 | 260 | 255 | 250 |
|---|---|---|---|---|---|---|
| 1% | 80 | 80 | 50 | 100 | 100 | >100 |
| 2% | 50 | 50 | 50 | 100 | 100 | >100 |
| 3% | 30 | 30 | 50 | 100 | 100 | >100 |
| 4% | 30 | 30 | 50 | 100 | 100 | >100 |
| 5% | 30 | 50 | 100 | 100 | 100 | >100 |
Liquid systems were prepared by randomly inserting xenon molecules into a preequilibrated 500-molecule water box to produce a desired xenon concentration of 1, 2, 3, 4, or 5% mol.Xe/mol.H2O (meaning 100, 80, 60, 40, and 20 water molecules per xenon, respectively). The 5% concentration was chosen as the upper boundary since it still, in principle, allows each xenon molecule to have its separate hydration shell (which contains about 20 molecules); at higher concentrations, there would necessarily be insufficient water to solvate each xenon molecule, casting doubt on our treatment of the system as a liquid solution.
The systems were annealed at fixed cell dimensions for a short period (200 ps) starting at a temperature of 600 K and cooling down to the target temperature of 250–280 K. After that, they were replicated to produce supercells (4000 water molecules, 40–200 xenon) and incubated at the target temperature until equilibrium was reached. The corresponding run lengths ranged from 30 to 100+ ns (see Table 1). Such large systems and long simulation times were necessary to collect good statistics for xenon molecules, and because of the long equilibration times at low temperatures due to very slow diffusion. At the lowest temperatures, simulation times even this long sometimes wouldn’t produce full convergence of radial distribution function (RDF) and mean-square displacement (MSD) plots; at the lowest concentration of 1%, though the spatial configurations of xenon atoms were written out as frequently as once every 100 fs (more than sufficient, given the typical timescale of xenon motion of 1 ps, as observed below), RDF plots still contain noticeable statistical noise.
Two-phase solid-liquid equilibrium simulations were performed with a ice Ih slab, since the prism plane of ice grows faster than basal and hence is the most relevant from the viewpoint of both pure physics Cahoon, Maruyama, and Wettlaufer (2006) and biological applications. Pertaya et al. (2007) The size of the slab was nm, and the thickness was 3.07 nm, corresponding to four nonprimitive crystal cells, or eight water molecule bilayers (see figures below); the total number of water molecules in the slab was 3072. Initial coordinates for ice molecules were taken from the work of Buch et al. Buch, Sandler, and Sadlej (1998) The liquid layers were taken approximately twice as thick as the slab (6.1 nm) to accommodate enough xenon molecules and to allow us to study longer-range effects of ice on the structure of the solution. Liquid and solid phases preequilibrated at 275 K were brought in contact and relaxed using steepest descent energy minimization with a maximum force criterion of 100 (kJ/mol)/nm, which was found to be sufficient to remove any bad molecular contacts at the interface while still ensuring that atomic coordinates still correspond well to the 270–275 K temperature of subsequent production runs, thus providing smooth continuation of molecular dynamics.
The results reported herein were mostly produced at a simulated pressure of 1 atm irrespective of xenon concentration in the systems. While xenon clathrate hydrate is stable under these conditions or close (its experimental dissociation pressure value is 2.5 bar at 5 °C, 1.5 bar at 0 °C, and 1 bar at -3.6 °CEwing and Ionescu (1974)), these concentrations are considerably above equilibrium at a pressure of 1 atm, which may create an excessive driving force for clathrate formation. Extrapolation of empirical xenon solubility dataNote (1) to our temperature range suggests that our concentrations should correspond to “equilibrium” (barring formation of solid phases) pressures on the order of tens to few hundred atmospheres, which is, in fact, a much milder driving force than used in most if not all recent MD studies on clathrate formation. We never observed separation of xenon gas phase in our simulations; in contrast, such separation was observed to occur spontaneously in molecular dynamics simulations of methane hydrate at 100 MPa; Nada (2006) note that the dissociation pressure of methane hydrate is only 5 MPa, and the model system was smaller than ours (1472 water molecules), although the gas concentration was higher (256 molecules, or 17% mol.Me/mol.H2O). Further, our tests on two-phase systems at 10 atm did not produce any noticeable change in the equilibrium characteristics that would suggest the need for computationally expensive pressure dependence studies, and the decomposition temperature of xenon clathrate hydrate did not depend on the concentration (see discussion below). In summary, this leads us to believe that this choice of simulation conditions does not significantly affect the quality of our results (and, in fact, allows us to draw additional important conclusions). Physically, this corresponds to the approximation that the pressure dependence of the balance between gas-phase and dissolved xenon molecules, which determines the concentration of xenon in solution, is primarily governed by the change in the chemical potential in the gas phase, while the structure and thermodynamics of the dissolved phase are, to a reasonable degree, unaffected by pressure on the relevant magnitude scale.
III Results
III.1 Liquid-phase simulations
To study the effects of xenon on the freezing of water, we performed simulations of five model systems with different xenon concentration at the temperatures of 280, 270, 265, 260, 255, and 250 K (production run durations are listed in Table 1) . The initial motivation had been to study the dependence of xenon-xenon interactions, as manifested in radial distribution function (RDF) plots, and xenon diffusion rate determined from the slope of plots of mean square displacement (MSD) over time, on the temperature and concentration of xenon in water solution below the freezing point.

III.1.1 Structure and dynamics of xenon solution
Figure 1 shows the plots of Xe–Xe RDF and Xe MSD time dependence for the concentration range studied in the present work at a temperature of 280 K. It can be seen that the structure of all five systems is identical to a good precision (the corresponding Xe–O RDF are also indistinguishable and hence not shown). By inspecting the structures, we observe that the first three peaks in the RDF correspond to the following three cases of relative position of xenon molecules:
-
1.
contact solute pair (CSP): direct contact of xenon molecules (hydrophobic association in a common hydration shell; this peak was previously shown to be enhanced with increasing temperature Paschek (2004a))—the maximum of the peak roughly corresponds to twice the radius of xenon atom (0.4 nm);
-
2.
solvent-separated solute pair (SSSP): face-sharing of water cages containing two xenon molecules (water molecules “sandwiched” between xenon molecules)—the maximum corresponds to the clathrate hydrate structure (see below);
-
3.
contact of water cages: hydration shells of the two xenon molecules have no common molecules; a hydrogen bond connects a vertex of one with a vertex of the other—like, for example, the two 512 cages in the clathrate unit cell. Geometrically, this corresponds to [1.1 nm from Xe-Xe RDF] [0.76 nm from Xe–O RDF] + [0.27 nm from O–O RDF in pristine water]. We propose the term contact cluster pair (CCP) to describe this configuration.
However, the dynamics of the systems shows a more complex two-timescale behavior. The first part of the MSD time dependence is completely identical for all systems, while the second part demonstrates a slow-down of xenon diffusion with increasing concentration. This indicates that there two modes of xenon atom motion in the solution:
-
1.
fast confined oscillatory motion of xenon inside the hydration cage with a characteristic time of about 1 ps and a squared amplitude of about (0.112 nm)2, showing no visible dependence on the structure of the medium surrounding the hydration shell, and
-
2.
slow drift of the cluster (xenon molecule plus its hydration shell) as a whole in the surrounding solution with occasional hopping of xenon from shell to shell (see Movie S1Note (2)), on the timescale of over 1 ps.
The dependence of the second type of motion on the concentration can be attributed to their collisions decreasing the effective “mean free path”, or by formation of more massive cluster aggregates (potential clathrate hydrate nuclei).

III.1.2 Cooling of xenon solution
At temperatures of 270 K and below, in systems with highest xenon concentrations, a phase transition was observed, leading to a structure radically different from liquid solution. Figure 2 shows the RDF (a) and MSD (b) plots for the 5% mol.Xe/mol.H2O system at 270 K over five sequential 10-ns simulation intervals. It can be seen that during the initial 20 ns, the system was in a liquid state same as above: the RDF peaks have the same positions; the suppression of the leftmost CSP peak compared to 280 K is a manifestation of the hydrophobic dissociation with decreasing temperature; it results from the negative entropy of hydration, Paschek (2004a) which makes it favorable for water molecules at low temperatures to become a part of a hydration shell, forcing the neighboring xenon molecules apart to increase the “surface area” of hydration. The dynamics during the first 20 ns also corresponds to that seen in Figure 1, with fast motion on a 1 ps time scale with a (0.122 nm)2 squared amplitude and a slower mode over longer time scales, but with a slope smaller than at 280 K, obviously, due to the lower temperature.
However, after the initial 20 ns, the system underwent an abrupt phase transition, manifesting itself both in the structure and dynamics of the system. In the RDF plot (Figure 1(a)), it can be seen that the height of the first peak dropped sharply (below 1, indicating effective repulsion of xenon molecules), while the second peak became much more intense and shifted slightly to the left; the third peak moved to the right, and some previously unseen ordering appeared at larger distances.
To analyze the changes in the system we calculated the diffusion coefficient every 20 ps for each atom using 200-ps MSD fits. We then computed the running average over 100 consecutive values to smoothen the fluctuations. The results are plotted in Figure 2(c). The density and contour maps in the background represent the distribution of atomic mobilities over time. The colored solid lines show the trajectories of a representative random sample of 10 atoms. It can be seen that the system starts in a relatively homogeneous state with most atoms having cm2/s but after about 15 ns a number of them make a transition to a state with an order-of-magnitude lower mobility, cm2/s. The left and right histograms in Figure 2(a) further illustrate the qualitative changes in atomic mobility distributions before this event and at the end of our MD trajectory, with the striking bimodal distribution seen in the right chart.
To better understand the nature of the phase transition we visualized the trajectory coloring the atoms according to their instantaneous diffusion coefficient. In Movie S2Note (2), atoms having a diffusion coefficient lower than an arbitrary cutoff shown by the dashed line in Figure 2(c) are highlighted in green. In the first ns of the trajectory, two events of short-lived cluster formation are observed. These are seen in Figure 2(c) as two small “chunks” below the dashed line on the left. This suggests that our conditions are very close to reversibility. Then, after 15 ns, a supercritical cluster forms and continues to grow, followed shortly by a second one, until the end of the run. The final structure of the two crystallites, shown close-up in Figure 2(d), visibly corresponds to the cubic sI clathrate lattice of xenon hydrate (Movie S2Note (2)), and agrees well with the experimental lattice constant value of 1.182 nm. Even though a strict assignment of crystal structure is ill-posed for such a small cluster, and clathrate nucleation may involve “amorphous” clathrate-like precursors,Jacobson, Hujo, and Molinero (2010) the RDF for ideal sI lattice (Figure 2(a), dashed line, with Gaussian broadening applied to match the peak height) clearly shows that the trends are consistent with clathrate formation. In this context, the “migration” of xenon molecules from the first RDF peak (CSP) to the second (SSSP) is a result of all guest molecules in the clathrate hydrate sharing cage walls with their neighbors (no immediate xenon–xenon contacts). The shift of the third (CCP) peak to the right may be due to the fact that the T-cage in sI clathrate hydrate (tetrakaidecahedron—62512) is actually somewhat larger than the dodecahedral cage, which is the preferred shape of hydration shell in the liquid state (as indicated by, e.g., NMR studies of xenon clathrate hydrate growth; Pietrass et al. (1995) integration of the first peak of Xe–O RDF [not shown] in the liquid systems also produces an average number of molecules in the hydration shell of 21.5, consistent with the predominance of dodecahedral cages and in contrast to the 23.0 value of ideal clathrate hydrate that has 8 xenon molecules per 2 512 and 6 62512 cages in the unit cell).
It should be noted that, although only a minor fraction of xenon molecules get converted to the clathrate phase, the stability of crystalline structure with respect to thermal motion of atoms results in the fact that this structure is very markedly seen in the RDF. At the same time, no detectable changes are observed in the water O–O nor Xe–O RDF. This is understandable as only a small fraction of water converts into clathrate, and even in solution, Xe is always surrounded by a polyhedral cage of water molecules. As for the diffusion rate of xenon, the quantitative differences are much less pronounced because of the low fraction of encaged xenon molecules, but the transition is also similarly sharp, and the parameters of the system reached the new equilibrium almost immediately (on the order of 1 ns).
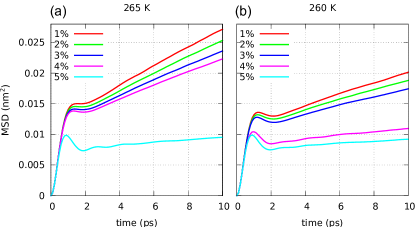
The change in the dynamical characteristics of the systems upon clathrate hydrate formation is more clearly seen in Figure 3, where MSD plots are shown for different system compositions at the temperatures of (a) 265 K and (b) 260 K, for which the transition from the liquid-like to clathrate state is the most pronounced (as demonstrated by the relative height of the second RDF peaks in Figure 4). It can be seen that at 265 K, only in the 5% mol.Xe/mol.H2O system clathrate hydrate formation did occur, while at 260 K, it formed in both the 5% and the 4% systems. The following observations can be made regarding the dynamics of xenon in the systems:
In the “fast” part of the MSD curves, there are virtually no differences, meaning that a xenon atom inside its hydration shell is completely unaffected by the environment outside the water cage. Upon formation of the crystalline phase, the amplitude of this oscillation decreases from (0.122 nm)2 at 280 K (Figure 2) to (0.114 nm)2 at 270 K and further down to (0.105–0.100 nm)2 at even lower temperatures, where the number of xenon molecules in the clathrate phase is larger, and hence, their statistical contribution is greater. This reduction is probably linked to the greater rigidity of the clathrate lattice compared to liquid water, which prevents the hydration shell from deformations that could accommodate larger xenon displacements (xenon molecules “bounce off” cage walls without deforming them).
In the “slow” part, the slope of MSD curves is substantially decreased compared to the liquid phase. In the first approximation, this decrease can be considered proportional to the fraction of xenon in the clathrate phase, since the motion of the latter is that of the crystallite as a whole—orders of magnitude slower (at least, in the absence of vitrification of solution). For systems where no clathrate formed, extrapolation of the “slow” parts to results in almost similar values of (0.105–0.110 nm)2, which is close to the above-reported amplitude of xenon molecule motion in the cages of clathrate hydrate.
At low temperatures, traces of fast motion can be seen against the background of the slow drift. These indicate the former indeed has the character of oscillation. The period of these oscillations in the crystalline phase is about 2.0 ps; in the liquid phase, it is somewhat greater—about 2.2 ps—which is probably again linked to the greater flexibility of the hydrogen bond network in the liquid compared to the clathrate.
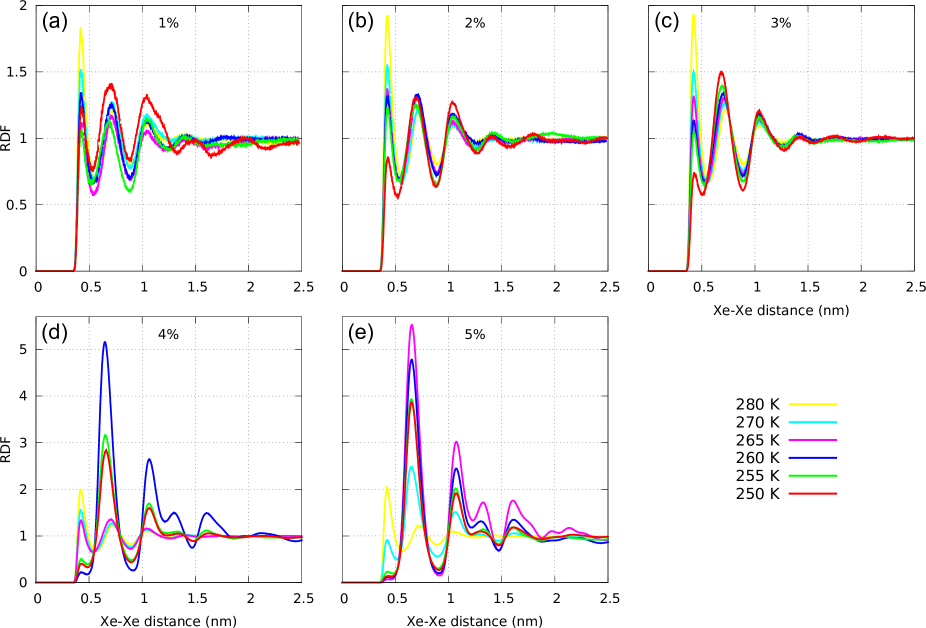
As seen in Figure 4, crystalline clathrate hydrate formation is only observed in the most concentrated 5% (270 K and below) and 4% mol.Xe/mol.H2O (260 K and below) systems, while at lower concentrations, no hints of crystalline phase are seen in the RDF (except maybe for a small increase of second peak intensity for the 3% system at 255 and 250 K; visual inspection revealed some signs of emerging ordering but no well-identifiable crystallites). However, it is not entirely clear if this absence of clathrate hydrate is due to the concentration being insufficient for homogeneous nucleation, or simply because of kinetic restrictions not allowing for a detectable amount of crystalline phase to grow over the limited duration of the simulation.
As for the 1–3% systems that remain liquid over the entire temperature range, a steady monotonous behavior is observed in RDF as a function of the decreasing temperature. The intensity of the first CSP peak gradually decreases, while the SSSP and CCP peaks grow. This is a manifestation of the hydrophobic dissociation, as described above. In addition, the RDF minima become deeper, and higher-order maxima (4th, 5th, and 6th order, up to 2.2 nm) become clearly distinguishable. This pronounced structuring of the systems without any detectable crystallinity, as well as the associated collective dynamics in these and similar systems, deserve separate attention outside the boundaries of this work.
It is also interesting to note that in the 4% and 5% systems, there is actually less clathrate hydrate formed in the end of simulations at temperatures below the onset of homogeneous nucleation (255 and 250 K for 4%, 260 K and below for 5%, see Figure 4). While this could possibly be explained by slower diffusion rate not allowing enough xenon molecules to drift towards the growing nuclei of clathrate phase to reach its equilibrium mass during the limited time of simulation, this explanation appears unlikely since we did assure full convergence in the RDF for these systems. We therefore find it more plausible that this effect is a consequence of low-temperature hydrophobic dissociation: there exists an optimal temperature at which xenon clathrate hydrate is most stable (e.g. 265 K for the 5% system, Figure 4(e)), above which it becomes less stable due to thermal decomposition, and below which it is “pulled apart” as a result of entropy-driven effective repulsion of xenon molecules (see the RDF plots for the 1–3% systems, Figure 4(a–c)). Although the entropy of the molecules that compose a crystal is much lower than in the liquid state, there is only 5.75 water molecules per each xenon in the clathrate versus an average of 21.5 in the hydration shell of xenon in the liquid phase, meaning that despite that the water molecules in the latter case are thermodynamically of “poorer quality” (higher entropy—though, importantly, still lower than in bulk water), CCP configuration could still be more favorable because of the sheer quantity of low-entropy water molecules. To put it in other terms, the hydrophobic solubility of xenon in low-temperature water increases with cooling faster than the thermal stability of clathrate hydrate.
The fact that in the 5% mol.Xe/mol.H2O system at 270 K, the first two nucleation events were unsuccessful and it took about 23 ns for the first stable crystal nuclei to form, as well as the low amount of xenon that converted to the clathrate phase, suggests that these system parameters (composition and temperature) are exceptionally close to the balance between clathrate growth and dissociation. In all other cases, clathrate hydrate formation proceeded right from the start of the simulation—even at the preequilibration stage,—and the growth of the crystal occurred very rapidly, despite the fact that even the highest xenon concentrations used in the present work are still several times smaller than that in pure clathrate hydrate ( 5% versus 17.4% mol.Xe/mol.H2O, respectively). It is also important that clathrate nucleation proceeds much faster than the homogeneous nucleation of ice (which was never observed in our simulations, and is generally a notoriously difficult process to capture with molecular dynamics simulations Matsumoto, Saito, and Ohmine (2002)). This is because xenon molecules with their well-defined hydration shells enforce a preferential orientation for the surrounding water molecules via sandwiching Walsh et al. (2009) and “inverse solvation” Matsumoto (2010), which radically decreases the variety of available equiprobable amorphous local structures that allows pristine water to stay in a supercooled state for macroscopic periods of time.
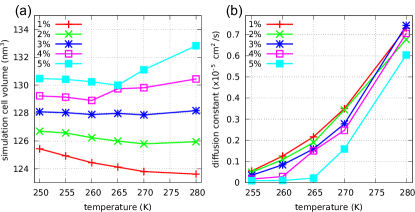
Finally, Figure 5 shows the plots of xenon diffusion coefficients (a) and specific volume (b) of the systems as a function of the temperature (not shown for = 250 K because the duration of our simulations did not allow us to reach full convergence of this parameter). In both plots, clathrate formation manifests itself in the form of discontinuities at 5%/265(270) K and 4%/260 K; in particular, the conversion of xenon to the clathrate phase is associated with an appreciable volume decrease (a point to be recalled below). Another interesting observation is that, even though water shows anomalous thermal behavior of density in the studied range of temperatures (density decreases with temperature), the presence of xenon appears to oppose this tendency, and for the 3% system, the volume is nearly constant throughout the entire 250–280 K range, while at higher concentrations, when a large fraction of water molecules are part of hydration shells (above the onset of clathrate formation), this effect even dominates over the liquid water behavior. While the practical consequences of this effect are unclear due to the unusual system composition, it is a further interesting manifestation of the negative entropy change associated with hydrophobic hydration. Paschek (2004a, b)
III.2 Two-phase simulations
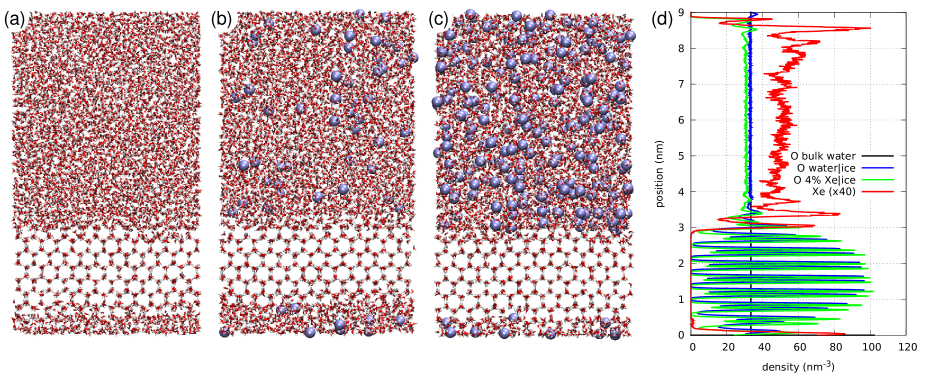
Two-phase simulations of ice crystals in xenon-rich water solution were undertaken in order to investigate how xenon affects the growth of ice, and to assess how our above findings relate to heterogeneous crystal growth. The simulations were carried out for three systems with ice slabs embedded in (i) neat water, (ii) 1% mol.Xe/mol.H2O liquid solution (low xenon concentration) and (iii) 4% mol.Xe/mol.H2O (high xenon concentration). The latter concentration was chosen so as to ensure that no clathrate hydrate forms at our target temperatures (above the homogeneous nucleation point of 260 K—Figures 4(d) and 5). Snapshots of the systems are shown in Figure 6.
III.2.1 Equilibrium structure of the interface
Equilibrium coexistence temperature values were obtained via temperature bracketing. Growth/melting of ice was monitored by the change in the potential energy. The resulting values of were: 275 K for pristine water; 274 K for the 1% Xe system; 271 K for the 4% Xe system. It can be seen that the deviation of from 275 K is directly proportional to the amount of xenon in the liquid phase, i.e., conforming to the normal cryoscopic law. Curiously, this suggests that our homogeneous 5%/270 K run (Figure 2) was close to equilibrium with both clathrate and ice. Increasing the pressure to 10 atm did not shift the equilibrium temperatures, confirming the physical soundness of our choice of atm for the bulk of our calculations reported above.
Visual inspection showed that the presence of xenon did affect the structure of ice surface. In pure water runs, the surface of ice slab was generally smooth down to the length of one unit cell in the corresponding dimension. However, the heavy xenon molecules were frequently seen to plunge into the surface layers of the slab, sometimes up to two crystal cells deep. This created a roughened surface with disordered liquid-like local structure of water molecules. The residence times of xenon molecules were up to about several ns, after which they would be ejected back into the surrounding solution, and the protrusions would be healed, restoring the perfect crystalline structure of ice.
Figure 6(d) shows Xe and O atom density profiles for the ice/4% mol.Xe/mol.H2O system at its equilibrium temperature of 271 K (the xenon plot has been multiplied by 40 to compensate for the difference in total atom number to facilitate visual comparison). The abscissa corresponds to the distance along the z direction perpendicular to the ice slab surface. The statistics were accumulated over 10 ns (1000 configurations).
It can be seen that water molecules are in a crystalline state at 0–3 nm (forming pairs of crystal planes), are uniformly distributed in the liquid region of the system (4–8 nm), and form quasi-liquid (or quasi-crystalline) interface layers at 3–4 nm and 8–9 nm. The distribution of xenon is also more or less uniform—to the extent of confidence allowed by the poorer statistical sampling—in the liquid layer (absence of clathrate hydrate was confirmed visually and by RDF plots), and exhibits 3 or 4 pronounced peaks in the interface layer with intensities of up to 1.5–2 times that in the liquid phase. The Xe peak closest to the surface is located between two O crystal plane peaks, and the liquid-phase peaks of Xe and O coincide. Inspection of trajectories reveals that the ice/solution interface contains some adsorbed xenon molecules that stay there for a duration of about 3–5 ns and then drift away back into the liquid part of the system; at any instant, only on the order of 10 molecules are adsorbed on the 31 nm2 surface of the simulation slab cell—a concentration that is insufficient to cause clathrate hydrate nucleation, even though it is enough to depress the melting temperature by 4°.
The origin of Xe concentration peaks can be understood basing on the difference between ice and liquid water densities. Since the density of interfacial water is lower than the bulk value, it can more easily accommodate guest xenon molecules, similarly to what has been previously observed in simulations of hydrophobic hydration in deeply supercooled water. Paschek (2005) On the other hand, formation of xenon clathrate hydrate is associated with the opposite sign of density change (densification), which suggests that nucleation of xenon clathrate hydrate should not be more favorable on the ice/water interface than in the bulk Li et al. (2009) (see also the next section).
Finally, comparison of O atom density profiles in Figure 6(d) for the cases of pristine water and water with xenon shows an unperturbed structure, except for a slight enhancement of the third peak in the quasi-liquid layer, nm (the differences in the topmost part of the plot are artifacts coming from the different periodic boundary conditions). This peak should be attributed to water molecules that solvate xenon adsorbed at the interface.
The present findings for the prism face of ice can, with reasonable caution, be expected to generalize to other ice surfaces, e.g., basal. Because of the lower relative density of ice, the quasi-liquid layer at its surface is expanded, and provides a favorable environment for relatively large xenon molecules, thus causing them to preferentially adsorb in this layer. However, additional simulations will be needed to fully confirm this.
III.2.2 Ice growth in the presence of xenon
After equilibration at the corresponding values, the temperature of our systems was decreased to 270 K for 1% and to 268 K for 4% mol.Xe/mol.H2O. Although the computational expense of the simulations prevented us from doing an extensive systematic investigation, the following behavior was observed:
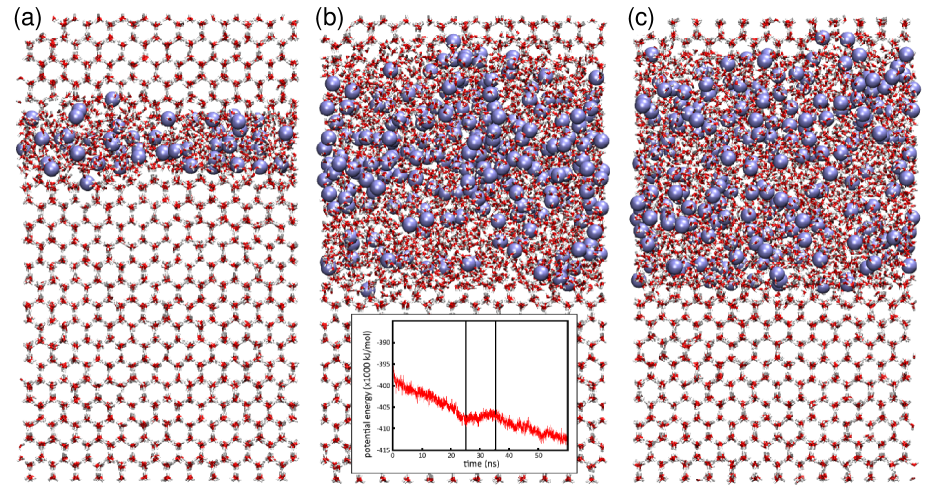
1%, 270 K. The ice slab smoothly grows, expelling xenon into the remaining liquid region. The growth completes in a state when most of the water is in the form of ice, with a thin amorphous (no crystalline clathrate hydrate) layer containing all the xenon (Figure 7(a), ns).
4%, 270 K, 1 atm. After 25 ns of ice front propagation, the concentration of xenon in the liquid layer built up sufficiently to result in the nucleation of a clathrate hydrate seed (10 ns), which then proceeded to grow forming a crystal parallel to the ice slab surface. The resulting structure ( ns) is shown in Figure 7(b), and the corresponding potential energy plot is shown in the inset. The clathrate hydrate appears as a relative increase of xenon molecule density slightly above the middle of the liquid layer; it is more clearly visible in the molecular dynamics trajectory available in Movie S3.Note (2) It must be stressed that nucleation started in the middle of the liquid layer and not at the surface of the ice slab, consistent with our reasoning above based on the density of the interfacial quasi-liquid layer and of clathrate hydrate. Ice surface propagation stopped at 45 ns, although the potential energy continued to decrease, most likely, because of clathrate growth or rearrangement.
4%, 270 K, 10 atm. The growth rate of ice was similar to the 1 atm simulation, and the growth stopped at 45 ns with the same ice slab thickness. However, no detectable clathrate hydrate fragments were formed even after ns (Figure 7(c); the distribution of xenon in the liquid layer is uniform). This behavior appears to be in disagreement with what should be expected basing on the negative volume change upon clathrate hydrate formation, but may be simply due to the stochastic nature of crystal nucleation. Statistics over multiple freezing trajectories would be needed to clarify this issue.
In summary, we have observed that during ice growth in xenon water solution, xenon alters the structure of ice surface making it rougher than in pure water, and that this effect reduces the melting temperature of ice in agreement with the cryoscopic law. In all three systems, the final volume containing the xenon (as estimated by measuring the advancement of ice surface) corresponds to concentrations of about 6–6.5% which is consistent with the simulation temperatures of 5–7 K below ice freezing. However, no clathrate hydrate is formed on the growing prismatic ice surface; instead, clathrate hydrate forms via homogeneous nucleation when the concentration of xenon in the bulk liquid reaches a threshold value.
IV Discussion
First, we would like to concisely recapitulate our key findings.
(i) Hydration of xenon proceeds via the formation of clusters: a xenon molecule plus its hydration shell (21.5 water molecules on average). The cluster experiences diffusion as a whole, and the xenon molecule in its center librates with a characteristic time of 2.2 ps and an amplitude (squared) of (0.122 nm)2, with occasional hopping from cage to cage. In the crystalline clathrate hydrate phase, the period and amplitude are slightly smaller (2.0 ps, (0.1 nm)2).
(ii) With increasing xenon concentration, the diffusion rate slightly decreases. Possible explanations include (1) collisions of clusters and (2) aggregation of clusters in potential clathrate hydrate nuclei (similar to methane “blobs” observed in a recent study Jacobson, Hujo, and Molinero (2010)).
(iii) Homogeneous nucleation of crystalline clathrate hydrate is observed already at concentrations several times smaller than in bulk hydrate. The structure of the phase seen in simulations agrees well with the sI structure typical for real xenon hydrate, and the lattice parameter is in good agreement with the experimental figure of 1.182 nm.
(iv) Formation of crystalline clathrate hydrate in all cases is observed to happen radically faster than homogeneous nucleation of ice crystals. The excess (compared to the equilibrium concentration of dissolved gas at the temperature of simulation) is released via clathrate growth and not via gas bubble formation.
(v) Upon clathrate formation, the volume of the systems experiences a sharp drop.
(vi) At the simulation pressure of 1 atm, heating the clathrate-containing systems shows no strong dependence of clathrate hydrate decomposition temperature (between 275 and 280 K) on the concentration of xenon in the surrounding solution.
(vii) Although xenon does accumulate in the low-density interfacial quasi-liquid layer on the surface of ice, clathrate hydrate formation is not observed at ice surface in the equilibrium. However, xenon does affect the morphology of the surface, making it more rough, and decreasing the melting temperature of ice according to the cryoscopic law.
(viii) Under nonequilibrium conditions, the presence of xenon in the interfacial layer does not prevent ice growth. Clathrate hydrate is formed when the concentration of xenon in the not-frozen-yet part of the system builds up sufficiently for homogeneous nucleation to occur, and this happens in the thickness of the liquid layer.
(ix) From (1) the independence of clathrate hydrate melting temperature (unlike nucleation temperature) of the concentration of xenon, (2) the experimentally observed dependence of decomposition pressure on the temperature,Ewing and Ionescu (1974) and (3) localization of clathrate hydrate nucleation not in the low-density/high-concentration surface layer but in the bulk of the liquid, we conclude that the main thermodynamical driving force behind clathrate hydrate stability is the negative volume change upon addition of solvated molecules to the clathrate crystal (via the associated negative enthalpy change).
(x) At temperatures below 255–250 K, the viscosity of xenon solution becomes so high that it has been impossible to reach full convergence in the dynamic properties of the systems during our long (100 ns) simulation runs, implying possible vitrification.
(xi) The interaction of xenon molecules in solution can be viewed as the balance between hydrophobic attraction of xenon molecules and entropy-driven “hydrational” interaction between xenon and water. The latter pulls apart contact (and even solvent-separated, including those forming the clathrate lattice) pairs of xenon molecules. With decreasing temperature, its relative role increases, resulting in an exotic amorphous metastable structure with a short-range order distance of at least 2 nm resembling an “atomic gel”.
Supersaturation of water with xenon can produce a phase that is metastable with respect to both homogeneous nucleation of xenon clathrate hydrate and the nucleation of ice. Although it is poorly understood how this phase could be realized in practice, the high solubility of xenon in lipid membranes Yamamoto et al. (2012); Booker and Sum (2013) could produce such an effect during cooling, when the surplus xenon dissolved in the membranes gets ejected into the surrounding water via an entropy-driven mechanism similar to hydrophobic dissociation. Quantitative assessment of this effect requires separate confirmation by simulations and experiment. If true, this may be one of the explanations behind the protective effect of xenon observed experimentally on biological samples. Sheleg et al. (2008)
At the same time, the present study provides evidence against the possibility of “ice-blocking” behavior of xenon, where clathrate hydrate could form on the surface of ice, stopping its growth. This is because xenon hydrate formation favors higher densities, while the density of quasi-liquid layer on the surface of ice is lower than the density of bulk water. However, this also suggests that other hydrophobic gases might be more useful in this respect (for example, recent molecular dynamics simulations observed nucleation of methane clathrate hydrate at ice–water interfaces Pirzadeh and Kusalik (2013)).
Finally, any cryoprotective effects specific to the interaction of xenon with biological objects, especially those containing large hydrophobic regions (proteins, lipid membranes), still remain to be investigated. Given xenon’s drastic effects on living organisms, including anaesthesia and even drug addiction therapy, such interactions may turn out crucial for the explanation of the cryoprotective effects of xenon. We hope that the physicochemical findings of the present work may assist future investigations of the underlying causes of the biological action of xenon.
V Conclusions
In the present work, we have carried out molecular dynamics simulations of xenon in water under both homogeneous and heterogeneous (i.e., on ice surface) conditions. We observed the homogeneous nucleation of xenon clathrate hydrate, as well as an exotic metastable amorphous phase at high xenon concentrations and low temperatures. Despite the fact that xenon adsorbs at the ice surface preferentially to being dissolved in the liquid water, no clathrate hydrate nucleation is seen at the interface. We trace this result to the lower density of the interfacial quasi-liquid layer, while clathrate hydrate formation is associated with an increase of density.
Together with the observed independence of xenon clathrate hydrate decomposition temperature on the concentration, on one hand, and the known temperature dependence of its dissociation pressure, on the other, this leads to the conclusion that the stability of the hydrate is governed not by the concentration of xenon in the liquid phase, but by the interplay of thermal instability of the clathrate lattice, the entropy-driven hydrophobic association/dissociation force, and the negative contribution to the enthalpy resulting from the negative change in volume associated with xenon molecules going from the liquid to clathrate phase. Our results also hint at an optimal pressure-temperature combination, above which the clathrate dissociates due to thermal motion (translational entropy of xenon molecules, hydrophobic association into contact solute pairs), and below which it is “pulled apart” by hydrophobic dissociation forces (entropy difference between “bulk” water molecules and those in xenon hydration shells).
These findings are interesting both for understanding the effects of xenon on the freezing of water, as well as the broader aspects of clathrate hydrate formation mechanisms. Our study lays the groundwork for future investigations of the cryobiological effects of xenon.
References
- Claussen (1951a) W. F. Claussen, J. Chem. Phys. 19, 259 (1951a).
- Claussen (1951b) W. F. Claussen, J. Chem. Phys. 19, 662 (1951b).
- Stackelberg and Müller (1951) M. von Stackelberg and H. R. Müller, J. Chem. Phys. 19, 1319 (1951).
- Claussen (1951c) W. F. Claussen, J. Chem. Phys. 19, 1425 (1951c).
- Pauling and Marsh (1952) L. Pauling and R. E. Marsh, Proc. Natl. Acad. Sci. USA 38, 112 (1952).
- Boswell (2009) R. Boswell, Science 325, 957 (2009).
- Sloan (2003) E. D. Sloan, Nature 426, 353 (2003).
- Kaiho et al. (1996) K. Kaiho, T. Arinobu, R. Ishiwatari, H. E. G. Morgans, H. Okada, N. Takeda, K. Tazaki, G. Zhou, Y. Kajiwara, R. Matsumoto, A. Hirai, N. Niitsuma, and H. Wada, Paleoceanography 11, 447–465 (1996).
- Park et al. (2006) Y. Park, D.-Y. Kim, J.-W. Lee, D.-G. Huh, K.-P. Park, J. Lee, and H. Lee, Proc. Natl. Acad. Sci. U.S.A. 103, 12690 (2006).
- Pauling (1961) L. Pauling, Science 134, 15 (1961).
- Hecker et al. (2004) K. Hecker, J. H. Baumert, N. Horn, and R. Rossaint, Minerva Anestesiol. 70, 255 (2004).
- Derwall et al. (2009) M. Derwall, M. Coburn, S. Rex, M. Hein, R. Rossaint, and M. Fries, Minerva Anestesiol. 75, 37 (2009).
- Kornetov et al. (2002) N. A. Kornetov, M. N. Shpisman, S. A. Naumov, S. M. Vovk, A. V. Naumov, A. V. Lukinov, and I. A. Khlusov, Application of medicinal xenon narcosis in complex therapy of abstinence syndrome in opiate addiction (in Russian) (Meditsina, 2002).
- Weber et al. (2005) N. C. Weber, O. Toma, J. I. Wolter, D. Obal, J. Müllenheim, B. Preckel, and W. Schlack, Br. J. Pharmacol. 144, 123 (2005).
- Abraini, David, and Lemaire (2005) J. H. Abraini, H. N. David, and M. Lemaire, Ann. N. Y. Acad. Sci. 1053, 289 (2005).
- Petzelt et al. (2003) C. Petzelt, P. Blom, W. Schmehl, J. Müller, and W. J. Kox, Life Sci. 72, 1909 (2003).
- Prehoda (1969) R. W. Prehoda, in Suspended Animation (Chilton Book Company, 1969) pp. 81–86.
- Rodin, Isangalin, and Volkov (1984) V. V. Rodin, F. S. Isangalin, and V. V. A. Volkov, Cryobiology & Cryo-Medicine 14, 3–7 (1984).
- Shcherbakov, Tel’pukhov, and Nikolaev (2004) P. V. Shcherbakov, V. I. Tel’pukhov, and A. V. Nikolaev, “Method for organs and tissues cryoconservation in situ”, RU patent 2268590 C1 (15 June 2004).
- Sheleg et al. (2008) S. Sheleg, H. Hixon, B. Cohen, D. Lowry, and M. Nedzved, Int. J. Clin. Exp. Pathol. 1, 440 (2008).
- Fahy et al. (2004) G. M. Fahy, B. Wowk, J. Wu, J. Phan, C. Rasch, A. Chang, and E. Zendejas, Cryobiology 48, 157 (2004).
- Pertaya et al. (2007) N. Pertaya, Y. Celik, C. L. DiPrinzio, J. S. Wettlaufer, P. L. Davies, and I. Braslavsky, J. Phys.: Condens. Matter 19, 412101 (2007).
- Howard et al. (2011) E. I. Howard, M. P. Blakeley, M. Haertlein, I. P. Haertlein, A. Mitschler, S. J. Fisher, A. C. Siah, A. G. Salvay, A. Popov, C. M. Dieckmann, T. Petrova, and A. Podjarny, J. Mol. Recognit. 24, 724 (2011).
- Barrer and Ruzicka (1962) R. M. Barrer and D. J. Ruzicka, Trans. Faraday Soc. 58, 2262 (1962).
- Yamamoto et al. (2012) E. Yamamoto, T. Akimoto, H. Shimizu, Y. Hirano, M. Yasui, and K. Yasuoka, J. Phys. Chem. B 116, 8989 (2012).
- Booker and Sum (2013) R. D. Booker and A. K. Sum, Biochim. Biophys. Acta - Biomembranes 1828, 1347 (2013).
- Guillot and Guissani (1993) B. Guillot and Y. Guissani, J. Chem. Phys. 99, 8075 (1993).
- Paschek (2004a) D. Paschek, J. Chem. Phys. 120, 6674 (2004a).
- Mahoney and Jorgensen (2000) M. W. Mahoney and W. L. Jorgensen, J. Chem. Phys. 112, 8910 (2000).
- Paschek (2005) D. Paschek, Phys. Rev. Lett. 94, 217802 (2005).
- Vega, Sanz, and Abascal (2005) C. Vega, E. Sanz, and J. L. F. Abascal, J. Chem. Phys. 122, 114507 (2005).
- Vrbka and Jungwirth (2006) L. Vrbka and P. Jungwirth, J. Phys. Chem. B 110, 18126 (2006).
- Wang et al. (2005) J. Wang, S. Yoo, J. Bai, J. R. Morris, and X. C. Zeng, J. Chem. Phys. 123, 036101 (2005).
- Nada and Eerden (2003) H. Nada and J. P. J. M. van der Eerden, J. Chem. Phys. 118, 7401 (2003).
- Van Der Spoel et al. (2005) D. van der Spoel, E. Lindahl, B. Hess, G. Groenhof, A. E. Mark, and H. J. C. Berendsen, J. Comput. Chem. 26, 1701–1718 (2005).
- Darden, York, and Pedersen (1993) T. Darden, D. York, and L. Pedersen, J. Chem. Phys. 98, 10089 (1993).
- Ewald (1921) P. P. Ewald, Ann. Phys. (Leipzig) 369, 253–287 (1921).
- Allen and Tildesley (1991) M. P. Allen and D. J. Tildesley, in Computer Simulation of Liquids (Oxford University Press, 1991) pp. 64–65.
- Berendsen et al. (1984) H. J. C. Berendsen, J. P. M. Postma, W. F. van Gunsteren, A. DiNola, and J. R. Haak, J. Chem. Phys. 81, 3684 (1984).
- Nosé (1984) S. Nosé, Mol. Phys. 52, 255 (1984).
- Hoover (1985) W. G. Hoover, Phys. Rev. A 31, 1695 (1985).
- Parrinello and Rahman (1981) M. Parrinello and A. Rahman, J. Appl. Phys. 52, 7182 (1981).
- Nosé and Klein (1983) S. Nosé and M. Klein, Mol. Phys. 50, 1055 (1983).
- Bussi, Donadio, and Parrinello (2007) G. Bussi, D. Donadio, and M. Parrinello, J. Chem. Phys. 126, 014101 (2007).
- Cahoon, Maruyama, and Wettlaufer (2006) A. Cahoon, M. Maruyama, and J. S. Wettlaufer, Phys. Rev. Lett. 96, 255502 (2006).
- Buch, Sandler, and Sadlej (1998) V. Buch, P. Sandler, and J. Sadlej, J. Phys. Chem. B 102, 8641 (1998).
- Ewing and Ionescu (1974) G. J. Ewing and L. G. Ionescu, J. Chem. Eng. Data 19, 367 (1974).
- Note (1) H. L. Clever, Ed., IUPAC Solubility Data Series, Vol. 2, Krypton, Xenon and Radon, Pergamon Press, Oxford, England, 1979.
- Nada (2006) H. Nada, J. Phys. Chem. B 110, 16526 (2006).
- Note (2) See supplementary material at http://dx.doi.org/10.1063/1.4887069 for animations of Xe motion on different time scales (1%/280 K; water omitted for clarity); homogeneous formation of Xe clathrate hydrate (45 ns, green atoms highlighted according to Figure 2); Xe hydrate formation in the water–ice system (60 ns).
- Jacobson, Hujo, and Molinero (2010) L. C. Jacobson, W. Hujo, and V. Molinero, J. Am. Chem. Soc. 132, 11806 (2010).
- Pietrass et al. (1995) T. Pietrass, H. C. Gaede, A. Bifone, A. Pines, and J. A. Ripmeester, J. Am. Chem. Soc. 117, 7520 (1995).
- Matsumoto, Saito, and Ohmine (2002) M. Matsumoto, S. Saito, and I. Ohmine, Nature 416, 409 (2002).
- Walsh et al. (2009) M. R. Walsh, C. A. Koh, E. D. Sloan, A. K. Sum, and D. T. Wu, Science 326, 1095 (2009).
- Matsumoto (2010) M. Matsumoto, J. Phys. Chem. Lett. 1, 1552 (2010).
- Paschek (2004b) D. Paschek, J. Chem. Phys. 120, 10605 (2004b).
- Li et al. (2009) T. Li, D. Donadio, L. M. Ghiringhelli, and G. Galli, Nat. Mater. 8, 726 (2009).
- Pirzadeh and Kusalik (2013) P. Pirzadeh and P. G. Kusalik, J. Am. Chem. Soc. 135, 7278 (2013).