Two-color spin noise spectroscopy: Using spin fluctuation correlations to reveal homogeneous linewidths within quantum dot ensembles
Abstract
“Spin noise spectroscopy” (SNS) is a powerful optical technique for probing electron and hole spin dynamics that is based on detecting their intrinsic and random fluctuations while in thermal equilibrium, an approach guaranteed by the fluctuation-dissipation theorem. Because SNS measures fluctuation properties rather than conventional response functions, we show that fluctuation correlations can be exploited in multi-probe noise studies to reveal information that in general cannot be accessed by conventional linear optical spectroscopy, such as the underlying homogeneous linewidths of individual constituents within inhomogeneously-broadened systems. This is demonstrated in an ensemble of singly-charged (In,Ga)As quantum dots using two weak probe lasers: When the two lasers have the same wavelength, they are sensitive to the same QDs in the ensemble and their spin fluctuation signals are correlated. In contrast, two probe lasers that are widely detuned from each other measure different subsets of QDs, leading to uncorrelated fluctuations. Measuring the noise correlation versus laser detuning directly reveals the QD homogeneous linewidth even in the presence of a strong inhomogeneous broadening. Such noise-based correlation techniques are not limited to semiconductor spin systems, but can be widely applied to any system in which intrinsic fluctuations are measurable.
Inhomogeneous broadening is ubiquitous in the physical, chemical and materials sciences, occurring whenever a collection of nominally-equivalent constituents differ in, e.g., size, shape, composition, conformation and/or local environment. Notable examples in nanoscale materials include ensembles of nanocrystals, quantum dots, nanotubes, or molecules Alivisatos ; Scholes ; Bawendi . In optically active systems, such broadening typically leads to a spread of the constituents’ fundamental absorption or emission energies over an inhomogeneously broadened band of spectral width , which can be orders of magnitude larger than the underlying homogeneous linewidth of the individual constituents themselves Bawendi ; Gammon ; Atature ; Gerardot ; WarburtonReview ; Vamivakas . Usually, however, is the essential quantity of interest, since directly reveals (or at least constrains) the fundamental relaxation rates and coherence times of the system, which are the crucial parameters for many applications.
Unfortunately, is generally inaccessible in inhomogenously-broadened ensembles using conventional low-power/linear optical spectroscopic techniques, which typically measure time- and ensemble-averaged response functions (such as absorption, photoluminescence, polarization, etc). To circumvent this limitation, various non-linear optical methods have been very successfully developed over the years to extract from inhomogeneously broadened ensembles; examples include spectral-hole burning Berry ; Palinginis and four-wave mixing methods Remillard ; Borri ; BorriReview ; Moody ; MoodyTrion , which necessarily rely on the excitation and nonlinear optical response of the material. In parallel, a multitude of optical techniques for isolating and measuring single particles Bawendi ; Gammon ; Atature ; Gerardot ; WarburtonReview ; Vamivakas have also been developed to get around the problem of inhomogeneous broadening in ensemble studies.
In this work we develop a novel low-power optical technique – two-color spin noise spectroscopy – and demonstrate that it can be used to reveal the underlying homogeneous linewidth of the individual constituents that make up an otherwise inhomogeneously-broadened ensemble. Specifically we apply these methods to reveal of singly-charged (In,Ga)As quantum dots (QDs) within an inhomogeously-broadened QD ensemble. Importantly, this optical technique operates in the linear/low-power regime and does not rely on any excitation or nonlinear response of the system. The key point is that this technique is not based on conventional time-averaged response functions, but rather is based on the intrinsic and random fluctuation properties of the system – in this case, spin fluctuations. In particular, it exploits the fact that spin fluctuations from different QDs in the ensemble are uncorrelated in time. By measuring the degree of correlation between two independent noise probes (two probe lasers detuned from each other), we reveal the underlying homogeneous absorption linewidth, , of positively-charged QDs in an ensemble measurement – information that is generally inaccessible to conventional linear spectroscopy.
Optical spin noise spectroscopy (SNS) is a powerful and relatively new technique for probing the dynamics of electron and/or hole spins, that is based on measuring their intrinsic fluctuations while they remain unperturbed and in thermal equilibrium CrookerGas ; ZapasskiiR ; MullerPhysicaE . This approach, though non-standard, is nonetheless assured by the fluctuation-dissipation theorem, which relates linear response functions to the frequency spectrum of intrinsic fluctuations Kubo . In a typical SNS experiment, random spin fluctuations in an equilibrium sample impart Faraday rotation (optical polarization rotation) fluctuations on a probe laser, which can be measured with high sensitivity. In the frequency domain, the peak positions, widths, and amplitudes of this Faraday rotation (FR) noise reveal the detailed dynamical properties of the spins such as -factors, coherence times, and relaxation rates – without (in principle) ever exciting or pumping the spin system itself. This latter appealing aspect arises because spin detection via FR depends on the system’s dispersive indices of refraction (rather than absorption), and in many systems it can form the basis for continuous quantum nondemolition measurement Kuzmich ; Takahashi . Optical SNS has been applied to alkali vapors CrookerGas , electrons in bulk n-type GaAs Oestreich ; CrookerGaAs , quantum well microcavities Poltavtsev , and recently to electron and hole spins in (In,Ga)As QD ensembles CrookerQD ; Li .
In all SNS studies reported to date, a single probe laser was used to detect the intrinsic spin fluctuations of the system. For the studies of QD ensembles CrookerQD ; Li , this probe laser was tuned in wavelength to lie directly within the inhomogeneously-broadened absorption/photoluminescence band of the ensemble. Because individual QDs within the ensemble have very narrow homogeneous linewidths at low temperature Gammon ; Atature ; Gerardot ; WarburtonReview ; Vamivakas , the probe laser is particularly sensitive to spin fluctuations from those singly-charged QDs having charged exciton (trion) optical transition energies close to the laser energy.
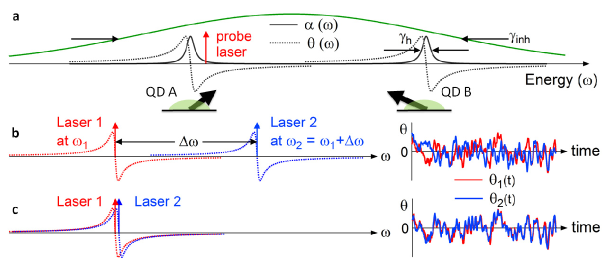
Consider, as depicted in Fig. 1a, an inhomogeneously-broadened QD ensemble and two singly-charged dots (QDA and QDB) with different trion transition energies within this ensemble. Per the usual optical selection rules for spins in III-V or II-VI semiconductors WarburtonReview ; SelectionRules , individual QDs within this ensemble exhibit spin-dependent absorption spectra for right- and left-circularly polarized light (, assumed to be Lorentzian) that depend on the orientation of the resident spin. For example,
| (1) |
if the resident spin has projection “spin-up” along the probe laser (), while and are swapped for opposite spin projection. Here, is the photon energy, is the energy of the charged exciton transition of the QD in question, and is its homogeneous absorption linewidth. The Faraday rotation, , that is imparted to a probe laser by this spin-dependent optical transition scales as the difference between the associated indices of refraction, and :
| (2) |
Therefore when the resident spin in a QD fluctuates randomly in time, also fluctuates. In thermal equilibrium and in zero magnetic field its time average is of course zero (), but its variance – the FR noise power – is nonzero and is peaked at photon energies away from the QD resonance, and decays as for large detuning. (Note also that spin fluctuations induce no FR noise exactly on resonance when , because is an odd function). Therefore the probe laser depicted in Fig. 1a, which has photon energy close to the QDA trion resonance, is much more sensitive to spin (FR) fluctuations from QDA than from QDB.
We exploit this spectral selectivity, and also the fact that fluctuations of spins in different dots are nominally uncorrelated in time, to directly obtain in an ensemble measurement, using a low-intensity (linear) optical experiment based on spin noise. Specifically, we use two different probe lasers (“1” and “2”) that are tuned within the broad absorption band of the QD ensemble, and measure the degree of correlation between the FR fluctuations that are imparted on the two lasers [ and ]. The two co-propagating probe lasers are incident on the same photodetectors, and the total measured FR is just the sum . The variance of the FR noise (i.e., the measured noise power) is therefore
| (3) |
As depicted in Fig. 1b, if the detuning between the two lasers is large (), then each laser probes a different and independent subset of fluctuating spins, and and are uncorrelated and add incoherently (i.e., the cross-term in Eq. 3 averages to zero). In contrast, if (see Fig. 1c), then the lasers measure predominantly the same QDs, and the FR fluctuations are correlated, giving larger measured noise power.
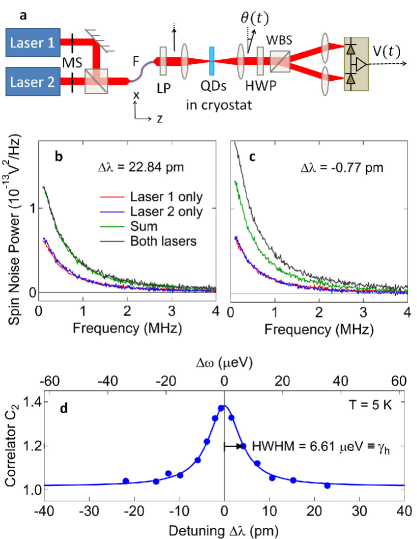
The two-color spin noise experiment is depicted in Fig. 2a. The low-power outputs from two tunable continuous-wave probe lasers (1 and 2, each having 10 MHz linewidth) are combined and launched through a single-mode polarization-maintaining fiber to ensure spatial overlap. The light is linearly polarized and focused weakly through an ensemble of singly-charged QDs (typical spot sizes are 25 m, with 100 W power from each laser). Stochastic fluctuations of the hole spins in the QDs generate FR fluctuations on the transmitted probe beam, which are measured with balanced photodiodes. The output voltage is continuously digitized and Fourier-transformed in real time CrookerQD to obtain the noise power density spectrum (shown here in units of /Hz). Mechanical shutters control whether the probe beam is composed of laser 1, 2, or both. The samples are lightly -type (In,Ga)As/GaAs QDs grown by molecular beam epitaxy (see Methods). Owing to statistical variations in QD size and composition, the ensemble PL spectrum is strongly inhomogeneously broadened ( meV), and is peaked at 1.385 eV (895 nm).
Figure 2b shows the measured power spectra of hole spin noise for the case of large detuning between probe lasers (=22.84 pm, or =35.36 eV). The red and blue noise spectra were acquired using the individual lasers 1 and 2 alone. The noise spectra are Lorentzian with 500 kHz half-width, indicating long hole spin relaxation times of 300 ns, in agreement with previous (single-probe) noise studies of similar QD ensembles Li . The green spectrum is just the mathematical sum of these two single-probe measurements. The black spectrum is the spin noise acquired using both lasers 1 and 2 simultaneously. Here, this black trace overlaps almost exactly with the green, indicating that in this case the FR fluctuations on the two lasers are uncorrelated: the noise power with both lasers is simply the sum of the noise power from the two individual probe lasers because the interference term in Eq. 3 vanishes.
In marked contrast, Fig. 2c shows the case for small detuning between the probe lasers (=-0.77 pm, or =-1.19 eV). Here, the spin noise power measured with both lasers simultaneously is greater than the sum of the noise power measured by lasers 1 and 2 individually, indicating that the FR noise encoded on the two probe lasers is at least partially correlated such that the interference term in Eq. 3, , exceeds zero.
We define the two-color spin correlator as
| (4) |
expressed here as a function of the photon energy of probe laser 1 and the detuning between lasers 1 and 2. Here, and are the total spin noise power measured by individual probe lasers 1 and 2 respectively (computed via the area under the measured noise spectra in, e.g., Figs. 2b,c). is the total spin noise power measured using both lasers simultaneously. Following Eq. 3, we can therefore expect the two-color spin correlator =1 if the noise on the two lasers is uncorrelated, but increases to 2 when the noise is perfectly correlated and .
Figure 2d shows the measured versus detuning . It is clearly peaked at =0 as expected, and falls rapidly to unity as increases. It fits very well to a Lorentzian function with a very narrow half-width at half-maximum (HWHM) of 4.27 pm, or 6.6 eV. As shown immediately below, the key point of two-color spin noise spectroscopy is that the half-width of directly reveals the underlying homogeneous linewidth of the singly-charged QDs in the ensemble.
It is straightforward to show that is expected to exhibit a Lorentzian shape with HWHM equal to . First, note that the total FR noise power detected by a single probe laser at energy is given by integrating up the FR noise power generated by all the QDs (at energies ) in the ensemble:
| (5) |
where has the same form as in Eq. 2, and is the inhomogeneously-broadened distribution of QD energies characterized by . Effectively, this corresponds to integrating the square of the dotted red or blue curves in Figure 1b, weighted by . As discussed earlier, most of the noise power comes from those QDs with resonances close to the probe laser.
When both lasers probe the QDs simultaneously (at and ), the total spin noise power is
| (6) |
which corresponds to integrating the square of the sum of the dotted red and blue lines in Figs. 1b,c. With both lasers tuned within the inhomogeneously-broadened ensemble, and since greatly exceeds both and typical detunings , can be approximated by a uniform distribution [] and can be calculated analytically:
| (7) |
which is a Lorentzian with HWHM=. (We note that if the lasers are tuned far outside of the inhomogeneous absorption band then is expected to be constant, a scenario that will be discussed and modeled later).
Thus, using only low-power continuous-wave probe lasers and performing passive measurements, the homogeneous linewidth of singly-charged QDs is revealed in an ensemble measurement. Crucially, this is made possible because we measure fluctuations and correlations, rather than conventional time-averaged linear responses. The measured value ( eV) is in rather good agreement with recent nonlinear four-wave mixing studies MoodyTrion of very similar positively-charged (In,Ga)As QD ensembles ( eV at 10 K) and also with absorption measurements of individual positively-charged InGaAs QDs ( eV at 4.2 K in ref. Gerardot ; WarburtonReview , and GHz eV at 5 K in ref. GreilichNatPhys ). It is less than inferred from coherent control studies of hole qubits in single InAs-based QDs (6.7 GHz 27 eV at 1.6 K) DeGreve , but in all cases the different QD growth and device fabrication conditions make direct comparisons difficult.
We note that both the principle and the technique of two-color spin noise spectroscopy – as well as the information obtained – are essentially different than the methods for ‘optical spectroscopy of spin noise’ discussed recently by Zapasskii et al Zapasskii . Ref. Zapasskii describes how single-probe SNS measurements can be used, e.g., to tell the difference between homogeneous and inhomogeneously-broadened lines, or to infer whether the ratio is changing in response to some external parameter like temperature. However, ref. Zapasskii concerns exclusively single-probe SNS experiments (not multi-probe), and measurements of noise power only (not correlations). Most importantly, direct measurements of are not possible, in contrast to the case here.
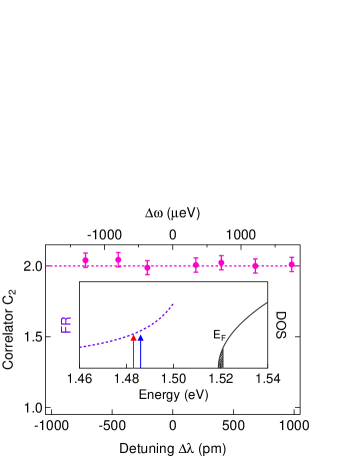
To validate this two-color noise technique, Fig. 3 shows a control experiment on bulk n-type GaAs. As shown in earlier studies CrookerGaAs ; Glasenapp , spin fluctuations of electrons in the conduction band of -GaAs generate FR fluctuations that can be detected at photon energies far below the low temperature GaAs band-gap (e.g., at sub-gap wavelengths from 830-900 nm), owing to the long tails of the dispersive indices of refraction (see inset). Importantly, FR noise detected at these low energies derives primarily from the same fluctuating electron spins in the conduction band, independent of probe laser wavelength. Thus, we expect correlated noise and =2 in a two-color noise experiment on n-GaAs, independent of . Exactly this behavior was observed and confirmed, as shown in Fig. 3. Note that this experiment corresponds to a situation where both probe lasers are tuned well outside of any inhomogeneously-broadened absorption band, a situation modeled later in Fig. 6.
Although Fig. 2d shows that for the QD ensemble exhibits the anticipated Lorentzian lineshape and reveals the expected , we note that its peak value is only 1.4, which is less than the value of 2 that was observed in the -GaAs control sample and which is expected from Eq. (7). This is because the probe lasers are tuned directly within the absorption band of the QD ensemble, and are therefore unavoidably pumping those QDs that are resonant with the lasers. In this regime the probe lasers cannot be considered completely non-perturbing, as evidenced by the fact that the measured spin noise density (in units of ) increases only sub-linearly with laser intensity (and the spin noise power density in units of /Hz increases less-than-quadratically with ). For the very narrowband lasers used in these studies (10 MHz), independent experiments confirm that the measured noise power increases as instead of . This is consistent with the peak value of the correlator measured in Fig. 2d ().
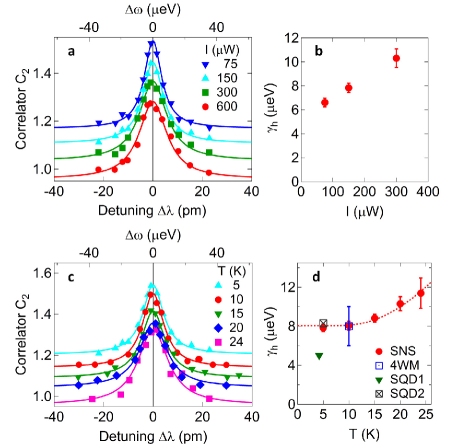
It is well established from optical studies of single QDs and also from nonlinear optical studies of QD ensembles that the measured is strongly dependent on the intensity of the probing light Vamivakas ; Berry . Figures 4a,b explore the influence of probe laser intensity on the two-color noise correlator at 5 K. The inferred increases with , similar to past studies Vamivakas ; Berry , likely due to the resonant QD pumping effects and excitation-induced broadening discussed above. In the limit of zero laser intensity, these data suggest 6 eV for the positively-charged trion transition in these QDs, which is consistent with prior results Gerardot ; WarburtonReview ; MoodyTrion ; GreilichNatPhys as discussed above.
It is also well known that broadens with increasing temperature in epitaxial QDs due to interactions with phonons. Figures 4c,d shows the temperature dependence of and . is nearly constant below 10 K, but increases at higher temperatures. This overall trend agrees very well with available reported data on the temperature dependence of exciton linewidths in undoped but otherwise very similar (In,Ga)As QDs Borri ; BorriReview , and also on interfacial GaAs QDs Moody , both of which were measured by nonlinear ultrafast four-wave mixing techniques. For a direct visual comparison Fig. 4d also plots determined from other studies of positively-charged (In,Ga)As QDs discussed above Gerardot ; WarburtonReview ; MoodyTrion ; GreilichNatPhys , with which our results are also in quite reasonable agreement, confirming the viability and utility of this low-power noise-based optical technique.

We also show that measurements of are possible by measuring ellipticity fluctuations imparted on the transmitted probe light (instead of FR fluctuations). Whereas spin fluctuations induce FR noise via the dispersive real part of the QD dielectric function (i.e., the indices of refraction ), ellipticity noise is associated with fluctuations of the imaginary part (i.e., the absorption, ). Ellipticity and FR noise are linked via Kramers-Kronig relations and are therefore related. By replacing the half-wave plate in Figure 2a with a quarter-wave plate, ellipticity noise is measured. Figure 5 shows raw ellipticity noise power from these QDs at 5 K, along with . Following a similar analysis, the ellipticity correlator is found to have the same functional form as in Eq. 7, i.e., a Lorentzian line shape with HWHM=. For a given laser intensity , we find that obtained via ellipticity noise is slightly larger than determined from FR noise (Fig. 5b), a likely consequence of the excitation-induced broadening discussed above and the fact that ellipticity is by definition more sensitive to absorption and therefore to QDs exactly on resonance with the probe lasers.
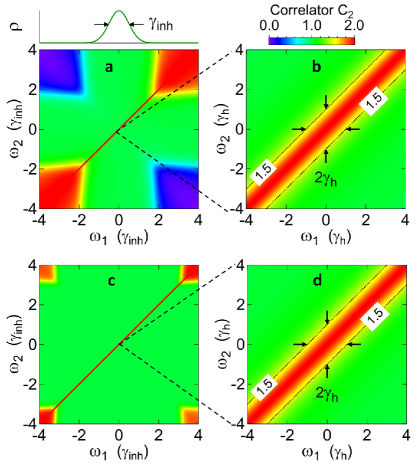
Finally, Fig. 6 shows model calculations of the two-color noise correlator over a broad range of the two probe laser energies and , using Eqs. 4-6. For simplicity we consider an idealized inhomogeneously-broadened Gaussian absorption band with . In the usual case where the probe lasers detect spin fluctuations via Faraday rotation, Fig. 6a shows that when and/or is tuned within this broad inhomogeneous band, the spin noise is everywhere uncorrelated (=1) except along the thin diagonal line corresponding to (more specifically, when ). Expanding this region (Fig. 6b), this thin band has half-width equal to , as expected from Eq. 7 and as experimentally observed in Figures 2 and 4. Interestingly, however, when both and lie well outside this broad absorption band, then neither probe laser is preferentially sensitive to nearly-resonant QDs (because there are no QDs at the probe energies). In this case, both lasers are sensitive to the total FR fluctuations from the entire ensemble, and their fluctuations will be correlated () independent of (or anti-correlated giving if the lasers are on opposite ‘sides’ of this idealized band, because is an odd function). This was the precisely the case for the two-color spin noise measurement on the -type GaAs control sample shown in Figure 3. A similar modeling can be performed for the case when spin fluctuations are measured via ellipticity noise, as shown in Figures 6c,d and as experimentally observed in Figure 5. (Note, however, that although can be calculated for all , ellipticity noise must generally be measured within the absorption band because otherwise the noise signals themselves become extremely small.)
In summary, we have introduced and demonstrated the new optical technique of two-color spin noise spectroscopy. Despite being a low-power optical method that does not rely on excitation, pumping, or perturbation of the ensemble, it can directly reveal, e.g., the underlying homogeneous linewidths of QDs that are otherwise obscured in strongly inhomogeneously-broadened optical spectra. This is because these methods are based on fluctuations and correlations, rather than on measurement of the standard time-averaged response functions that are measured by conventional linear optical spectroscopy. Though demonstrated here for the specific case of semiconductor QDs and spin fluctuations, the general principle should be broadly applicable to many classes of systems and materials in which intrinsic fluctuations can be detected – and may prove especially attractive for those systems where the individual constituents cannot easily be isolated, or for which intense non-linear perturbation is undesired. Moreover, these noise-based techniques can equally well be applied to – and have great promise for – studies of correlations in interacting systems, such as coupled quantum-dot or nanocrystal systems, spin-exchange interactions in atomic gases, or spin-spin interactions in chemical and biological systems. A further interesting extension of these ideas is to measure not only temporal but also spatial correlations of systems exhibiting collective excitation (e.g. magnon, plasmon, or polariton systems), by two or more probes with tunable spatial separation Pershin .
I Methods
Quantum dot samples. Self-assembled InAs/GaAs QDs were grown by molecular beam epitaxy on (001) GaAs substrates, and then thermally annealed at 940 ∘C for 30 seconds. Annealing interdiffuses indium and gallium and thus increases the size of the QDs and decreases the depth of the confining potential, blue-shifting the QD absorption band to 900 nm. The sample contains 20 layers of QDs, separated by 60 nm GaAs barriers, with QD density of cm-2 in each layer. The sample is weakly p-type due to background carbon doping; we estimate that 10% of the QDs contain a single resident hole. The measured spin noise arises from stochastic fluctuations of the resident holes trapped in the singly-charged subset of QDs. The control experiment was carried out on a bulk n-GaAs wafer with electron density cm-3.
Experimental setup. The samples are mounted on the cold finger of a liquid helium optical cryostat. Two tunable narrowband continuous-wave diode lasers (from Toptica and New Focus, both with 10 MHz linewidth) are tuned in wavelength near the center of the inhomogeneously-broadened PL/absorption spectrum of the QD ensemble. In all the data shown, the first laser remains at a fixed frequency of eV (896.3 nm); the second one is detuned from the first one by . did not vary appreciably for different values of . For the control experiment on bulk n-GaAs, we use two continuous-wave Ti:sapphire lasers (from Coherent). The lasers were tuned 30 meV below the low-temperature absorption edge of bulk GaAs ( eV or 818 nm). The spin noise signal is continuously digitized and processed by an FPGA CrookerQD to obtain the spin noise power spectrum.
References
- (1) Alivisatos, A. P., Harris, A. L., Levinos, N. J., Steigerwald, M. L. & Brus, L. E. Electronic states of semiconductor clusters: Homogeneous and inhomogeneous broadening of the optical spectrum. J. Chem. Phys. 89, 4001-4011 (1988).
- (2) Scholes, G. D. Controlling the optical properties of inorganic nanoparticles. Adv. Funct. Mater. 18, 1157-1172 (2008).
- (3) Empedocles, S. A., Neuhauser, R., Shimizu, K. & Bawendi, M. Photoluminescence from single semiconductor nanostructures. Adv. Mater. 11, 1243-1256 (1999).
- (4) Gammon, D., Snow, E. S., Shanabrook, B. V., Katzer, D. S. & Park, D. Homogeneous linewidths in the optical spectrum of a single gallium arsenide quantum dot. Science 273, 87-90 (1996).
- (5) Atatüre, M., Dreiser, J., Badolato, A., Högele, A., Karrai, K. & Imamoglu, A. Quantum-dot spin-state preparation with near-unity fidelity. Science 312, 551-553 (2006).
- (6) Gerardot, B. D., Brunner, D., Dalgarno, P. A., Öhberg, P., Seidl, S., Kroner, M., Karrai, K., Stoltz, N. G., Petroff, P. M. & Warburton, R. J. Optical pumping of a single hole spin in a quantum dot. Nature 451, 441-444 (2008).
- (7) Warburton, R. J., Single spins in self-assembled quantum dots, Nature Mater. 12, 483-493 (2013).
- (8) Vamivakas, A. N., Atatüre, M., Dreiser, J., Yilmaz, S. T., Badolato, A., Swan, A. K., Goldberg, B. B., Imamoǧlu, A. & Ünlü, M. S. Strong extinction of a far-field laser beam by a single quantum dot. Nano Letters 7, 2891-2896 (2007).
- (9) Berry, J. J., Stevens, M. J., Mirin, R. P. & Silverman, K. L. High-resolution spectral hole burning in InGaAs-GaAs quantum dots. Appl. Phys. Lett. 88, 061114 (2006).
- (10) Palinginis, P., Wang, H., Goupalov, S. V., Citrin, D. S., Dobrowolska, M. & Furdyna, J. K. Exciton dephasing in self-assembled CdSe quantum dots. Phys. Rev. B 70, 073302 (2004).
- (11) Remillard, J. T., Wang, H., Steel, D. G., Oh, J., Pamulapati, J. & Bhattacharya, P. K. High-resolution nonlinear laser spectroscopy of heavy-hole excitons in GaAs/AlGaAs quantum-well structures: A direct measure of the exciton line shape. Phys. Rev. Lett. 62, 2861-2864 (1989).
- (12) Borri, P., Langbein, W., Woggon, U., Stavarache, V., Reuter, D. & Wieck, A. D. Exciton dephasing via phonon interactions in InAs quantum dots: Dependence on quantum confinement. Phys. Rev. B 71, 115328 (2005).
- (13) Borri, P. & Langbein, W. Four-wave mixing dynamics of excitons in InGaAs self-assembled quantum dots. J. Phys.: Condens. Matter 19, 295201 (2007).
- (14) Moody, G., Siemens, M. E., Bristow, A. D., Dai, X., Karaiskaj, D., Bracker, A. S., Gammon, D. & Cundiff, S. T. Exciton-exciton and exciton-phonon interactions in an interfacial GaAs quantum dot ensemble. Phys. Rev. B 83, 115324 (2011).
- (15) Moody, G., Singh, R., Li, H., Akimov, I. A., Bayer, M., Reuter, D., Wieck, A. D. & Cundiff, S. T. Fifth-order nonlinear optical response of excitonic states in an InAs quantum dot ensemble measured with two-dimensional spectroscopy. Phys. Rev. B 87, 045313 (2013).
- (16) Crooker, S. A., Rickel, D. G., Balatsky, A. V. & Smith, D. L. Spectroscopy of spontaneous spin noise as a probe of spin dynamics and magnetic resonance. Nature 431, 49-52 (2004).
- (17) Zapasskii, V. S. Spin noise spectroscopy: From proof of principle to applications. Advances in Optics and Photonics, 5, 131-168 (2013).
- (18) Müller, G. M., Oestreich, M., Römer, M. & Hübner, J. Semiconductor spin noise spectroscopy: Fundamentals, accomplishments, and challenges. Physica E 43, 569-587 (2010).
- (19) Kubo, R. The fluctuation-dissipation theorem. Rep. Prog. Phys. 29, 255-284 (1966).
- (20) Kuzmich, A., Mandel, L., Janis, J., Young, Y. E., Ejnisman, R. & Bigelow, N. P. Quantum nondemolition measurements of collective atomic spin, Phys. Rev. A 60, 2346-2350 (1999).
- (21) Takahashi, T., Honda, K., Tanaka, N., Toyoda, K., Ishikawa, K. & Yabuzaki, T. Quantum nondemolition measurement of spin via the paramagnetic Faraday rotation, Phys. Rev. A 60, 4974-4979 (1999).
- (22) Oestreich, M., Römer, M., Haug, R. J. & Hägele, D. Spin noise spectroscopy in GaAs. Phys. Rev. Lett. 95, 216603 (2005).
- (23) Crooker, S. A., Cheng, L. & Smith, D. L. Spin noise of conduction electrons in n-type bulk GaAs. Phys. Rev. B 79, 035208 (2009).
- (24) Poltavtsev, S. V., Ryzhov, I. I., Glazov, M. M., Kozlov, G. G., Zapasskii, V. S., Kavokin, A. V., Lagoudakis, P. G., Smirnov, D. S. & Ivchenko E. L. Spin noise spectroscopy of a single quantum well microcavity. Phys. Rev. B 89, 081304(R) (2014).
- (25) Crooker, S. A., Brandt, J., Sandfort, C., Greilich, A., Yakovlev, D. R., Reuter, D., Wieck, A. D. & Bayer, M. Spin noise of electrons and holes in self-assembled quantum dots. Phys. Rev. Lett. 104, 036601 (2010).
- (26) Li, Y., Sinitsyn, N., Smith, D. L., Reuter, D., Wieck, A. D., Yakovlev, D. R., Bayer, M. & Crooker, S. A. Intrinsic spin fluctuations reveal the dynamical response function of holes coupled to nuclear spin baths in (In,Ga)As quantum dots. Phys. Rev. Lett. 108, 186603 (2012).
- (27) Optical Generation and Control of Quantum Coherence in Semiconductor Nanostructures, G. Slavcheva and P. Roussignol (eds.) (Springer, Berlin, 2010).
- (28) Greilich, A., Carter, S. G., Kim, D., Bracker, A. S. & Gammon, D. Optical control of one and two hole spins in interacting quantum dots. Nat. Photon. 5, 702-708 (2011).
- (29) De Greve, K., McMahon, P. L., Press, D., Ladd, T. D., Bisping, D., Schneider, C., Kamp, M., Worschech, L., Höfling, S., Forchel, A. & Yamamoto, Y. Ultrafast coherent control and suppressed nuclear feedback of a single quantum dot hole qubit. Nat. Phys. 7, 872 (2011).
- (30) Zapasskii, V. S., Greilich, A., Crooker, S. A., Li, Y., Kozlov, G. G., Yakovlev, D. R., Reuter, D., Wieck, A. D. & Bayer, M. Optical spectroscopy of spin noise. Phys. Rev. Lett. 110, 176601 (2013).
- (31) Glasenapp, P., Greilich, A., Ryzhov, I. I., Zapasskii, V. S., Yakovlev, D. R., Kozlov, G. G. & Bayer, M. Resources of polarimetric sensitivity in spin noise spectroscopy. Phys. Rev. B 88, 165314 (2013).
- (32) Pershin, Y. V., Slipko, V. A., Roy, D. & Sinitsyn, N. A. Two-beam spin noise spectroscopy. Appl. Phys. Lett. 102, 202405 (2013).
I.1 Acknowledgements
We are particularly indebted to M. Boshier for the loan of a tunable laser system. We also thank N. Sinitsyn and D.L. Smith for helpful discussions, and gratefully acknowledge D. Reuter and A. D. Wieck for the QD sample. This work was supported by the Los Alamos LDRD program (under the auspices of the US DOE, Office of Basic Energy Sciences, Division of Materials Sciences and Engineering), and also by the Deutsche Forschungsgemeinschaft.