Explosive metallic breakdown
Abstract
We investigate the metallic breakdown of a substrate on which highly conducting particles are adsorbed and desorbed with a probability that depends on the local electric field. We find that, by tuning the relative strength of this dependence, the breakdown can change from continuous to explosive. Precisely, in the limit in which the adsorption probability is the same for any finite voltage drop, we can map our model exactly onto the -state Potts model and thus the transition to a jump occurs at . In another limit, where the adsorption probability becomes independent of the local field strength, the traditional bond percolation model is recovered. Our model is thus an example of a possible experimental realization exhibiting a truly discontinuous percolation transition.
pacs:
05.50.+q, 64.60.ah, 89.75.DaOne of the main problems in the manufacturing of Integrated Circuits (IC), where millions of nanometric metallic and semiconductor devices are placed on a substrate, is pollution with metallic dust, since it can induce an electric breakdown, leading to malfunctioning and a shorter life-time of the IC Alam2002 ; Niemeyer1984 ; Verweij1996 . The following question then arises, under which conditions and how fast such a system does collapse. To answer this question, one needs to take into account that the deposition of metallic particles is hindered by the local electric field. This strongly non-linear interplay between adsorption and the local geometry gives rise to interesting phenomena that we will explore here with the help of a rather simple model, which however can still capture the essential physics of the problem. In particular, we find that the collapse can either be continuous or explosive depending on the physical parameters.
Here, we model the substrate as a tilted square lattice with periodic boundary conditions in one direction and a voltage drop applied in the other direction. For simplicity, the bonds of the lattice can be either associated with highly resistive elements or metallic particles, with resistances and , respectively. Nodes connected by metallic bonds constitute metallic clusters and thus have the same electric potential. Resistive bonds that connect sites of the same metallic cluster are called internal bonds, while all other resistive bonds are called merging bonds. Internal bonds do not feel any field and therefore metal dust can be adsorbed on them with a probability times higher than on merging bonds, where the factor describes the relative deposition disadvantage due to the presence of the field. Additionally the probability of adsorbing a metallic particle decreases monotonically with the strength of the local field gradient , namely, we will assume here generically that the adsorption probability decays as , where is another adjustable parameter. In the framework of this model, it follows that the probability for metallic bonds to replace resistive bonds (adsorption process) is given by,
| (1) |
One should note that, if the bond is internal, the adsorption probability becomes , since .

The inverse process, namely desorption, then happens naturally with a probability one minus the probability of adsorption: . The model has three parameters: is a measure for the amount of metallic dust, is the enhancement of adsorption if there is no local electric field, and is the dependence on the strength of the local field. For , all resistive bonds (merging and internal) can be replaced with the same probability so that, in this limit, one recovers classical bond percolation Stauffer1992 . Moreover, as we will discuss later, one recovers the -state Potts model for Potts1952 ; Gliozzi2002 . In a way, our model is the inverse of a fuse model Kahng1988 ; Andrade2011 ; Pose2012 ; Moreira2012 .
The simulations are performed here by randomly choosing, at each iteration, a bond between neighboring nodes and and attempting to change its state according to the probabilities previously described. Each time a merging bond is identified, the local potential drop is calculated by solving the Kirchhoff equations for each node simultaneously. This is equivalent to solve the Laplace equation HSL by discretization, and impose that nodes belonging to the same metallic cluster have the same potential, as illustrated in Fig. 1.
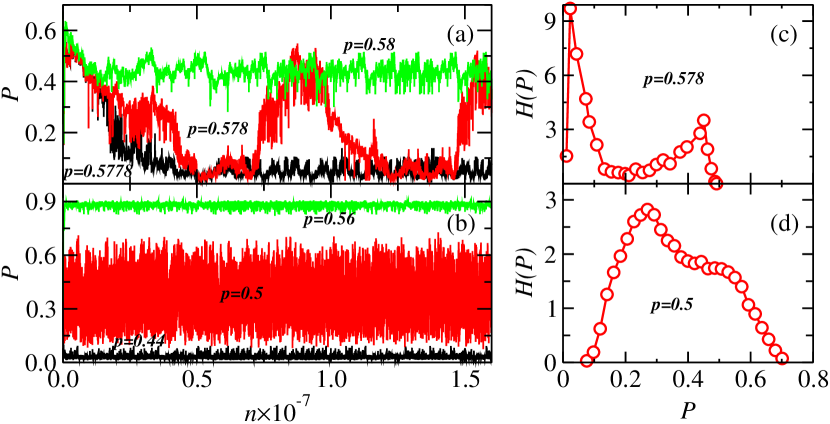
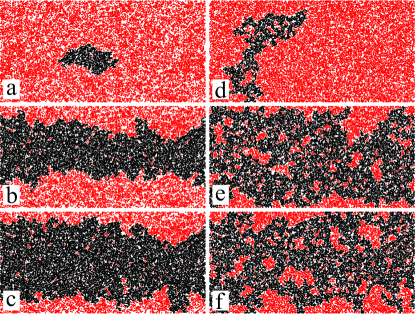
Regardless of the starting configuration, a steady state is reached after a certain number of iterations. In Fig. 2 we show how the fraction of nodes in the largest metallic cluster fluctuates with the number of iterations , at the steady state, for , and different values of and . For fixed values of and , by increasing one reaches a value at which the system electrically breaks down. At this point, a spanning metallic cluster can appear after steady state, which makes the system fluctuate strongly between resistive and metallic configurations (see Fig. 2). In particular, because, as previously stated, for our model recovers bond percolation on the square lattice. For , as shown in Fig. 2(a), mainly oscillates around two well-defined values, and . The fact that the distribution of is bimodal (see Fig. 2(c)) indicates a metastability, namely, a clear signature of a discontinuous transition. By contrast, for (see Fig. 2(b)), although the variable also fluctuates around an average value, the distribution of is unimodal and there is no sign of metastability (see Fig. 2(d)). Thus, the transition in this case is continuous. Shown in Fig. 3 are snapshots of steady state configurations for both cases at and around the threshold . While for a compact gigantic metallic cluster abruptly appears leading to a discontinuous transition (see panels (a)-(c)), for the largest cluster looks fractal and grows with yielding a continuous transition (see panels (d)-(e)). As a consequence, the metallic breakdown is either smooth or explosive depending on the values of and .
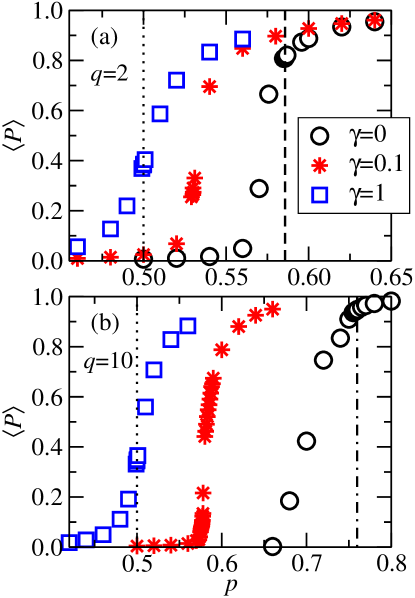
The phase transition between resistive and metallic states is described in terms of the average fraction of nodes in the largest metallic cluster, , taken here as the order parameter. For a given pair of and values, we calculate by averaging over many iterations at the steady state. Notice that the steady state may be reached with more or less iterative steps depending on the parameters of the system. In Fig. 2(a), for example, not less than steps were needed. In addition, well-defined histograms with reduced fluctuations can only be obtained in some cases for steps. Since most of these steps involves the inversion of large matrices, the calculation becomes prohibitively heavy for system sizes . In Fig. 4 we show as a function of for different values of , for in (a) and in (b). As depicted, the value of decreases with and increases with , being always between the critical points of bond percolation, , and the one of the corresponding -state Potts model (vertical lines in the plots). Moreover, these results also show that the order parameter becomes clearly steeper by increasing .
In the particular case of , merging bonds become metallic with probability and internal bonds with probability . This is precisely the Monte Carlo procedure to obtain the Coniglio-Klein clusters Coniglio1980 for the -state Potts model as derived by Gliozzi Gliozzi2002 ; Wang2002 from the Kasteleyn-Fortuin formulation Fortuin1972 ; Wu1982 . Thus is nothing but the order parameter of the -state Potts model for . From self-duality, the transition point is known exactly for the square lattice to be Wu1982 ,
| (2) |
Furthermore it is known that, in two dimensions, the phase transition of the Potts model changes at from second order, for , to first order, for . Our physical model then encompasses a plethora of transitions between continuous and abrupt metallic breakdowns. Remarkably, for the case , this is not a numerical but a rigorous result. It constitutes in fact a beautiful example for explosive (discontinuous) percolation Baxter1973 ; Nienhuis1979 which has an analytical approach, on one hand, and an experimental realization, on the other.
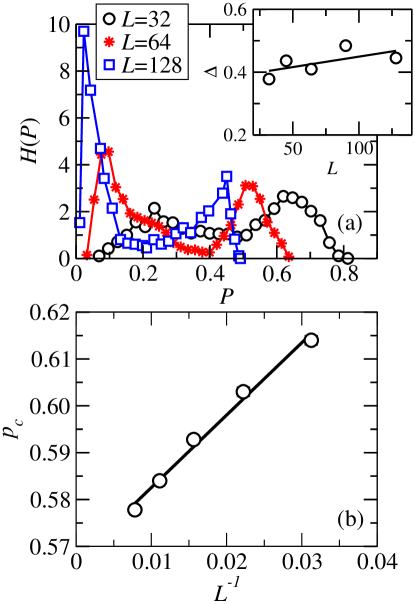
To see up to which point our result is also of more general experimental validity, we investigate numerically if this transition from continuous to abrupt exists for finite values of . The two different patterns for the evolution of shown in Fig. 2 provide strong evidence for this behavior, although a more systematic study based on finite-size scaling is necessary. One should note that, as shown in Fig. 4, due to the finite size of the simulated systems, the numerical data for (circles) still deviate considerably from those expected in the thermodynamic limit, as given by Eq. (2) (marked by dashed lines). In particular, one can not recognize the predicted continuous (discontinuous) transition in Fig. 4(a) (Fig. 4(b)). Therefore we studied the histogram of the order parameter at for different system sizes, as shown in Fig. 5 for the case and . Here was determined from a careful finite-size extrapolation (see Fig. 5(b)). As clearly shown in Fig. 5, the presence of a typical bimodal distribution and the fact that the distance between peaks does not vanish in the thermodynamic limit (see the inset of Fig. 5(a)), give very strong support for the existence of a discontinuous transition. Due to the large numerical effort involved in calculating the local voltages CompCost , we refrained from mapping in detail the full transition surface in the three-dimensional phase diagram. The important conclusion we extract from Fig. 5 is that also for (in this case ) one can find an explosive metallic breakdown.
In summary, we have discovered that the metallic breakdown due to pollution with metallic powder can become explosive if the inhibition of adsorption due to a local electric field becomes too strong. In the case , i.e., when the details of the field strength become unimportant, the model can be solved exactly, representing one of the rare examples where an explosive percolation transition at a finite can be proven to exist. The physical reason why the metallic breakdown becomes abrupt is the same as for other percolation models Achlioptas2009 ; Ziff09 ; DSouza10 ; daCosta10 ; Riordan11 ; Araujo2010 ; Cho13 ; Chen11 ; Nagler11 ; Moreira2010 ; Cho2009 ; Reis2012 ; Araujo2011 ; Andrade11 , namely, the avoidance in occupying bonds that locally feel an electric field suppresses the appearance of an infinite cluster. This effect gets more pronounced the more large local fields matter, i.e., the more cutting bonds are particularly punished.
The finding of the explosive metallic breakdown phenomenon may explain the difficulties in predicting the failure of electronic circuits. It might on the other hand also help mitigating the problem by working under conditions corresponding to non-critical regions in phase space. It is therefore interesting to further explore the present model and, in particular, to incorporate into it more empirical information about real IC circuits.
Acknowledgements.
We thank the Brazilian Agencies CNPq, CAPES, and FUNCAP, the National Institute of Science and Technology for Complex Systems in Brazil, the European Research Council (ERC) Advanced Grant 319968-FlowCCS for financial support, and the Portuguese Foundation for Science and Technology (FCT) under Contracts IF/00255/2013, PEst-OE/FIS/UI0618/2014, and EXCL/FIS-NAN/0083/2012.References
- (1) M. A. Alam, R. K. Smith, B. E. Weir, and P. J. Silverman, Nature 420, 378 (2002).
- (2) L. Niemeyer, L. Pietronero, and H. J. Wiesmann, Phys. Rev. Lett. 52, 1033 (1984).
- (3) J. F. Verweij and J. H. Klootwijk, Microelect. J. 27, 611 (1996).
- (4) D. Stauffer and A. Aharony, Introduction to Percolation Theory (Taylor & Francis, London, 1992).
- (5) R. B. Potts, Proc. Cambridge Philos. Soc. 48, 106 (1952).
- (6) F. Gliozzi, Phys. Rev. E 66, 016115 (2002).
- (7) B. Kahng, G. G. Batrouni, S. Redner, L. de Arcangelis, and H. J. Herrmann, Phys. Rev. B 37, 7625 (1988).
- (8) J. S. Andrade, H. J. Herrmann, A. A. Moreira, and C. L. N. Oliveira, Phys. Rev. E 83, 031133 (2011).
- (9) N. Posé, N. A. M. Araújo, and H. J. Herrmann, Phys. Rev. E 86, 051140 (2012).
- (10) A. A. Moreira, C. L. N. Oliveira, A. Hansen, N. A. M. Araújo, H. J. Herrmann, and J. S. Andrade, Phys. Rev. Lett. 109, 255701 (2012).
- (11) The linear equation system was solved through the HSL library, a collection of FORTRAN codes for large-scale scientific computation. See http://www.hsl.rl.ac.uk/.
- (12) A. Coniglio and W. Klein, J. Phys. A: Math. Gen. 13, 2775 (1980).
- (13) J.-S. Wang, O. Kozan, and R. H. Swendsen, Phys. Rev. E 66, 057101 (2002).
- (14) C. M. Fortuin and P. W. Kasteleyn, Physica 57, 536 (1972).
- (15) F. Y. Wu, Rev. Mod. Phys. 54, 235 (1982); F. Y. Wu, J. Stat. Phys. 18, 215 (1978).
- (16) R. J. Baxter, J. Phys. C 6, L445 (1973).
- (17) B. Nienhuis, A. N. Berker, E. K. Riedel, and M. Schick, Phys. Rev. Lett. 43, 737 (1979).
- (18) The data shown in Fig. 5 represent several months of calculation. For , each sample takes around days in one Intel Xeon GHz processor.
- (19) D. Achlioptas, R. M. D’Souza, and J. Spencer, Science 323, 1453 (2009).
- (20) R. M. Ziff, Phys. Rev. Lett. 103, 045701 (2009).
- (21) R. M. D’Souza and M. Mitzenmacher, Phys. Rev. Lett. 104, 195702 (2010).
- (22) R. A. da Costa, S. N. Dorogovtsev, A. V. Goltsev, and J. F. F. Mendes, Phys. Rev. Lett. 105, 255701 (2010).
- (23) O. Riordan and L. Warne, Science 333, 322 (2011).
- (24) N. A. M. Araújo and H. J. Herrmann, Phys. Rev. Lett. 105, 035701 (2010).
- (25) Y. S. Cho, S. Hwang, H. J. Herrmann, and B. Kahng, Science 339, 1185 (2013).
- (26) W. Chen and R. M. D’Souza, Phys. Rev. Lett. 106, 115701 (2011).
- (27) J. Nagler, A. Levina, and M. Timme, Nat. Phys. 7, 265 (2011).
- (28) A. A. Moreira, E. A. Oliveira, S. D. S. Reis, H. J. Herrmann, and J. S. Andrade Jr., Phys. Rev. E 81, 040101 (2010).
- (29) Y. S. Cho, J. S. Kim, J. Park, B. Kahng, and D. Kim, Phys. Rev. Lett. 103, 135702 (2009); Y. S. Cho, B. Kahng, and D. Kim, Phys. Rev. E 81, 030103 (2010).
- (30) S. D. S. Reis, A. A. Moreira, and J. S. Andrade, Phys. Rev. E 85, 041112 (2012).
- (31) N. A. M. Araújo, J. S. Andrade, R. M. Ziff, and H. J. Herrmann, Phys. Rev. Lett. 106, 095703 (2011).
- (32) J. S. Andrade Jr., H. J. Herrmann, A. A. Moreira, and C. L. N. Oliveira, Phys. Rev. E 83, 031133 (2011).