11email: mosorio,mcz@cab.inta-csic.es 22institutetext: Leibniz-Institut für Astrophysik Potsdam (AIP), An der Sternwarte 16, 14482, Potsdam, Germany
22email: gbihain@aip.de 33institutetext: Max-Planck-Institut für Astronomie, Königstuhl 17, 69117 Heidelberg, Germany
33email: calj,henning,goldman,mundt@mpia.de 44institutetext: Instituto de Astrofísica de Canarias, Vía Láctea s/n, E-38205 La Laguna, Tenerife, Spain
44email: rrl@iac.es 55institutetext: Dept. Astrofísica, Universidad de La Laguna, E-38206 La Laguna, Tenerife, Spain
55email: vbejar@iac.es 66institutetext: GEPI, Observatoire de Paris, CNRS, Université Paris Diderot; 5 Place Jules Janssen, F-92190 Meudon, France
66email: Steve.Boudreault@obspm.fr 77institutetext: Centro de Astrobiología (CSIC-INTA), PO Box 78, E-28691 Villanueva de la Cañada, Madrid, Spain
77email: caballero@cab.inta-csic.es
Search for free-floating planetary-mass objects in the Pleiades
Abstract
Aims. We aim at identifying the least massive population of the solar metallicity, young (120 Myr), nearby (133.5 pc) Pleiades star cluster with the ultimate goal of understanding the physical properties of intermediate-age, free-floating, low-mass brown dwarfs and giant planetary-mass objects, and deriving the cluster substellar mass function across the deuterium-burning mass limit at 0.012 M⊙.
Methods. We performed a deep photometric and astrometric - and -band survey covering an area of 0.8 deg2 in the Pleiades cluster. The images with completeness and limiting magnitudes of and mag were acquired 9 yr apart, allowing us to derive proper motions with a typical precision of 6 mas yr-1. For the cluster distance and age, the survey is sensitive to Pleiades members with masses in the interval 0.2–0.008 M⊙. - and -band data were complemented with , , and mid-infrared magnitudes up to 4.6 m coming from the UKIRT Infrared Deep Sky Survey (UKIDSS), the WISE catalog, and follow-up observations of our own. Pleiades member candidates were selected to have proper motions compatible with that of the cluster, and colors following the known Pleiades sequence in the interval = 15.5–18.8 mag, and mag or nondetections for mag.
Results. We found a neat sequence of astrometric and photometric Pleiades substellar member candidates with two or more proper motion measurements and with magnitudes and masses in the intervals = 15.5–21.2 mag and 0.072–0.008 M⊙. The faintest objects show very red near- and mid-infrared colors exceeding those of field high-gravity dwarfs by 0.5 mag. This agrees with the reported properties of field young L-type dwarfs and giant planets orbiting stars of ages of 100 Myr. The Pleiades photometric sequence does not show any color turn-over because of the presence of photospheric methane absorption down to = 20.3 mag, which is about 1 mag fainter than predicted by the combination of evolutionary models and colors computed from model atmospheres. The astrometric data suggest that Pleiades brown dwarfs have a proper motion dispersion of 6.4–7.5 mas yr-1, and are dynamically relaxed at the age of the cluster. The Pleiades mass function extends down to the deuterium burning-mass threshold, with a slope fairly similar to that of other young star clusters and stellar associations. The new discoveries may become benchmark objects for interpreting the observations of the emerging young ultracool population and giant planets around stars in the solar neighborhood.
Key Words.:
stars: low-mass, brown dwarfs, late type – open clusters and associations: individual: the Pleiades1 Introduction
Understanding the evolution and physical properties of substellar objects is one major question in modern Astrophysics. To achieve this goal, it is mandatory to identify sources at various ages to construct a picture of the complete evolutionary sequence. At the youngest ages of fewer than 10 Myr, various groups have deeply investigated different star-forming regions and star clusters in Orion, Upper Scorpio, Taurus, and other nearby young stellar associations (e.g., Lucas & Roche 2000; Luhman & Muench 2008; Luhman et al. 2009; Lodieu et al. 2012, 2013; Palau et al. 2012; Peña Ramírez et al. 2012; see review by Luhman 2012). The smallest objects found have masses of about 0.004–0.006 M⊙ and spectral types around mid-L. T dwarf candidates have also been discovered in the direction of very young star clusters and moving groups (e.g., Zapatero Osorio et al. 2002; Burgess et al. 2009; Bihain et al. 2009; Peña Ramírez et al. 2011; Lodieu et al. 2011; Delorme et al. 2012; Spezzi et al. 2012; Parker & Tinney 2013; Naud et al. 2014), although their nature and cluster membership are still debated. In the field, all-sky surveys such as the DEep Near-Infrared Survey (DENIS, Epchtein 1997), the Two Micron All Sky Survey (2MASS, Skrutskie et al. 2006), and the Wide-field Infrared Survey Explorer (WISE, Wright et al. 2010) combined with other large-scale surveys such as the Sloan Digital Sky Survey (Gunn & Weinberg 1995) and the Infrared Deep Sky Survey (UKIDSS, Lawrence et al. 2007), have led to exciting discoveries of L-, T-, and Y-type dwarfs (e.g., Delfosse et al. 1997; Tinney et al. 1998; Strauss et al. 1999; Kirkpatrick et al. 2000, 2011, 2013; Delorme et al. 2010; Cushing et al. 2011; Burningham et al. 2013). The great majority of these findings most likely have an age 1 Gyr, consistent with a field population of brown dwarfs in the solar neighborhood. Young field brown dwarfs and planetary-mass objects of similar spectral classification (the latter have a mass below the deuterium burning-mass threshold at 0.012 M⊙, Saumon et al. 1996) are rarer, but are found at a rate of 8–20% (e.g., Cruz et al. 2009, and references therein). Because young substellar objects with less than a few to several hundred Myr are expected to undergo gravitational self-contraction, their atmospheres have low pressures (or low surface gravities) and consequently display spectroscopic features that distinguish them from their older, high-gravity counterparts (e.g., Martín et al. 2010; Allers & Liu 2013): enhanced TiO and VO bands, narrow or weak alkali lines, and a triangular -band spectral shape. Unfortunately, their ages and metallicities are poorly constrained, and trigonometric parallaxes are lacking for most of them.
Being one of the nearest young open clusters to the Sun, the Pleiades offers an unique opportunity to scrutinize brown dwarfs and planetary-mass objects of known (intermediate) age and metallicity. With a solar abundance (Soderblom et al. 2009), an age of 120 Myr (Basri et al. 1996; Martín et al. 1998), and a distance of 133.5 pc (Soderblom et al. 2005), the Pleiades is a rich cluster containing over 1000 members (Sarro et al. 2014). The latest studies on the Pleiades substellar regime have probed cluster members with masses of 0.020–0.025 M⊙ and early-L spectral types (Bihain et al. 2006, 2010; Lodieu et al. 2012). The first attempt to identify Pleiades T dwarfs was made by Casewell et al. (2007, 2010, 2011). The high proper motion of the cluster [(19.71, 44.82) mas yr-1, Lotkin & Beshenov 2003] is distinctive from the field (Hambly et al. 1993), making astrometric selection of member candidates straightforward. Studying Pleiades brown dwarfs and planetary-mass objects helps to constrain and improve substellar evolutionary models. Furthermore, Pleiades members may become crucial for understanding objects of similar temperatures in the field as well as planets that orbit stars.
Here, we report on a deep photometric and astrometric exploration using broad-band filters from 1 through 5 m and covering an area of 0.8 deg2 to identify Pleiades substellar member candidates with masses across the deuterium burning-mass limit. This survey is about 1–2 mag deeper in the -bands than any previous work carried out in the Pleiades so far. According to current evolutionary models (Chabrier et al. 2000a), Pleiades members in the mass range from the substellar borderline to about 0.01 M⊙ would have effective temperatures spanning from 2750 to 900 K. We define the Pleiades sequence at very low masses and compare the photometric properties of our candidates with those of field dwarfs of similar temperatures (late-M, L, and T spectral types) and planets orbiting stars known in the literature. The 120 Myr theoretical isochrone is tested against our observations. Finally, we derive that brown dwarfs are dynamically relaxed in the cluster, and we construct the Pleiades substellar mass function, proving it to be essentially similar to that of younger star clusters.
2 Observations and data analysis
2.1 Near-infrared images
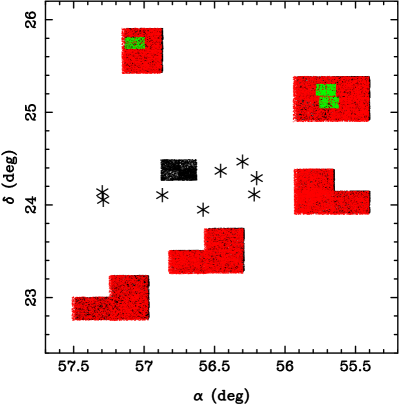
Deep - (1.2 m) and -band (1.65 m) images were acquired with the prime focus, wide-field infrared cameras Omega-Prime and Omega-2000 of the 3.5-m telescope on the Calar Alto Observatory in Almería (Spain). Omega-Prime has a Rockwell 1024 1024 pixel HgCdTe Hawaii array (1–2.5 m) with a pixel pitch of 03961 on the sky, giving a field of view of 676 676. Omega-2000 delivers a larger field of view of 1536 1536 provided by its 2048 2048 Hawaii-2 detector with a pixel scale of 045 on the sky. The first set of imaging data were obtained with the -band and Omega-Prime between October 29 and 31 in 1998. The total area covered in the Pleiades cluster was 0.9 deg2 (60 Omega-Prime pointings). Nine years later, we acquired the second set of images using the -band filter and Omega-2000 between October 29 and December 1 in 2007. The area covered by Omega-2000 entirely overlaps with that of Omega-Prime, except for a small portion immediately to the north of the cluster center. The common - and -band surveyed region is 0.8 deg2, covering patchy areas to the north, west, and south of the accepted Pleiades cluster center, as shown in Figure 1, and avoiding very bright stars that would cause strong saturation of the detectors and the Merope nebula, which is a source of significant extinction (Stauffer & Hartmann 1987, and references therein). All data were taken under photometric conditions with stable seeing between 09 and 12. Total on-source exposure times ranged from 9.6 to 14.9 min for the -band data, and from 1.5 to 2.55 h for the -band images, depending on the seeing. These data (main survey) represent the core of our photometric and astrometric search for the Pleiades least-massive population.
Additional supporting near-infrared images were acquired with the narrow-band methane filter and the High-Acuity, Wide-field -band Imaging (HAWK-I) instrument (Pirard et al. 2004) installed at one of the Nasmyth foci of the fourth Very Large Telescope (VLT) on Paranal Observatory (Chile), and with the - and -bands and the Long-slit Intermediate Resolution Infrared Spectrograph (LIRIS, Manchado et al. 1998) attached to the Cassegrain focus of the 4.2-m William Herschel Telescope (WHT) on Roque de los Muchachos Observatory (La Palma, Spain). HAWK-I delivers a on-sky field of view of 75 75 with a cross-shaped gap of 15″ between the four Hawaii 2RG 2048 2048 pixel detectors. The pixel scale is 0106. The central wavelength of the methane filter is 1.575 m, meaning that it explores wavelengths blueward of the strong methane absorption occurring at 1.6 m, and is well suited for studying T dwarfs (e.g., Peña Ramírez et al. 2011). LIRIS uses a 1024 1024 Hawaii detector with a pixel size of 025 on the sky, yielding a field of view of 427 427. HAWK-I images were acquired as part of program 088.C-0328 in queue mode between 2011 October 21 and December 30, and LIRIS data were taken in service and visitor modes on 2013 September 20 and October 10–13. Both HAWK-I and LIRIS observations were intended to follow-up a few candidates by obtaining additional photometry and proper motion measurements, therefore they cover much smaller areas (0.04 deg2) than the large main survey. Observing conditions were photometric, and seeing oscillated between 05 and 12. Exposure times were 24 min and 56 min for HAWK-I, and ranged from 18 to 66 min for LIRIS.
All images were observed employing a similar strategy, which included sequences of short individual exposures (80 s, depending on filter, seeing, and airmass during the observations) following a multipoint dither pattern for a proper subtraction of the sky background contribution. Raw data were processed using standard techniques and routines within the IRAF111IRAF is distributed by National Optical Astronomy Observatories, which is operated by the Association of Universities for Research in Astronomy, Inc., under contract with the National Science Foundation. (Image Reduction and Analysis Facility) environment. Sky-subtracted frames were divided by their corresponding flat-field images, registered, and stacked to produce deep data.
Final and frames of the main survey were calibrated in right ascension () and declination () using and coordinates (equinox J2000) of the Galactic Clusters Survey (GCS) program included in UKIDSS. Only common sources with tabulated photometric error bars lower than 0.1 mag were used for the astrometric calibration. The precision achieved was typically of a few tenths of a pixel (01–03).
2.2 Photometry
Aperture and point-spread-function (PSF) photometry was carried out using routines within the IRAF DAOPHOT package. First, sources were automatically identified with an algorithm that distinguishes between point-like and well-resolved objects (clear galaxies). Resolved sources with a full width at half-maximum (FWHM) slightly higher than the mean seeing were not removed from the final catalogs of detected objects, particularly at the faintest magnitudes, where the uncertainties associated with FWHM measurements are large. For each frame, we found the best-fit PSF by selecting 5 isolated reference stars that were homogeneously distributed across the field. Instrumental magnitudes were converted into observed magnitudes using the UKIDSS GCS photometry of sources with cataloged error bars better than 0.1 mag. Typically, we were able to find over 30 of these UKIDSS sources in common with Omega-Prime, Omega-2000, and LIRIS separated frames. The internal UKIDSS photometric calibration is addressed by Hewett et al. (2006) and Hodgkin et al. (2009). The typical error of the photometric calibration is 0.04 mag for all filters in our study.
The main survey extends from mag (excluding the bright nonlinear regime of the detectors) down to 21.5 mag at a 3–4 detection level, where stands for the sky background noise. We remark that not all images are as deep, particularly among the first-epoch data; the most shallow images roughly reach 21 mag. Completeness (defined at 10 above the sky background noise) is about mag. This survey is about 2 mag deeper than the observations of the Pleiades cluster carried out as part of the UKIDSS GCS project (see Lodieu et al. 2012). According to the evolutionary models provided by Chabrier et al. (2000a, and references therein), at the age, metallicity, and distance of the Pleiades, our main survey is sensitive to all masses from low-mass stars of 0.2 M⊙ to isolated planetary-mass objects of 0.008 M⊙ (or 8 MJup, corresponding to the limiting magnitude). The survey thus covers a factor of 25 in mass passing through two substellar boundaries: the hydrogen-burning mass limit at 0.072 M⊙ (Chabrier & Baraffe 1997; star–brown dwarf separation) and the deuterium-burning mass threshold at 0.012 M⊙ (Saumon et al. 1996; Burrows et al. 1997; Chabrier et al. 2000b; planetary frontier).

The data of the main survey were cross-correlated using and coordinates and a matching radius of 15, resulting in over 43,000 sources in common to the first- and second-epoch observations. All are plotted in the versus color-magnitude diagram illustrated in Figure 2.
2.3 Proper motions
As indicated in Section 2.1, our images were calibrated in and using UKIDSS GCS equatorial coordinates. In turn, UKIDSS GCS frames were calibrated against bright stars of 2MASS; because these stars might have their own motions, it is possible that separate UKIDSS frames have varying astrometric zero-points. This uncertainty may amplify if UKIDSS data are used to calibrate other frames taken on different occasions. Consequently, we did not obtain proper motions via the direct subtraction of (, ) coordinates between epochs since this procedure may be subject to uncontrolled systematic effects.
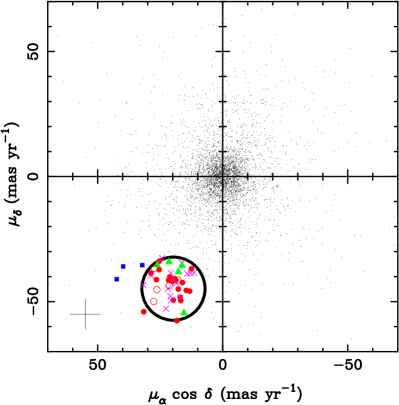
For the fine proper motion analysis between the first-epoch data (older data, Omega-Prime) and the recent Omega-2000, HAWK-I, and LIRIS images, we compared pixel (, ) coordinates frame per frame. We fit a third-order polynomial in and using IRAF tasks. A linear term and a distortion term were computed separately. The linear term included an and shift, an and scale factor, a rotation, and a skew. The distortion term consisted of a polynomial fit to the residuals of the linear term. We found that the first-epoch data were rotated by about 0.7 deg with respect to the second-epoch -band images. Between 100 and 150 sources per -band frame were used to establish the polynomial fits; they yielded equation transformations with a mean uncertainty of 0054 ( mas, about a tenth of the Omega-2000 pixel) for the main survey. Considering the 9 yr baseline between first- and second-epoch data, this error translates into mas yr-1 in proper motion units. This mean that the uncertainty increases to 13 mas yr-1 for sources with magnitudes close to the detection limit of the exploration. We determined this by quadratically combining the precision of the astrometric polynomial fits and the uncertainties associated with the calculation of the objects centroids. Figure 3 shows the proper motion diagram resulting from the astrometric study of the main survey. The mean proper motion uncertainty associated with the comparison of the first -band data and the very recent HAWK-I and LIRIS images is smaller because of the more optimal pixel scales of the latter instruments and the longer time intervals (13 and 15 yr) between observations.
To improve the quality of our proper motion measurements, we also employed the recent -band images acquired by the UKIDSS GCS project on 2009 August and 2010 October. UKIDSS images (50 50 and 80 80 in size) were downloaded from the archives with a pixel scale of 02015, and were compared with the 1998 -band Omega-Prime data, thus providing a time baseline of nearly 11 and 12 yr. Automatic object detection and proper motion analysis were conducted as previously explained, attaining astrometric precisions of 2.9 and 3.1 mas yr-1 in and . UKIDSS photometry as provided by the catalog was also used to complement the near-infrared magnitudes of our data down to the detection limit of the GCS observations, which typically is 18.4–18.7 mag at the 3 level.
3 Astrometric and photometric Pleiades candidates
Cluster member candidates are selected in the magnitude range = 15.5–21.5 mag. The bright boundary corresponds to spectral type M6.5 and to the star–brown dwarf separation for the age, metallicity, and distance of the Pleiades (Stauffer et al. 1998; Martín et al. 1998). It also coincides with the so-called re-appearance of the lithium absorption line at 670.8 nm in the optical spectra of Pleiades brown dwarfs (Rebolo et al. 1996; see also the review by Basri 2000, and references therein). The faint boundary stands for the detection limit of the main survey. Nevertheless, we claim entirety of identified Pleiades candidates from = 15.5 down to 20–20.3 mag, which is close to the completeness magnitude of the exploration. The final list of Pleiades candidates consists of sources that comply with the following astrometric and photometric criteria:
-
•
In the proper motion diagram of Fig. 3, we identified all sources with cos and motions contained within a circle of radius of 13 mas yr-1 around the mean proper motion of the cluster [(19.71, 44.82) mas yr-1, Lotkin & Beshenov 2003]. The size of the searching circle matches the quoted proper motion error bar of the faint sources in the main survey. Therefore, the astrometric search was performed at the 1- level for mag, and at the 2- level for the bright magnitudes, indicating that Pleiades members at the faintest magnitudes of our survey might have been lost. On the one hand, opening the proper motion circle up to 2- uncertainty at the faint end of the data would largely increase the number of non-Pleiades sources that contaminate our survey. On the other hand, the searching proper motion circle is greater in size than the velocity dispersion of Pleiades brown dwarfs reported in other studies (7–10 mas yr-1, Bihain et al. 2006; Casewell et al. 2007). We provide more details on the proper motion dispersion of Pleiades members in Section 5.
-
•
The least massive Pleiades objects spectroscopically and astrometrically confirmed so far are classified in the near-infrared with types of early-L through L4.5 (Bihain et al. 2010). They have mag; consequently, the Pleiades photometric sequence is reasonably described down to these magnitudes (Bihain et al. 2010; Lodieu et al. 2012, and references therein). Figure 5 shows the near-infrared color-magnitude diagrams of low-mass Pleiades members with spectra published in the literature (UKIDSS photometric system is used). Our newly selected proper motion candidates in the interval = 15.5–18.8 mag must follow the Pleiades sequence within the claimed photometric uncertainties and cluster dispersion in all color-magnitude diagrams to be considered photometric cluster member candidates.
-
•
Beyond mag and spectral type L4.5, the Pleiades sequence remains fully unknown. Discovering less luminous and cooler cluster sources is the main objective of this work. We did not assume any particular and/or color cuts; we allowed for both a natural extension of the known sequence toward redder indices and fainter magnitudes, and a possible sequence turn-over toward blue and/or colors, which would be expected if atmospheric methane absorption appears at near-infrared wavelengths. We left the proper motion study and the photometric criterion described next to reveal the true faint sequence of Pleiades members.
-
•
Because it is expected that true Pleiades members fainter than = 18.8 mag display spectral types cooler than L4.5, we imposed red optical-to-near-infrared color cuts based on field dwarfs with UKIDSS photometry (see Hewett et al. 2006) and the previous works on the Pleiades by Lodieu et al. (2007, 2012), i.e., mag, or nondetection in the UKIDSS -band.
-
•
Finally, all candidates were visually inspected, and all images available to us were blinked to check that there is a motion in the direction of the Pleiades to the naked eye.
| Unresolved, photometric nonmembers ( mag). | |||||||
|---|---|---|---|---|---|---|---|
| Object | RA, DEC (J2000) | cos , | a𝑎aa𝑎aNumber of proper motion measurements. | b𝑏bb𝑏bThis paper. | b𝑏bb𝑏bThis paper. | c𝑐cc𝑐cFrom UKIDSS GCS, with a few indicated exceptions. | d𝑑dd𝑑dStandard deviation of the mean proper motion measurement computed for . |
| (h m s), (∘ ′ ′′) | (mas yr-1) | (mag) | (mag) | (mag) | (mas yr-1) | ||
| PNM01 | 3 48 41.99 22 54 58.2 | 18.6 5.7, 42.6 6.6 | 2 | 15.90 0.04 | 15.35 0.02 | 15.15 0.01 | |
| PNM02 | 3 41 50.77 25 16 34.9 | 21.0 5.7, 47.8 6.6 | 1 | 16.10 0.05 | 15.56 0.01 | 15.26 0.01 | |
| PNM03 | 3 48 07.02 22 56 39.7 | 28.7 5.7, 39.6 6.6 | 2 | 16.10 0.04 | 15.54 0.03 | 15.26 0.01 | |
| PNM04 | 3 48 31.36 25 42 57.1 | 20.7 5.7, 38.6 6.6 | 2 | 16.48 0.03 | 15.93 0.01 | 15.66 0.02 | |
| PNM05 | 3 48 03.19 23 12 05.8 | 22.7 5.7, 52.8 6.6 | 2 | 16.56 0.04 | 15.95 0.03 | 15.71 0.02 | |
| PNM06 | 3 42 06.21 25 04 31.0 | 16.3 5.8, 34.6 6.8 | 2 | 16.61 0.04 | 16.02 0.01 | 15.70 0.01 | |
| PNM07 | 3 41 51.98 25 13 00.5 | 12.9 5.8, 38.6 6.8 | 2 | 16.73 0.02 | 16.32 0.01 | 16.21 0.02 | |
| PNM08 | 3 48 32.26 25 42 57.0 | 19.9 5.8, 40.8 6.8 | 2 | 16.96 0.04 | 16.50 0.01 | 16.19 0.03 | |
| PNM09 | 3 43 07.44 25 15 59.9 | 31.8 5.9, 43.4 11.0 | 2 | 17.31 0.07 | 16.62 0.04 | 16.29 0.02 | |
| PNM10 | 3 47 58.00 25 49 12.5 | 24.3 5.9, 32.6 7.0 | 2 | 17.47 0.04 | 16.93 0.01 | 16.56 0.04 | |
| PNM11 | 3 48 03.95 22 52 37.2 | 16.9 5.9, 48.3 7.0 | 3 | 17.60 0.03 | 17.04 0.03 | 16.75 0.05 | 1.0, 2.5 |
| PNM12 | 3 42 47.10 25 11 57.1 | 11.5 6.0, 38.5 7.1 | 2 | 18.05 0.04 | 17.56 0.03 | 17.18 0.04 | |
| PNM13e𝑒ee𝑒eClose to - and/or -band frame border, large uncertainty in both photometric and astrometric data. | 3 43 09.51 25 16 06.1 | 20.7 8.0, 49.5 9.0 | 2 | 19.18 0.16 | 18.43 0.05 | 18.22 0.11 | |
| PNM14 | 3 48 00.32 25 41 24.3 | 21.9 8.0, 44.8 9.0 | 3 | 19.23 0.05 | 18.63 0.03 | 18.04 0.18 | 9.9, 2.0 |
| PNM15 | 3 48 39.08 22 53 15.9 | 14.2 8.0, 38.9 9.0 | 3 | 19.36 0.07 | 18.97 0.05 | 18.51 0.20 | 20.0, 4.4 |
| Unresolved objects with mag and a proper motion larger than the explored astrometric circle. | |||||||
|---|---|---|---|---|---|---|---|
| Object | RA, DEC (J2000) | cos , | b𝑏bb𝑏bThis paper. | b𝑏bb𝑏bThis paper. | c𝑐cc𝑐cFrom UKIDSS GCS, with a few indicated exceptions. | ||
| (h m s), (∘ ′ ′′) | (mas yr-1) | (mag) | (mag) | (mag) | (mag) | (mag) | |
| NPM01e𝑒ee𝑒eClose to - and/or -band frame border, large uncertainty in both photometric and astrometric data. | 3 41 58.20 23 54 44.1 | 39.8 10.8, 35.9 10.1 | 19.95 0.08 | 18.94 0.03 | 17.92 0.10 | 16.80 0.10 | 16.46 0.27 |
| NPM02 | 3 43 08.58 23 57 10.0 | 32.2 9.6, 35.4 9.8 | 20.35 0.15 | 19.84 0.06 | 18.72 | ||
| NPM03 | 3 47 07.35 23 21 56.0 | 42.4 11.7, 41.0 10.7 | 20.44 0.10 | 20.36 0.06 | 20.19 0.15f𝑓ff𝑓fLIRIS measurement. | ||
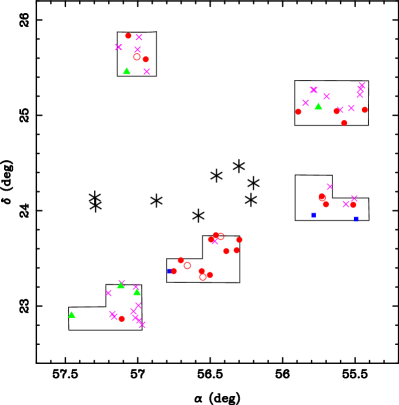
A total of 44 sources of the main survey pass the astrometric criterion. They are shown separated into different groups, as explained next, in the (, ) plane (Figure 4) and in the versus , color-magnitude diagrams (Figure 5). Out of 44, 29 (Table 1) comply with all the photometric requirements. Nineteen have two or more proper motion measurements or have been previously identified in other studies (Pinfield et al. 2000; Nagashima et al. 2003; Lodieu et al. 2012), that is to say, they have been detected and selected on various occasions. This group of 19 represents the list of unresolved candidates with the highest probability of being genuine Pleiades members. In the top panel of Table 1 we provide the derived and coordinates from the 2007 -band images, proper motions (equally weighted mean values whenever two or more measurements are available), the number of proper motion measurements ( main survey, data coming from UKIDSS GCS images, and follow-up data obtained by us as indicated in Section 2.1), and the standard deviation of the proper motions if there are three or more astrometric measures. The low values of the proper motion standard deviations suggest that the quoted astrometric error bars are likely overestimated particularly for the bright magnitudes. Table 1 also lists the names for all newly proposed substellar candidates after Stauffer et al. (1994), Rebolo et al. (1995), and Zapatero Osorio et al. (1997), meaning that names agree with the observatory in which they were observed, followed by the word Pleiades, and numbered according to their increasing -band apparent magnitude. The last column of the top panel of Table 1 indicates other names for known objects. The UKIDSS GCS survey of Lodieu et al. (2012) has covered the entire area of our exploration, yet about 31% of the 13 candidates between = 15.5 and 18.8 mag were missed in their work, probably because of the different approach in the analysis of proper motions and the distinct color-magnitude diagrams for object selection employed by the two groups.
Of the 29 photometric and astrometric candidates, five ( mag) appear to be unresolved and have one proper motion measurement because they are not detected in any passband of UKIDSS GCS and are not contained in any of our follow-up images. Another five (also among the faintest candidates) appear to have slightly resolved FWHMs in the -band frames, which are the deepest images in all explored data. These two groups are listed in the middle and bottom panels of Table 1. We remark that for mag, even point-like candidates may be extragalactic objects that are not spatially resolved at the seeing of our observations or are too faint and have uncertain FWHMs particularly in the - and -bands.
Of the original 44 astrometric candidates, 15 are photometric nonmembers since their and/or colors deviate from the known Pleiades sequence, or they have blue UKIDSS colors. Nevertheless, we list them in the top panel of Table 2 for future works.
Complementary to the explored astrometric circle depicted in the ( cos , ) plane of Fig. 3, we also investigated faint sources with mag, motions similar to that of the Pleiades cluster, and cos displacements beyond the circle toward the east and up to 2- the corresponding astrometric uncertainty. Three objects were found and are listed in the bottom panel of Table 2. These data were used to estimate possible contaminants at the faintest magnitudes as well as the feasibility of the survey to detect very dim sources with near-infrared colors from blue to very red indices.
For all 44 sources, our and cataloged UKIDSS photometry (when available) is given in Tables 1 and 2. In case of nondetections, we provide the limiting magnitudes at the 3 level computed for each individual UKIDSS GCS frame. For two objects, Calar Pleiades 21 (hereafter Calar 21) and NPM03, we derived the magnitudes using LIRIS data obtained on 2013 October 11. Calar 26 (the faintest object in the top panel of Table 1) was not detected automatically by the UKIDSS GCS pipeline; however, visual inspection of the downloaded image reveals a faint source near the location of our candidate. The measured Omega-prime versus UKDISS GCS proper motion of Calar 26 agrees with the main survey value within the astrometric uncertainties. LIRIS and UKIDSS photometry of Calar 21, 26, and NPM03 was derived as described in Section 2.2, and is provided in Tables 1 and 2.
Additionally, the and coordinates of our objects were cross-correlated against the WISE catalog (Wright et al. 2010) to obtain their mid-infrared colors. WISE data are given in Tables 1 and 2. We used a cross-correlation radius of 2″ and considered (3.3526 m) and (4.6028 m) magnitudes for which the catalog claims detections with signal-to-noise (S/N) ratios of 3 and higher. The great majority of our sources are not detected at longer wavelengths. Note that despite the generous matching radius, the differences in the equatorial coordinates between the and WISE sources are always smaller than 1″, except for Calar 26, where we found a difference of 199, thus suggesting that the WISE source may not be the same as the one. We exclude Calar 26 from the color-magnitude diagrams involving WISE data throughout this work.
4 Pleiades photometric sequence
4.1 Contaminants
Before proceeding with the description of the Pleiades photometric sequence properties and mass function, we need to discuss the expected object contamination. Our own survey can be used as the basis for studying the number of possible contaminants throughout all the magnitude intervals of interest. In Fig. 5, between the substellar limit ( mag) and the completeness magnitude of the main survey ( mag), there are 13 objects with proper motion and photometry consistent with Pleiades membership, and 15 sources whose photometry is not compatible with that of the cluster. This suggests that the initial astrometric sample of unresolved objects suffers from a contamination of about 50% in the magnitude interval mag. Note that this contamination fraction results from the multiwavelength inspection of the data: Within this magnitude range, bona fide substellar Pleiades members show well-constrained red and colors typical of mid-M through late-L types, while the astrometric contaminants display bluer colors typical of early- and mid-M types.
By extrapolating the astrometric contamination fraction of 50% below the survey completeness, of the initial 11 astrometric, unresolved candidates with mag only about 5–6 would be true Pleiades members and the other half would be unrelated to the cluster. This contaminating count coincides with the number of faint, near-infrared blue and red sources populating regions immediately adjacent to the astrometric circle described in Sect. 3 and shown in Fig. 3 (the three actual detections of the region to the east of the astrometric circle must be conveniently scaled by a factor of 1.5 to account for the ratio between the two explored proper motion areas). Furthermore, a similar count (3) of L5–T5 field dwarf contaminants would be expected in the range of mag and in a survey like ours that covers an area of 1 deg2 according to the recipes by Caballero et al. (2008). Note that all of our faint candidates show colors typical of L and T dwarfs. Therefore, we used 13 and 6 tentative cluster members in the intervals and mag, respectively, to derive the cluster mass function in Sect. 6.
All 11 astrometric point-like candidates with span a wide range of colors (Figure 5). Seven of them have -band detections displaying quite red colors, and for six out of seven (see Table 1) we were able to confirm their proper motion measurements via third-epoch images. We have least confidence that the five unresolved candidates with just one proper motion derivation are reliable Pleiades member candidates. More follow-up data are required to confirm their cluster membership status. In contrast, the six unresolved sources with detections in UKIDSS and LIRIS are noteworthy because their proper motions are double-checked, which makes these objects very promising low-mass Pleiades candidates. Furthermore, they have photometric properties that differ from those of the field in a way described in the following sections. We rely on these six sources to characterize the Pleiades photometric sequence at very faint magnitudes.
Extragalactic objects may also be a source of contamination in our survey, particularly at the faint end, where the proper motion uncertainties are large and the extragalactic population increases significantly. Given the good seeing of some data, we were able to identify five (out of a total of 16) possibly resolved objects in the interval , which are not considered further in this paper. As discussed in Bihain et al. (2009), mid-L to mid-T type dwarfs are distinguishable from the great majority of galaxies in optical-to-near-infrared color-color diagrams since the dwarfs have very red colors, while the galaxies tend to be bluer. By placing the six mag UKDISS and LIRIS unresolved candidates in the color-color and color-magnitude diagrams of Bihain et al. (2009), which include the galaxies from the GOODS-MUSIC catalog (Grazian et al. 2006), we observed that most seem to fall in regions of very low density extragalactic population. Furthermore, our candidates with the reddest colors are very likely Galactic sources since they tend to fall at indices redder than those of the GOODS-MUSIC galaxies. Only follow-up spectroscopy will be able to discern how many galaxies there are in our final list of unresolved faint Pleiades candidates of Table 1.
4.2 Color-magnitude diagrams
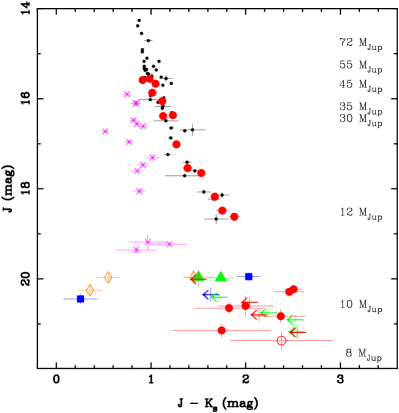
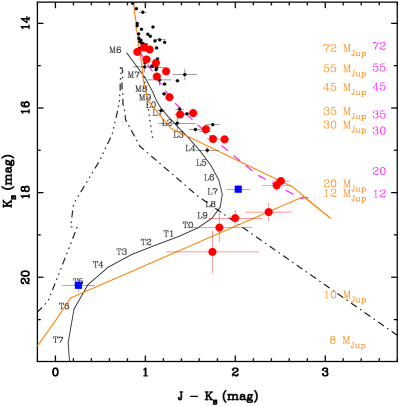
Various combinations of near- and mid-infrared color-magnitude diagrams are depicted in Figs. 6 and 7, where only the 136 most promising Pleiades member candidates are shown; these are the unresolved candidates with two or more proper motion measurements. The sequences defined by these objects become increasingly red from mag down to mag, thus indicating that any color turn-over of the Pleiades sequence must occur beyond . The reddest , , , and indices of cluster member candidates are measured at 1.5, 2.5, 3.8, and 5.0 mag, respectively. With the exception of the versus diagram of Fig. 7, fainter cluster candidates appear to have bluer indices, particularly those involving the band, suggesting that either they are contaminants or the color-magnitude disposition of Pleiades members turns to blue colors at mag. To confirm this finding, follow-up spectroscopic observations need to be obtained to determine the nature of our candidates.
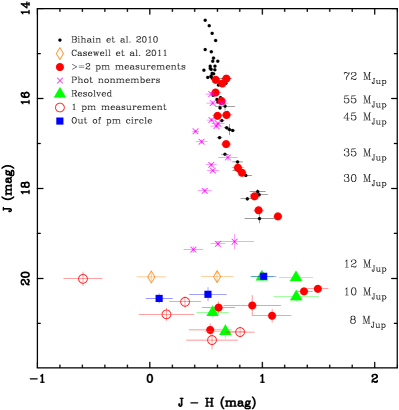
The very red colors of our -mag candidates contrast with the objects discovered by Casewell et al. (2007, 2010), who found tentative proper motion T-type Pleiades members with blue colors at about (see Figure 5). A few of their most interesting ”blue” candidates were followed-up photometric and spectroscopically with methane filters from the ground, and with Spitzer and the Hubble Space Telescope (HST) from space by Casewell et al. (2011) and Lucas et al. (2013). None appears to have methane absorption, their mid-infrared colors are unexpected for normal dwarfs, and the HST image of the Pleiades candidate PLZJ 93 shows a diffuse halo, demonstrating that it is not a T dwarf; it very likely is an external galaxy. We remark that extragalactic objects constitute one critical source of contamination in very deep surveys like the one carried out by Casewell et al. (2007) and ours.
Another striking property of the photometric sequences shown in Figures 6 and 7 is the apparent lack of candidates or a less populated magnitude domain in the interval mag, in contrast to the nice and homogeneous object continuity above and below this signature. Furthermore, this apparent hole falls within the completeness magnitude of our survey; we thus conclude that it is a real feature of the Pleiades substellar sequence. This attribute significantly reduces in size or becomes even imperceptible at longer wavelengths (e.g., and the WISE filters), probably because of the dramatic change toward redder colors of cluster member candidates with mag. As is illustrated in the -band panels of Figures 6 and 7, this feature in appears to lie in the interval 17–17.7 mag, which is half as large as that of the band, and no obvious discontinuity is observed in the or magnitudes.
The physical origin of this property is yet to be explained; however, it may be related to the increasing presence of dust in the upper photospheric layers of ultracool dwarfs with low-gravity (or low-pressure) atmospheres and decreasing effective temperature, and/or the possible existence of warm dusty (debris) disks (or rings) very near the central objects, which would make Pleiades low-mass substellar members appear very red and somehow “extinguished” at 1 m (see next). The current knowledge of the formation and evolution of debris disks around substellar sources and their relation to the central objects properties is very scarce; therefore, this possibility, although less explored in the literature than the atmospheric dust scenario, cannot be discarded. These two views have been discussed in other studies to account for the very red near-infrared colors of ”young” field dwarfs (e.g., Zapatero Osorio et al. 2010, and references therein; Gizis et al. 2012, and references therein; Faherty et al. 2012, 2013, and references therein).
4.3 Comparison with the field
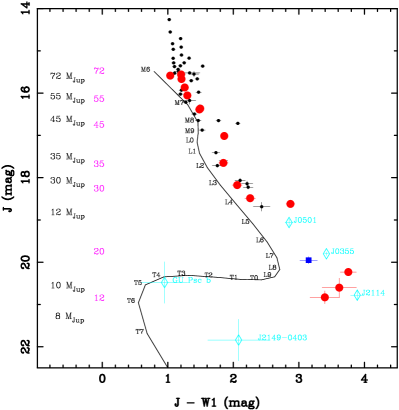
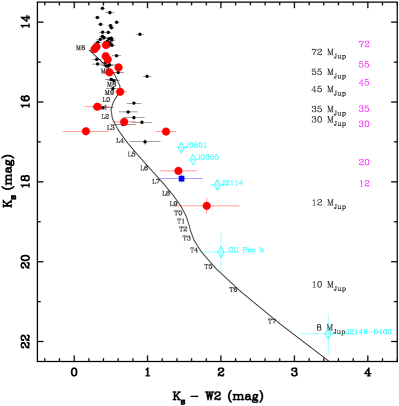
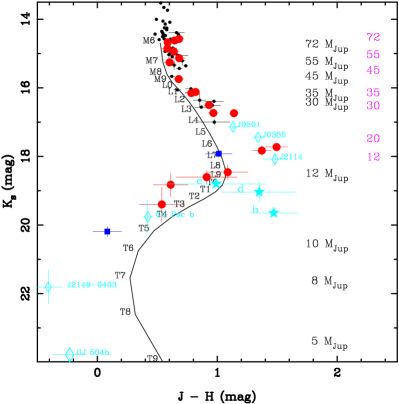
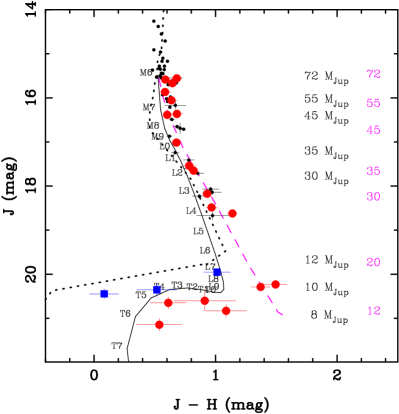
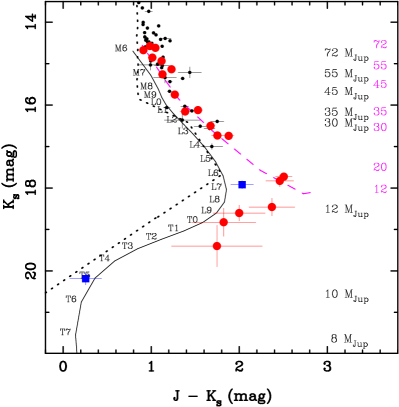
The defined Pleiades photometric sequence is compared with the sequence of field M, L, and T-type dwarfs in Fig.s 6 and 7. For the field we adopted the polynomial fits of Mauna Kea Observatory and WISE absolute magnitudes as a function of spectral type for all bands given in Table 14 by Dupuy & Liu (2012). These fits have a typical scatter of 0.4 mag. Absolute magnitudes were taken to the distance of the cluster. Based on the colors of field dwarfs, our objects have near- and mid-infrared indices that cover spectral types from M6.5 through early-Ts. Globally, the field sequence seems to follow the general trend described by the Pleiades candidates in all color-magnitude diagrams.
However, we observe some discrepancies. From down to 18.8, 16.8 mag, Pleiades members appear slightly overluminous in and with respect to the field, as expected for their young age (according to the theory of substellar evolution, Pleiades low-mass objects must be undergoing self-gravitational contraction). Bihain et al. (2010) discussed that these objects, which have late-M and mid-L types, appear modestly redder in the near-infrared than their spectral counterparts in the field. Cluster member candidates with and mag (Calar 21 and 22) also show up redder than the field in all , , , and colors by significant amounts of 0.5–1 mag. Fainter candidates display an heterogeneous behavior in the various near- and mid-infrared color-magnitude diagrams: While they emerge redder than the field in , , and , their colors turn to blue values, typically lying above and below the field sequence in the versus (Fig. 7) and the versus (Fig. 6) panels. This implies that the flux at 1.2 m is notoriously suppressed and the flux at 2 m is enhanced.
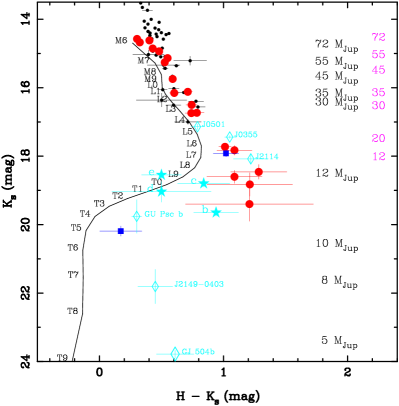
A related behavior has been reported for L-type dwarfs in the field that are suspected to have young (intermediate) ages from the distinct low-gravity features in their optical and/or near-infrared spectra (e.g., Liu et al. 2013; Schneider et al. 2014; see also review by Luhman 2012, and references therein). For comparison purposes, in Fig. 7 we plot three of these objects taken to the distance of the Pleiades: 2MASS J035523371133437 (L5, Reid et al. 2006), 2MASS J050124060010452 (L4, Reid et al. 2008), and PSO J318.533822.8603 (L71, Liu et al. 2013). Their 2MASS photometry was transformed into the UKIDSS system using the equations given in Hodgkin et al. (2009), and spectral types are taken from the calibration of Cruz et al. (2009) and Liu et al. (2013). All three are believed to be free-floating and have trigonometric parallaxes and WISE photometry available in Faherty et al. (2013), Liu et al. (2013), and Zapatero Osorio et al. (2014). According to these authors, the three field sources may have an age most similar to that of the Pleiades, very likely within the interval 50–500 Myr. Their location in the color-magnitude diagrams nicely overlaps with the Pleiades. We conclude that our Pleiades member candidates may become benchmark objects for understanding the young population of isolated ultracool dwarfs in the field.
Our data may also be useful in interpreting the properties of giant planets orbiting stars in the solar neighborhood. The four objects around HR 8799 discovered by Marois et al. (2008, 2010), and the planet companions to GJ 504 (Kuzuhara et al. 2013) and GU Psc (Naud et al. 2014) are shown in the panels of Fig. 7. Although still debated, the age of the HR 8799 system may be compatible with 100 Myr (see discussion in Oppenheimer et al. 2013, and references therein). We derived the mean , , and photometry of all four HR 8799 bcde planets from the values published in the literature (Marois et al. 2008, 2010; Esposito et al. 2013; Oppenheimer et al. 2013); plotted error bars represent the (large) dispersion of the measurements. According to Kuzuhara et al. (2013), the age of GJ 504 is estimated at 160, in agreement with the Pleiades age. The revised photometry of the late-T/early-Y GJ 504 b companion provided by Janson et al. (2013) was employed. Naud et al. (2014) discussed at length that the GU Psc system, consisting of an M3 star and a T3.5 planet, is most likely a member of the AB Doradus moving group, which is coeval with the Pleiades (Luhman et al. 2005). To complete the list of late-L and T-type dwarfs from the literature with ages compatible with 120 Myr and known (or constrained) distance, we include in all panels of Fig. 7 the T7 source CFBDSIR J214947.2040308.9 (J21490403) discovered by Delorme et al. (2012). According to the authors, this object is also very likely a member of the AB Dor moving group. All objects have been taken to the distance of the Pleiades in Fig. 7. In the case of the AB Doradus moving group we adopted an average distance of 45 10 pc, which explains the large uncertainties in the and magnitudes of AB Dor objects shown in the figure. The location of the three farthest companions (bcd) of HR 8799 are compatible with the least-massive Pleiades population at the 1- level. Only the innermost companion (e) displays a deviating color (although at the 2- level). Interestingly, the location of GU Psc b in the diagrams appears to be quite similar to that of our faintest candidate (Calar 26), suggesting that Calar 26 may be a T3.5 free-floating planet in the Pleiades. GJ 504 b and J21490403 fall at significantly fainter magnitudes; however, their locations in the color-magnitude panels of Fig. 7 are compatible with a smooth extrapolation of the Pleiades sequence toward lower luminosities (considering the large error bars associated with the faintest Pleiades candidates). Our candidates, GU Psc b, J21490403, and GJ 504 b, might be tracing the substellar sequence from the star–brown dwarf frontier through 5–8 MJup at the age of 120 Myr.
As claimed by Liu et al. (2013), PSO J318.533822.8603 is the reddest known field isolated dwarf, which is assigned L71 spectral type and effective temperature K. After comparison with our data, the reddest Pleiades member candidates with mag may share a similar classification. Candidates extending down to fainter magnitudes are expected to have cooler effective temperatures and to display even later typings; they are probably entering into the methane-absorption regime (T types). This agrees with the location of the possible color turn-over observed in the Pleiades sequence and the tentative detection of methane absorption in the planets of HR 8799 and GJ 504 (Oppenheimer et al. 2013; Janson et al. 2013). Nevertheless, spectroscopic observations are strongly demanded to characterize the very low luminous domain of the Pleiades in more detail.
That our survey is sensitive to the detection of standard L–T transition and T-type dwarfs is demonstrated by the discovery of three sources with colors typical of these spectral classifications and proper motions in greater than the defined astrometric selection of Fig. 3 (see Sect. 3). These objects are included in Figs. 6 and 7. Given their photometric and astrometric properties, they might be Pleiades member candidates since their proper motion error bars touch the circle of the astrometric selection criterion (less likely) or unrelated field late-L and T dwarfs, white dwarfs, and/or low-metallicity dwarfs.
4.4 Comparison with evolutionary models
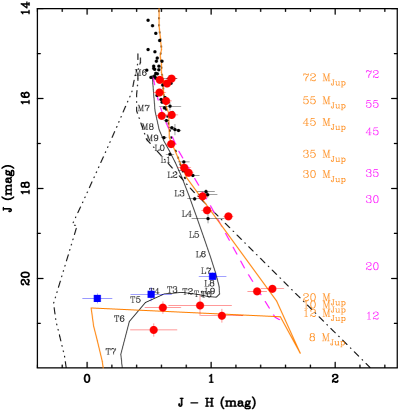
Two 120 Myr isochrones from the Lyon group are displayed in the top panels of Fig. 6: One track (dotted line) uses the magnitudes and colors predicted for each mass by model atmosphere synthesis, while the observable magnitudes of the other track (dashed line) were computed using bolometric corrections (see below). A solar metallicity was adopted for the two cases. Regarding the former track, we used the theoretical luminosities and temperatures given by Chabrier et al. (2000a), and the colors computed with the BT-Settl model atmospheres by Allard et al. (2012); we ensured that the computed colors are in the same photometric system as our data. The BT-Settl models account for the settling of some dust species from the photosphere, in contrast with the DUSTY models (which included dust formation, but once dust is formed, it remains in the atmosphere, Chabrier et al. 2000a), the COND models (which neglect the effect of dust opacity in the radiative transfer, Baraffe et al. 2003), and the NextGen models (which did not account for dust formation, Hauschildt et al. 1999). It is accepted that atmospheric dust formation (Tsuji et al. 1996) becomes efficient at temperatures typically below 2700 K and makes objects redder in all wavelengths (Allard et al. 1997). From the top panels of Fig. 6, it becomes apparent that the BT-Settl 120 Myr theoretical track does not reproduce the observations in two ways: the synthetic colors predict the appearance of methane absorption (sequence turnover) earlier than observed, and these colors are never as red as those of faint Pleiades member candidates.
It is also customary to employ evolutionary models and empirical bolometric corrections (BCs) valid for high-gravity field dwarfs to convert predicted and luminosities into observables. This is because the Pleiades and field stars of related temperatures share similar properties. This would improve the comparison between the Pleiades sequence and the theory from down to mag; however, the reddening observed at fainter near-infrared magnitudes would still need to be fit. To overcome this problem, we built the 120 Myr isochrone shown with a dashed line in Fig. 6 as follows: In the interval mag we used the empirical BCs available in the literature for field dwarfs with a spectral classification between M6 and L3–L5 or 2700 K to 1800–1500 K (Dahn et al. 2002; Vrba et al. 2004; Golimowski et al. 2004; Stephens et al. 2009), and the predicted ’s and luminosities given by Chabrier et al. (2000a). For later types, we obtained the average and colors of field dwarfs reported to have spectral features typical of low-gravity atmospheres and a reddish behavior at long wavelengths (Cruz et al. 2009; Gizis et al. 2012; Liu et al. 2013, and references therein), and the BCs specifically derived for a few of them by Todorov et al. (2010), Zapatero Osorio et al. (2010), and Liu et al. (2013). These authors found differing BCs between the young and the standard field dwarfs of similar classification. This agrees with the statements made by Luhman (2012) and Faherty et al. (2012) that low surface gravity L dwarfs require a new set of BC/absolute magnitude calibrations. BCs for young cooler types are lacking in the literature; the newly derived 120 Myr track (semi-empirical model) ends at K (0.012 M⊙). The uncertainty associated with this isochrone is 0.2 mag in the derived red near-infrared colors. As illustrated in Fig. 6, this isochrone nicely reproduces the trend delineated by the Pleiades sequence from the substellar limit through the deuterium-burning mass threshold: It is slightly more overluminous than the field sequence and becomes increasingly redder in and down to mag.
The NextGen, DUSTY, and COND solar-metallicity 120 Myr isochrones are depicted in the bottom panels of Fig. 6. We used the predicted observable magnitudes provided by the theory. None of these models is able to conveniently reproduce the Pleiades substellar sequence. Only the NextGen track successfully delineates the cluster trend at the brightest near-infrared magnitudes that include low-mass stars. This was previously discussed by, e.g., Zapatero Osorio et al. (1997), Martín et al. (2000), and Pinfield et al. (2003). Pleiades sources remain consistent with the NextGen model (and inconsistent with the DUSTY and COND models) down to values of 2400 K (or 0.055 M⊙), coinciding with the expected temperature for dust formation. In the bottom panels of Fig. 6 we show a combined NextGenDUSTYCOND isochrone computed for solar metallicity and 120 Myr as follows: For temperatures between 2400 and 1100–1200 K, the DUSTY and COND predicted magnitudes were averaged to account for a situation intermediate between the extreme cases represented by the two models (i.e., formation of condensates, opacity increase due to the presence of dusty species, and partial sedimentation of grains). Below 1100 K, where all dust is supposed to lie below the photosphere, only the COND models were used. DUSTY and COND magnitudes were shifted to match the NextGen track that fits the data at the warmest temperatures. The resulting isochrone, which we remark was produced for illustrative purposes alone, is displayed with a continuous line in the bottom panels of Fig. 6. This track gives a better qualitative fit to the Pleiades sequence than the individual models, thus proving that dust formation and an increasing opacity at blue wavelengths provide a reasonable explanation for the observed reddening of the cluster sequence down to mag, K, and mass of 0.012 M⊙. At fainter magnitudes or lower temperatures and masses, dust precipitation below the photosphere appears to gain importance.

Note that the mass estimates (indicated in all panels of Figs. 6 and 7) based on the newly derived isochrones differ from those obtained from the BT-Settl synthetical colors. In the luminosity interval of our study, the discrepancy can be as large as a factor of 2 in mass at the faintest magnitudes and for the band. Discrepancies are smaller and reversed for the filter. The masses provided by the NextGenDUSTYCOND isochrone agree better with those obtained from the semi-empirical model. This latter model yields greater masses for a given observed magnitude. For example, the deuterium-burning mass limit would be located at mag (new 120 Myr isochrone), in contrast with the values of mag given by the BT-Settl synthetic colors track. Following the new derivation, Pleiades candidates Calar 21–26 have masses near the deuterium-burning mass limit, thus becoming excellent targets for the observation of deuterium in their atmospheres.
5 Proper motion dispersion
As shown in Tables 1 and 2, within the survey completeness, the proper motion standard deviations of individual Pleiades candidates typically fall between 1 and 3.8 mas yr-1, the median value is 1.7 mas yr-1 . This is generally smaller than the quoted astrometric uncertainties. By assuming that 1.7 mas yr-1 is close to the true error in the proper motion determination of Pleiades candidates with magnitudes in the interval = 15.5–19, we derived that the proper motion dispersion (or scatter) of cluster members with masses between 0.072 and 0.025 M⊙ (see Sect. 4.4) is = 6.7 1.7 mas yr-1. The averaged motions are estimated at = 19.6 mas yr-1 and = 41.9 mas yr-1. For fainter magnitudes and smaller masses ( = 19–21 mag, 0.012–0.025 M⊙), proper motion measurements have larger uncertainties and standard deviations, yet we obtained a motion dispersion of = 9.7 6.1 mas yr-1 and mean motions of = 21.6 mas yr-1 and = 47.6 mas yr-1. The mean motions of the two mass intervals agree with that of the cluster (Lotkin & Beshenov 2003) at the 1- level. The proper motion dispersion estimates, , include the scatter of the astrometric errors. In what follows it is assumed that the distribution of proper motions and errors is Gaussian. The results can be corrected for the errors by applying the equation
| (1) |
The corrected proper motion dispersions, , are 6.4 1.7 mas yr-1 and 7.5 6.1 mas yr-1 for the mass intervals 0.072–0.025 M⊙ and 0.025–0.012 M⊙. With our data, the detection of motion dispersion in the Pleiades brown dwarf regime is at the level of 3.5 for cluster objects with 0.072–0.025 M⊙.
The corrected values are plotted against mass in Fig. 8. These data are complemented with the proper motion dispersion obtained for Pleiades very low-mass stars with masses ranging from 0.1 to 0.15 M⊙ identified in the survey. These stars have mag; they were selected following the same astrometric and photometric criteria as described in Sect. 3. Additional proper motion dispersions obtained for different mass intervals by other groups are also plotted in Fig. 8: stars from Jones (1970), van Leeuwen (1980), and Pinfield et al. (1998), and brown dwarfs (0.022–0.055 M⊙) from Bihain et al. (2006). Our determinations for substellar cluster members and that of Bihain et al. (2006) agree within the quoted uncertainties as illustrated in the figure. Substellar Pleiades objects show a proper motion dispersion higher by a factor of 6–7 than solar-mass stars. By excluding the least-massive bin of Pinfield et al. (1998), which appears to deviate from a straight line in the log-log representation of Fig. 8, we fit all data points following a power-law expression: . We found = and a fit rms of 0.074 in units of log (). The resulting fit is shown in Fig. 8 by the dashed line. The measured slope is fully compatible with the energy equipartition theorem, where the velocity dispersion scales with mass as , which agrees with the presence of mass segregation within the mass coverage shown in Fig. 8 and with the dynamical relaxation status of the cluster as discussed in Jameson et al. (2002, and references therein). At the distance of 133.5 pc (Soderblom et al. 2005), the measured substellar proper motion dispersions translate into velocity dispersions of 4–5 1.0 km s-1.

6 Pleiades substellar mass function
To build the cluster mass spectrum of the surveyed 0.8 deg2 area (number of objects per linear mass unit, d/d), we first counted the number of Pleiades member candidates per and magnitude interval (similar to the luminosity function) and then applied the mass–magnitude relationship given by the evolutionary models. The solar-metallicity 120 Myr isochrones discussed in the previous section were considered: The isochrone of synthetic colors spanning a large mass interval and covering the magnitude range of our survey, and the semi-empirical isochrone extending from the low-mass star domain down to the deuterium-burning mass boundary at 0.012 M⊙. For the former isochrone we used the -band predictions because these are closer to those of the semi-empirical track. For the latter track, either or magnitudes yield similar results. Given the small number of Pleiades candidates (19, see Section 4), we fixed the minimum number of objects per mass bin at 5. This is to give statistical weight to the mass spectrum derivation, which is depicted in the left panel of Fig. 9. The two substellar-mass spectra are consistent within the quoted error bars. The incomplete mass bin is indicated with an upper arrow in the figure.
The Pleiades mass spectrum appears rather flat within the uncertainties from the substellar frontier to the deuterium-burning mass limit. Our data points in Fig. 9 are consistent with the power law expression d/d , where lies in the interval 0–1. This functional form and index range are widely discussed in other studies dealing with young star clusters and star associations with ages between 1 and 100 Myr (e.g., Moraux et al. 2003, and references therein; Bihain et al. 2006, and references therein; Lodieu et al. 2012, and references therein; Scholz et al. 2012, and references therein; Luhman 2012, and references therein). There is no obvious mass cutoff in the Pleiades cluster down to 0.012 M⊙, which roughly coincides with the completeness of the main survey. Furthermore, our observations suggest that the cluster mass function extends beyond the deuterium-burning mass borderline into the planetary-mass regime.
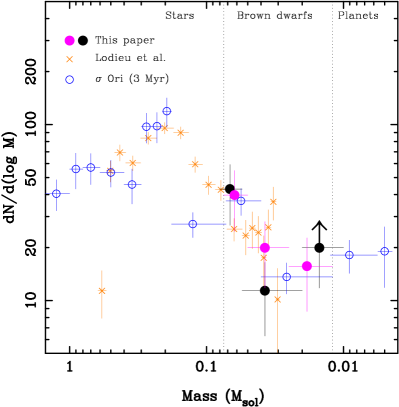
For comparison purposes, we included in the left panel of Fig. 9 the Pleiades (0.60–0.03 M⊙) and Orionis (1–0.004 M⊙) mass spectra obtained by Lodieu et al. (2012) and Peña Ramírez et al. (2012). We chose the Orionis cluster because its mass function was derived for a wide range of masses within the substellar domain. Also shown in the right panel of Fig. 9 are the two clusters mass functions that consider the number of objects per logarithmic mass unit [d/dlog()] as defined by Salpeter (1955). All functions are normalized to the total number of Pleiades candidates in the main survey for the common mass range 0.03–0.075 M⊙. Interestingly, they have been derived using the prescriptions described before and the same solar-metallicity evolutionary models. Therefore, the mass functions can be safely compared.
The Pleiades is 40 times older than the Orionis cluster (3 Myr, Zapatero Osorio et al. 2002; Oliveira et al. 2004), yet the two regions display fairly similar mass spectrum and mass function for all masses in common, from 0.5 through 0.012 M⊙. In the mass spectrum form, the number of objects between solar-mass stars and 0.2 M⊙ increases toward low masses in both clusters. Between 0.2 M⊙ and 0.03 M⊙ in the substellar domain the mass spectrum flattens and apparently changes to a rising slope for smaller masses into the planetary domain. The similar behavior between the Pleiades and Orionis mass functions suggests that even though the Pleiades is believed to be dynamically evolved (Sect. 5), it has not lost (or evaporated) a significant amount of its low-mass content (brown dwarf and massive planet; see also Moraux et al. 2004; Bihain et al. 2006), or that if any, the relative object loss between susbtellar members and low-mass stars occurs in a related manner in both clusters (assuming that the evolutionary models are correct for these two very different ages).
We caution that the Pleiades mass function and the discussion presented here are based on a rather small explored region, which approximately covers 3% of the total cluster field. This study would benefit from a similar or even deeper survey that extends to a significant fraction of the Pleiades area. Additionally, follow-up observations are needed to confirm the cluster membership of our candidates, particularly the faintest ones, to construct a more robust Pleiades mass function in the planetary domain. The extrapolation of the Pleiades mass function illustrated in Fig. 9 into very small masses using a power law with indices of 0.2, 0.6, and 1.0 yields that 150–850 planetary-mass sources between 0.012 and 0.001 M⊙ may be free-floating in the cluster. The least-massive ones would have effective temperatures like those of Earth and luminosities three orders of magnitude lower than the candidates of this work. Detecting them is indeed challenging even for 10 m class telescopes; they are targets for next-generation telescopes.
7 Conclusions
We carried out an astrometric and photometric search in the Pleiades covering an area of 0.8 deg2 around the cluster center and using - and -band images taken 9 yr apart with the near-infrared cameras of the Calar Alto 3.5 m telescope. The exploration was sensitive to Pleiades member candidates spanning the magnitude interval = 15.5–21.5, this is from the substellar limit at the age (120 Myr) and distance (133.5 pc) of the cluster through 0.008–0.010 M⊙ according to the evolutionary models by Chabrier et al. (2000a). The completeness of the survey lies at mag and 0.012 M⊙, that is, the deuterium-burning mass threshold. This is about 1–2 mag fainter than previous works (Bihain et al. 2006; Lodieu et al. 2012). The typical astrometric precision is about 6 mas yr-1; third- (and fourth-) epoch UKIDSS -band images and images acquired by us with HAWK-I on the VLT and LIRIS on the WHT separated by 11–15 yr in time allowed us to reduce the proper motion error bar to 1–4 mas yr-1 for some selected candidates.
Pleiades member candidates were picked up with proper motions compatible with the one distinctive of the cluster within a radius of 13 mas yr-1, and with magnitudes and colors following the known cluster sequence in the interval = 15.5–18.8 mag, and mag or no -band detection for mag. We found that about 50% of the astrometric candidates fail the photometric criteria, which left us with 19 Pleiades candidates that complied with all the required conditions for being true cluster members. Most of them have and photometry with S/N 3 available from the WISE catalog. The Pleiades sequence from = 15.5 to 20.3 mag, or = 14.5 to 18 mag, became increasingly red in all studied colors; furthermore, the colors of candidates at mag are significantly redder by 0.5–1 mag than those of high-gravity field L-type dwarfs. This agrees with the photometric properties reported for young L dwarfs in the field (e.g., Cruz et al. 2009; Zapatero Osorio et al. 2010; Faherty et al. 2012; Liu et al. 2013; Schneider et al. 2014). This signature is not well reproduced by the 120 Myr theoretical isochrone (Chabrier et al. 2000a) with the synthetic colors computed from the BT-Settl model atmospheres (Allard et al. 2012). This isochrone predicts that the near-infrared colors of Pleiades substellar members turn to blue indices at about 1 mag brighter, in clear contrast with the observations. A semi-empirical 120-Myr model built from the theoretical luminosities and ’s by Chabrier et al. (2000a) and the bolometric corrections available in the literature for field young L dwarfs nicely reproduces the Pleiades photometric sequence from = 15.5, 14.5 to 20.5, 18.0 mag.
For fainter and magnitudes, or masses below 0.012 M⊙ at the age and distance of the cluster, our Pleiades candidates appear to turn slightly to blue and colors, while the few WISE data available to us suggest that the red behavior of the index continues to rise. This might be due to an increasing object contamination at the faintest end of our survey or to the appearance of methane absorption in the atmospheres of Pleiades members. The location of the three farthest giant planets and the T3.5 type planet of the 100 Myr systems HR 8799 and GU Psc (Marois et al. 2008, 2010; Naud et al. 2014) in color-magnitude diagrams was reasonably explained by the disposition and colors of our least-luminous candidates. This would support the planetary mass of the companion objects of HR 8799 and GU Psc. Follow-up spectroscopic observations are necessary for a proper characterization of the Pleiades candidates.
The proper motion dispersion of Pleiades brown dwarfs (corrected for the errors of the proper motion measurements) was determined at 6.4 1.7 mas yr-1 and 7.5 6.1 mas yr-1 for the mass intervals 0.072–0.025 and 0.025–0.012 M⊙. This is a factor of 6–7 times higher than the velocity dispersion observed for solar-mass stars in the cluster (Jones 1970; Pinfield et al. 1998), which agrees with the energy equipartition where the velocity dispersion scales with . This indicates that brown dwarfs are dynamically relaxed at the Pleiades age. However, from our computations of the Pleiades substellar mass function combined with the stellar mass function obtained by Lodieu et al. (2012), it seems that the cluster has expanded, but has not lost a significant amount of its brown dwarf and massive planetary-mass object content relative to the low-mass stellar content. We found that the Pleiades mass function probably softly increases toward the planetary-mass domain, which was previously reported for the 40-times younger Orionis cluster by Peña Ramírez et al. (2012). The Pleiades and Orionis mass functions compare well from 0.5 through 0.012 M⊙, which supports the universality of the mass function. According to evolutionary models, the new low-mass discoveries in the Pleiades cluster may have masses of about 0.012 M⊙, effective temperatures ranging from 800 to 1300 K, and intermediate surface gravities around log = 4.0 (cm s-2). They may become reference objects for interpreting the observations of the solar neighborhood ultracool population and giant planets that orbit stars.
Acknowledgements.
We thank E. L. Martín for useful discussions related to the topic of this article, we also thank H. Bouy for discussions on proper motion measurements. We thank the anonymous referee for comments and suggestions that have improved this paper. Based on observations collected at the Centro Astronómico Hispano Alemán (CAHA) at Calar Alto, operated jointly by the Max-Planck Institut für Astronomie and the Instituto de Astrofísica de Andalucía (CSIC). Also based on observations made with the William Herschel Telescope (WHT) operated on the island of La Palma by the Isaac Newton Group in the Spanish Observatorio del Roque de los Muchachos of the Instituto de Astrofísica de Canarias. Also based on observations collected at the European Organisation for Astronomical Research in the Southern Hemisphere, Chile (proposal 088.C-0328). This work is based in part on data obtained as part of the UKIRT Infrared Deep Sky Survey. This research has made use of the SIMBAD database, operated at CDS, Strasbourg, France. This work was financed by the Spanish Ministry of Economy and Competitiveness through the project AYA2011-30147-C03-03, and by Sonderforschungsbereich SFB 881 ”The Milky Way System” (subprogram B6) of the German Research Foundation. M. C. G. O. acknowledges the support of a JAE-Doc CSIC fellowship co-funded with the European Social Fund under the program Junta para la Ampliación de Estudios.References
- Allard et al. (1997) Allard, F., Hauschildt, P. H., Alexander, D. R., & Starrfield, S. 1997, ARA&A, 35, 137
- Allard et al. (2012) Allard, F., Homeier, D., & Freytag, B. 2012, Philosophical Transactions of the Royal Society A: Mathematical, Physical and Engineering Sciences, 370, 2765
- Allers & Liu (2013) Allers, K. N. & Liu, M. C. 2013, ApJ, 772, 79
- Baraffe et al. (2003) Baraffe, I., Chabrier, G., Barman, T. S., Allard, F., & Hauschildt, P. H. 2003, A&A, 402, 701
- Basri (2000) Basri, G. 2000, ARA&A, 38, 485
- Basri et al. (1996) Basri, G., Marcy, G. W., & Graham, J. R. 1996, ApJ, 458, 600
- Bihain et al. (2006) Bihain, G., Rebolo, R., Béjar, V. J. S., et al. 2006, A&A, 485, 805
- Bihain et al. (2010) Bihain, G., Rebolo, R., Zapatero Osorio, M. R., Béjar, V. J. S., & Caballero, J. A. 2010, A&A, 519, 93
- Bihain et al. (2009) Bihain, G., Rebolo, R., Zapatero Osorio, M. R., et al. 2009, A&A, 506, 1169
- Burgess et al. (2009) Burgess, A. S., Moraux, E., Bouvier, J., et al. 2009, A&A, 508, 823
- Burningham et al. (2013) Burningham, B., Cardoso, C. V., Smith, L., et al. 2013, MNRAS, 433, 457
- Burrows et al. (1997) Burrows, A., Marley, M., Hubbard, W. B., et al. 1997, ApJ, 491, 856
- Caballero et al. (2008) Caballero, J. A., Burgasser, A. J., & Klement, R. 2008, A&A, 488, 181
- Casewell et al. (2007) Casewell, S. L., Dobbie, P. D., Hodgkin, S. T., et al. 2007, MNRAS, 378, 1131
- Casewell et al. (2010) Casewell, S. L., Dobbie, P. D., Hodgkin, S. T., et al. 2010, MNRAS, 402, 1407
- Casewell et al. (2011) Casewell, S. L., Jameson, R. F., Burleigh, M. R., et al. 2011, MNRAS, 412, 2071
- Chabrier & Baraffe (1997) Chabrier, G. & Baraffe, I. 1997, A&A, 327, 1039
- Chabrier et al. (2000a) Chabrier, G., Baraffe, I., Allard, F., & Hauschildt, P. 2000a, ApJ, 542, 464
- Chabrier et al. (2000b) Chabrier, G., Baraffe, I., Allard, F., & Hauschildt, P. 2000b, ApJ, 542, L119
- Cruz et al. (2009) Cruz, K. L., Kirkpatrick, J. D., & Burgasser, A. J. 2009, AJ, 137, 3345
- Cushing et al. (2011) Cushing, M. C., Kirkpatrick, J. D., Gelino, C. R., et al. 2011, ApJ, 743, 50
- Dahn et al. (2002) Dahn, C. C., Harris, H. C., Vrba, F. J., et al. 2002, AJ, 124, 1170
- Delfosse et al. (1997) Delfosse, X., Tinney, C. G., Forveille, T., et al. 1997, A&A, 327, L25
- Delorme et al. (2010) Delorme, P., Albert, L., Forveille, T., et al. 2010, A&A, 518, 39
- Delorme et al. (2012) Delorme, P., Gagné, J., Malo, L., et al. 2012, A&A, 548, A26
- Dupuy & Liu (2012) Dupuy, T. J. & Liu, M. C. 2012, ApJS, 201, 19
- Epchtein (1997) Epchtein, N. 1997, in The Impact of Large Scale Near–Infrared Sky Surveys, eds. F. Garzón, N. Epchtein, A. Omont, B. Burton, P. Persi (Kluwer Academic Publishers, Tenerife)
- Esposito et al. (2013) Esposito, S., Mesa, D., Skemer, A., et al. 2013, A&A, 549, 52
- Faherty et al. (2012) Faherty, J. K., Burgasser, A. J., Walter, F. M., et al. 2012, ApJ, 752, 56
- Faherty et al. (2013) Faherty, J. K., Rice, E. L., Cruz, K. L., Mamajek, E. E., & Núñez, A. 2013, AJ, 145, 2
- Gizis et al. (2012) Gizis, J. E., Faherty, J. K., Liu, M. C., et al. 2012, AJ, 144, 94
- Golimowski et al. (2004) Golimowski, D. A., Leggett, S. K., Marley, M. S., et al. 2004, AJ, 127, 3516
- Grazian et al. (2006) Grazian, A., Fontana, A., de Santis, C., et al. 2006, A&A, 449, 951
- Gunn & Weinberg (1995) Gunn, K. E. & Weinberg, D. H. 1995, in Wide-Field Spectroscopy and the Distant Universe, ed. S. Maddox & Aragón-Salamanca (Singapore: World Scientific), 3
- Hambly et al. (1993) Hambly, N. C., Hawkins, M. R. S., & Jameson, R. F. 1993, A&AS, 100, 607
- Hauschildt et al. (1999) Hauschildt, P. H., Allard, F., & Baron, E. 1999, ApJ, 512, 377
- Hewett et al. (2006) Hewett, P. C., Warren, S. J., Leggett, S. K., & Hodgkin, S. T. 2006, MNRAS, 367, 454
- Hodgkin et al. (2009) Hodgkin, S. T., Irwin, M. J., Hewett, P. C., & Warren, S. J. 2009, MNRAS, 394, 675
- Jameson et al. (2002) Jameson, R. F., Dobbie, P. D., Hodgkin, S. T., & Pinfield, D. J. 2002, MNRAS, 335, 853
- Janson et al. (2013) Janson, M., Brandt, T. D., Kuzuhara, M., et al. 2013, ApJ, 778, L4
- Jones (1970) Jones, B. F. 1970, AJ, 75, 563
- Kirkpatrick et al. (2000) Kirkpatrick, J. Davy; Reid, I. N. L. J. G. J. E., Burgasser, A. J., Monet, D. G., Dahn, C. C., & Nelson, Brant; Williams, R. J. 2000, AJ, 120, 447
- Kirkpatrick et al. (2013) Kirkpatrick, J. D., Cushing, M. C., Gelino, C. R., et al. 2013, ApJ, 776, 128
- Kirkpatrick et al. (2011) Kirkpatrick, J. D., Cushing, M. C., Gelino, C. R., et al. 2011, ApJS, 197, 19
- Kuzuhara et al. (2013) Kuzuhara, M., Tamura, M., Kudo, T., et al. 2013, ApJ, 774, 11
- Lawrence et al. (2007) Lawrence, A., Warren, S. J., Almaini, O., et al. 2007, MNRAS, 379, 1599
- Liu et al. (2013) Liu, M. C., Magnier, E. A., Deacon, N. R., et al. 2013, ApJ, 777, L20
- Lodieu et al. (2012) Lodieu, N., Deacon, N. R., & Hambly, N. C. 2012, MNRAS, 422, 1495
- Lodieu et al. (2013) Lodieu, N., Dobbie, P. D., Cross, N. J. G., et al. 2013, MNRAS, 435, 2474
- Lodieu et al. (2007) Lodieu, N., Dobbie, P. D., Deacon, N. R., et al. 2007, MNRAS, 380, 712
- Lodieu et al. (2011) Lodieu, N., Hambly, N. C., Dobbie, P. D., et al. 2011, MNRAS, 418, 2604
- Lotkin & Beshenov (2003) Lotkin, A. V. & Beshenov, G. V. 2003, ARep, 47, 6
- Lucas et al. (2013) Lucas, P. W., Casewell, S. L., Burningham, B., et al. 2013 (Presented at the workshop on Exoplanets and Brown Dwarfs: Mind the Gap, 2–5 September, Hertfordshire, UK)
- Lucas & Roche (2000) Lucas, P. W. & Roche, P. F. 2000, MNRAS, 314, 858
- Luhman (2012) Luhman, K. L. 2012, ARA&A, 50, 65
- Luhman et al. (2009) Luhman, K. L., Mamajek, E. E., Allen, P. R., & Cruz, K. L. 2009, ApJ, 703, 399
- Luhman & Muench (2008) Luhman, K. L. & Muench, A. A. 2008, ApJ, 684, 654
- Luhman et al. (2005) Luhman, K. L., Stauffer, J. R., & Mamajek, E. E. 2005, ApJ, 628, L69
- Manchado et al. (1998) Manchado, A., Fuentes, F. J., Prada, F., et al. 1998, SPIE, 3354, 448
- Marois et al. (2008) Marois, C., Macintosh, B., Barman, T., et al. 2008, Science, 322, 1348
- Marois et al. (2010) Marois, C., Zuckerman, B., Konopacky, Q. M., Macintosh, B., & Barman, T. 2010, Nature, 468, 1080
- Martín et al. (1998) Martín, E. L., Basri, G., Gallegos, J. E., et al. 1998, ApJ, 499, L61
- Martín et al. (2000) Martín, E. L., Brandner, W., Bouvier, J., et al. 2000, ApJ, 543, 299
- Martín et al. (2010) Martín, E. L., Phan-Bao, N., Bessell, M., et al. 2010, A&A, 517, 53
- Moraux et al. (2003) Moraux, E., Bouvier, J., Stauffer, J. R., & Cuillandre, J.-C. 2003, A&A, 400, 891
- Moraux et al. (2004) Moraux, E., Kroupa, P., & Bouvier, J. 2004, A&A, 426, 75
- Nagashima et al. (2003) Nagashima, C., Dobbie, P. D., Nagayama, T., et al. 2003, MNRAS, 343, 1263
- Naud et al. (2014) Naud, M.-E., Artigau, E., Malo, L., et al. 2014, ApJ, 787, 5
- Oliveira et al. (2004) Oliveira, J. M., Jeffries, R. D., & van Loon, J. T. 2004, MNRAS, 347, 1327
- Oppenheimer et al. (2013) Oppenheimer, B. R., Baranec, C., Beichman, C., et al. 2013, ApJ, 768, 24
- Palau et al. (2012) Palau, Aina; de Gregorio-Monsalvo, I., Morata, O., Stamatellos, D., et al. 2012, MNRAS, 424, 2778
- Parker & Tinney (2013) Parker, S. R. & Tinney, C. G. 2013, MNRAS, 430, 1208
- Peña Ramírez et al. (2012) Peña Ramírez, K., Béjar, V. J. S., Zapatero Osorio, M. R., Petr-Gotzens, M. G., & Martín, E. L. 2012, ApJ, 754, 30
- Peña Ramírez et al. (2011) Peña Ramírez, K., Zapatero Osorio, M. R., Béjar, V. J. S., Rebolo, R., & Bihain, G. 2011, A&A, 532, 42
- Pinfield et al. (2003) Pinfield, D. J., Dobbie, P. D., Jameson, R. F., et al. 2003, MNRAS, 342, 1241
- Pinfield et al. (2000) Pinfield, D. J., Hodgkin, S. T., Jameson, R. F., et al. 2000, MNRAS, 313, 347
- Pinfield et al. (1998) Pinfield, D. J., Jameson, R. F., & Hodgkin, S. T. 1998, MNRAS, 299, 955
- Pirard et al. (2004) Pirard, J.-F., Kissler-Patig, M., Moorwood, A., et al. 2004, SPIE, 5492, 1763
- Rebolo et al. (1996) Rebolo, R., Martín, E. L., Basri, G., Marcy, G. W., & Zapatero Osorio, M. R. 1996, ApJ, 469, L53
- Rebolo et al. (1995) Rebolo, R., Zapatero Osorio, M. R., & Martín, E. L. 1995, Nature, 377, 129
- Reid et al. (2008) Reid, N. I., Cruz, K. L., Kirkpatrick, J. D., et al. 2008, AJ, 136, 1290
- Reid et al. (2006) Reid, N. I., Lewitus, E., Allen, P. R., Cruz, K. L., & Burgasser, A. J. 2006, AJ, 132, 891
- Salpeter (1955) Salpeter, E. E. 1955, ApJ, 121, 161
- Sarro et al. (2014) Sarro, L., Bouy, H., Berihuete, A., et al. 2014, A&A, in press
- Saumon et al. (1996) Saumon, D., Hubbard, W. B., Burrows, A., et al. 1996, ApJ, 460, 993
- Schneider et al. (2014) Schneider, A. C., Cushing, M. C., Kirkpatrick, J. D., et al. 2014, AJ, 147, 34
- Scholz et al. (2012) Scholz, A., Jayawardhana, R., Muzic, K., et al. 2012, ApJ, 756, 24
- Skrutskie et al. (2006) Skrutskie, M. F., Cutri, R. M., Stiening, R., et al. 2006, AJ, 131, 1163
- Soderblom et al. (2009) Soderblom, D. R., Laskar, T., Valenti, J. A., Stauffer, J. R., & Rebull, L. M. 2009, AJ, 138, 1292
- Soderblom et al. (2005) Soderblom, D. R., Nelan, E., Benedict, G. F., et al. 2005, AJ, 129, 1616
- Spezzi et al. (2012) Spezzi, L., Alves de Oliveira, C., Moraux, E., et al. 2012, A&A, 545, 105
- Stauffer et al. (1994) Stauffer, J. R., Hamilton, D., & Probst, R. G. 1994, AJ, 108, 155
- Stauffer & Hartmann (1987) Stauffer, J. R. & Hartmann, L. W. 1987, ApJ, 318, 337
- Stauffer et al. (1998) Stauffer, J. R., Schultz, G., & Kirkpatrick, J. D. 1998, ApJ, 499, L199
- Stephens et al. (2009) Stephens, D. C., Leggett, S. K., Cushing, M. C., et al. 2009, ApJ, 702, 154
- Strauss et al. (1999) Strauss, M. A., Fan, X., Gunn, J. E., et al. 1999, ApJ, 522, L61
- Tinney et al. (1998) Tinney, C. G., Delfosse, X., Forveille, T., & Allard, F. 1998, A&A, 338, 1066
- Todorov et al. (2010) Todorov, K., Luhman, K. L., & McLeod, K. K. 2010, ApJ, 714, L84
- Tsuji et al. (1996) Tsuji, T., Ohnaka, K., & Aoki, W. 1996, A&A, 305, L1
- van Leeuwen (1980) van Leeuwen, F. 1980, IAUS, 85, 157
- Vrba et al. (2004) Vrba, F. J., Henden, A. A., Luginbuhl, C. B., et al. 2004, AJ, 127, 2948
- Wright et al. (2010) Wright, E. L., Eisenhardt, P. R. M., Mainzer, A. K., et al. 2010, AJ, 140, 1868
- Zapatero Osorio et al. (2014) Zapatero Osorio, M. R., Béjar, V. J. S., Miles-Páez, P., et al. 2014, A&A, in press
- Zapatero Osorio et al. (2002) Zapatero Osorio, M. R., Béjar, V. J. S., Pavlenko, Y., et al. 2002, A&A, 384, 937
- Zapatero Osorio et al. (2010) Zapatero Osorio, M. R., Rebolo, R., Bihain, G., et al. 2010, ApJ, 715, 1408
- Zapatero Osorio et al. (1997) Zapatero Osorio, M. R., Rebolo, R., & Martín, E. L. 1997, A&A, 317, 164
| Two or more proper motion measurements and photometry () consistent with cluster sequence, unresolved candidates. | ||||||||||
|---|---|---|---|---|---|---|---|---|---|---|
| Object | RA, DEC (J2000) | cos , | a𝑎aa𝑎aNumber of proper motion measurements. The number of observing epochs has to be increased by 1. | b𝑏bb𝑏bThis paper. | b𝑏bb𝑏bThis paper. | c𝑐cc𝑐cFrom UKIDSS GCS, with a few indicated exceptions. | d𝑑dd𝑑dStandard deviation of the mean proper motion measurement computed for . | Other name | ||
| (h m s), (∘ ′ ′′) | (mas yr-1) | (mag) | (mag) | (mag) | (mag) | (mag) | (mas yr-1) | |||
| Calar Pleiades 8 | 3 43 34.19 25 02 16.6 | 21.2 5.6, 40.1 6.5 | 5 | 15.56 0.04 | 14.88 0.01 | 14.57 0.01 | 14.36 0.03 | 14.14 0.05 | 1.6, 3.8 | |
| Calar Pleiades 9 | 3 42 03.09 24 03 41.1 | 25.5 5.6, 33.9 6.5 | 2 | 15.59 0.02 | 15.00 0.01 | 14.67 0.01 | 14.55 0.03 | 14.40 0.05 | ||
| Calar Pleiades 10 | 3 46 14.06 23 21 56.4 | 26.5 5.7, 41.2 6.6 | 1 | 15.67 0.02 | 15.02 0.02 | 14.62 0.01 | 14.46 0.03 | 14.31 0.05 | UGCS J034614.06232156.4 | |
| Calar Pleiades 11e𝑒ee𝑒eClose to - and/or -band frame border, large uncertainty in both photometric and astrometric data. | 3 42 18.02 24 55 10.0 | 12.5 5.6, 36.8 6.5 | 1 | 15.87 0.04 | 15.28 0.01 | 14.85 0.01 | 14.61 0.03 | 14.42 0.06 | UGCS J034218.01245509.9 | |
| Calar Pleiades 12 | 3 42 48.18 24 04 01.2 | 13.2 5.7, 45.8 6.6 | 3 | 16.05 0.04 | 15.42 0.01 | 14.94 0.01 | 14.76 0.03 | 14.48 0.06 | 2.0, 1.0 | Cl* Melotte 22 BPL 45 |
| Calar Pleiades 13 | 3 41 43.94 25 03 30.5 | 16.8 5.7, 49.6 6.6 | 1 | 16.37 0.04 | 15.68 0.02 | 15.13 0.01 | 14.87 0.03 | 14.53 0.06 | ||
| Calar Pleiades 14 | 3 45 50.63 23 44 36.8 | 17.0 5.6, 48.3 6.6 | 2 | 16.39 0.04 | 15.78 0.01 | 15.26 0.01 | 14.90 0.04 | 14.78 0.09 | Cl* Melotte 22 NPNPL 1 | |
| Calar Pleiades 15 | 3 42 30.59 25 02 39.3 | 18.8 5.8, 41.4 6.7 | 2 | 17.01 0.03 | 16.34 0.01 | 15.75 0.02 | 15.15 0.03 | 15.12 0.09 | UGCS J034230.58250239.2 | |
| Calar Pleiades 16 | 3 47 46.78 25 35 16.6 | 17.8 5.6, 45.0 6.7 | 2 | 17.54 0.04 | 16.76 0.02 | 16.15 0.03 | UGCS J034746.77253516.5 | |||
| Calar Pleiades 17 | 3 45 11.73 23 41 43.6 | 28.7 5.9, 38.7 6.8 | 1 | 17.65 0.04 | 16.83 0.02 | 16.12 0.02 | 15.80 0.05 | 15.81 0.17 | Cl* Melotte 22 NPNPL 3 | |
| Calar Pleiades 18 | 3 45 33.30 23 34 34.3 | 21.6 6.0, 41.4 7.0 | 3 | 18.18 0.03 | 17.24 0.02 | 16.50 0.03 | 16.12 0.06 | 15.82 0.15 | 1.5, 1.0 | UGCS J034533.30233434.2 |
| Calar Pleiades 19 | 3 48 15.65 25 50 08.8 | 16.1 6.3, 42.4 7.2 | 3 | 18.49 0.03 | 17.52 0.02 | 16.73 0.05 | 16.23 0.07 | 16.57 0.31 | 1.7, 1.5 | UGCS J034815.64255008.9 |
| Calar Pleiades 20 | 3 45 58.48 23 41 53.8 | 19.4 6.4, 40.8 7.2 | 2 | 18.62 0.03 | 17.48 0.01 | 16.74 0.04 | 15.75 0.05 | 15.49 0.12 | Cl* Melotte 22 NPNPL 4 | |
| Calar Pleiades 21 | 3 47 00.36 23 21 56.8 | 25.4 9.5, 37.2 9.5 | 3 | 20.23 0.08 | 18.74 0.03 | 17.73 0.03f𝑓ff𝑓fLIRIS measurement. | 16.48 0.08 | 16.31 0.25 | 2.7, 2.7 | |
| Calar Pleiades 22 | 3 46 00.39 23 19 33.9 | 18.4 9.1, 57.6 10.3 | 3 | 20.29 0.07 | 18.92 0.02 | 17.83 0.13 | 1.4, 7.3 | |||
| Calar Pleiades 23e𝑒ee𝑒eClose to - and/or -band frame border, large uncertainty in both photometric and astrometric data. | 3 42 55.13 24 09 02.6 | 31.6 16.0, 54.0 16.3 | 2 | 20.60 0.22 | 19.69 0.11 | 18.60 0.18 | 16.99 0.13 | 16.80 0.40 | ||
| Calar Pleiades 24 | 3 46 48.67 23 28 48.7 | 14.6 9.1, 45.5 15.8 | 2 | 20.65 0.13 | 20.04 0.05 | 18.83 0.33 | ||||
| Calar Pleiades 25 | 3 48 26.62 22 51 53.9 | 19.8 10.3, 49.4 12.5 | 3 | 20.83 0.15 | 19.74 0.07 | 18.46 0.21 | 17.43 0.16 | 10.3,12.5 | ||
| Calar Pleiades 26 | 3 45 16.09 23 35 07.3 | 20.2 8.1, 42.0 9.2 | 2 | 21.15 0.14 | 20.61 0.12 | 19.40 0.50g𝑔gg𝑔gUKIDSS GCS measurement obtained by us (see Sect. 2.1). | 16.15 0.06hℎhhℎhThe WISE source is located at 199 from the -band object (see text). | 15.58 0.13hℎhhℎhThe WISE source is located at 199 from the -band object (see text). | ||
| One proper motion measurement and mag, unresolved candidates. | |||||||
|---|---|---|---|---|---|---|---|
| Object | RA, DEC (J2000) | cos , | b𝑏bb𝑏bThis paper. | b𝑏bb𝑏bThis paper. | c𝑐cc𝑐cFrom UKIDSS GCS, with a few indicated exceptions. | ||
| (h m s), (∘ ′ ′′) | (mas yr-1) | (mag) | (mag) | (mag) | (mag) | (mag) | |
| Calar Pleiades 27e𝑒ee𝑒eClose to - and/or -band frame border, large uncertainty in both photometric and astrometric data. | 3 46 12.13 23 18 15.7 | 26.4 8.6, 45.2 11.3 | 20.01 0.15 | 20.61 0.07 | 18.50 | ||
| Calar Pleiades 28 | 3 46 37.89 23 25 27.3 | 21.4 8.0, 43.6 15.5 | 20.52 0.12 | 20.21 0.05 | 18.48 | ||
| Calar Pleiades 29 | 3 42 54.18 24 08 11.5 | 27.4 9.4, 36.6 9.6 | 20.80 0.13 | 20.65 0.20 | 18.65 | ||
| Calar Pleiades 30 | 3 48 01.49 25 36 49.2 | 27.6 13.0, 49.9 15.5 | 21.19 0.11 | 20.39 0.05 | 18.64 | ||
| Calar Pleiades 31 | 3 45 42.49 23 43 49.4 | 17.9 13.0, 41.4 15.5 | 21.37 0.20 | 20.82 0.09 | 18.99 0.50 | ||
| Resolved candidates and mag. | |||||||
|---|---|---|---|---|---|---|---|
| Object | RA, DEC (J2000) | cos , | b𝑏bb𝑏bThis paper. | b𝑏bb𝑏bThis paper. | c𝑐cc𝑐cFrom UKIDSS GCS, with a few indicated exceptions. | ||
| (h m s), (∘ ′ ′′) | (mas yr-1) | (mag) | (mag) | (mag) | (mag) | (mag) | |
| R1 | 3 43 00.72 25 05 04.6 | 21.5 10.0, 34.0 11.0 | 19.97 0.08 | 18.97 0.05 | 18.47 0.14 | 17.46 0.20 | |
| R2 | 3 48 01.30 23 08 13.1 | 15.6 10.0, 54.6 11.0 | 19.98 0.06 | 18.68 0.14 | 18.24 0.13 | 16.86 0.16 | 17.07 0.47 |
| R3 | 3 48 28.18 23 12 33.0 | 26.2 11.0, 35.4 12.0 | 20.41 0.10 | 19.11 0.16 | 18.69 | ||
| R4 | 3 49 49.61 22 53 55.5 | 17.7 12.0, 38.1 13.0 | 20.76 0.09 | 20.20 0.10 | 18.51 | ||
| R5 | 3 48 18.32 25 27 22.7 | 16.2 13.0, 35.6 15.5 | 21.18 0.15 | 20.51 0.09 | 18.63 | ||