OMC/INTEGRAL photometric observations of pulsating components in eclipsing binaries and characterization of DY Aqr
Abstract
We present the search for eclipsing binaries with a pulsating component in the first catalogue of optically variable sources observed by OMC/INTEGRAL, which contains photometric data for more than 1000 eclipsing binaries. Five objects were found and a detailed analysis of one of them, DY Aqr, has been performed. Photometric and spectroscopic observations of DY Aqr were obtained to analyse the binary system and the pulsational characteristics of the primary component. By applying the binary modelling software phoebe to the OMC and ground-based photometric light curves, and to the radial velocity curve obtained using echelle high-resolution spectroscopy, the physical parameters of the system have been determined. Frequency analysis of the residual data has been performed using Fourier techniques to identify pulsational frequencies. We have built a grid of theoretical models to classify spectroscopically the primary component as an A7.5V star (plus or minus one spectral subtype). The best orbital fit was obtained for a semi-detached system configuration. According to the binary modelling, the primary component has K and and the secondary component has K and , although it is too faint to isolate its spectral features. From the analysis of the residuals we have found a main pulsation frequency at 23.37 c/d, which is typical of a Scuti star. In the O-C diagram no evidence of orbital period changes over the last 8 years has been found.
keywords:
binaries: eclipsing - stars: variables: Scuti - techniques: photometric - techniques: spectroscopic - techniques: radial velocities.1 Introduction
Asteroseismology aims to understand the structure and evolution of stars by examining their oscillation modes (Brown & Gilliland, 1994; Aerts et al., 2010; Chaplin & Miglio, 2013). Among the classical pulsators, Scuti stars, which are located at the intersection of the Cepheid instability strip and the main sequence, where the stellar structure transits from a highly developed outer convective zone to its absence (Rodríguez & Breger, 2001), are rather common. They pulsate with amplitudes from milimagnitudes up to tenths of a magnitude (Breger, 2000), but only a fraction of the theoretically predicted modes are observed, which results in many free parameters in the pulsation models. It is therefore important to infer some of the fundamental stellar properties of these pulsators from other methods, like for example by studying the pulsating components in binary (multiple) systems. In this kind of systems it is possible to characterize precisely their components, supplying additional constraints for a more reliable modelling. About 70% of all stars in the Solar neighbourhood are members of binary or multiple systems ( 60-70% for late-type stars (Mayor et al., 2001; Chini et al., 2013), 70-80% for early-type stars (Mason et al., 2009; Sana & Evans, 2011; Chini et al., 2012)). This fact is usually ignored in the study of stellar pulsations although there is strong evidence that binarity might affect the pulsation properties in specific cases (e.g. the eccentric binaries HD 177863 (De Cat & Aerts, 2002), HD 209295 (Handler et al., 2002) and KIC 4544587 (Hambleton et al., 2013)). It is thus essential to understand the possible link(s) between binarity and pulsation (Lampens, 2006). Recent studies point to the fact that single and binary-member Scuti stars can show different behaviour because of their different evolutionary status (Mkrtichian et al., 2003; Soydugan et al., 2006; Liakos et al., 2012). Mkrtichian et al. (2004) introduced the oscillating eclipsing Algols (oEAs) as main sequence pulsators in semi-detached Algol-type eclipsing binary systems. For several of these systems, they found variable pulsational characteristics which could be related to mass transfer episodes or tidal distortions.
Several surveys have been carried out in the last years to increase the number of known objects of this type. Soydugan et al. (2006) compiled a catalogue of close eclipsing binary systems (detached and semi-detached ones) with one Scuti component. Zhou (2010) made a compilation of 190 oscillating eclipsing binaries (60 of them containing a Scuti component) and more than 370 pulsating binary or multiple stellar systems. Liakos et al. (2012) published a catalogue with 74 eclipsing binaries with a Scuti component, and this number is increasing at a very rapid rate thanks to the results of MOST (Walker et al., 2003), CoRot (Baglin et al., 2009) and Kepler (Borucki et al., 2010; Gilliland et al., 2010). However, just a few members of this group have been investigated in depth (some recent examples are Lehmann et al. (2013); Maceroni et al. (2014); da Silva et al. (2014)).
In this work we present the search for eclipsing binaries with a pulsating component in the first catalogue of variable objects observed by the Optical Monitoring Camera (OMC; Mas-Hesse et al. (2003)) onboard the INTEGRAL observatory (Winkler et al., 2003), OMC–VAR (Alfonso-Garzón et al., 2012). A detailed follow-up study of the physical properties of DY Aqr, an Algol-type binary with its primary component showing Scuti oscillations, has been performed, by combining optical photometry obtained with OMC and the 90-cm telescope at the Observatorio de Sierra Nevada (OSN, Granada, Spain), with high-resolution spectra taken with the HERMES instrument on the MERCATOR telescope at the Observatorio del Roque de los Muchachos (ORM, La Palma, Spain)). In Sect. 2, we show the results of the search. A short introduction to DY Aqr is included in Sect. 3. In Sect. 4, we present the observations obtained to characterize DY Aqr. The results of the spectral classification are discussed in Sect. 5. In Sect. 6, the O-C evolution is analysed. In Sect. 7, we explain the modelling of the binary features from the photometric and radial velocity curves. Sect. 8 contains the results of the pulsational frequency analysis performed after subtracting the orbital fit. In Sect. 9 we analyse the evolutionary state of the system, considering DY Aqr is a close binary system. Finally, in 10, the possible relation between the orbital and pulsational period of DY Aqr is examined.
2 The search for eclipsing binaries with pulsating components in OMC–VAR
The Optical Monitoring Camera (OMC) onboard INTEGRAL provides photometry in the Johnson -band. The first edition of the catalogue of variable objects observed by OMC, OMC–VAR, contains photometric and variability information for more than 5000 objects, resulting from the analysis of an initial sample of more than 6000 light curves observed by OMC during its first 8 years of operations. As discussed in Alfonso-Garzón et al. (2012), there are many objects in the OMC–VAR catalogue classified as eclipsing binaries according to the Variable Star Index (VSX; Watson (2006); Watson et al. (2012)). The VSX is a database maintained by the American Association of Variable Stars Observers (AAVSO) containing constantly updated and revised information about variable stars. Out of the 1132 classified eclipsing binaries, we found a period in the literature or have determined it from OMC data, for 1072 systems. Whenever available, we have used in this work the values of the periods extracted from our OMC data (see Table 1). The three types of eclipsing binaries in Table 1: Algol (EA), Lyrae (EB) and W Ursae Majoris (EW), correspond to the classification in the General Catalogue of Variable Stars (GCVS; Samus et al. (2009)), adopted in the VSX, and is based purely on the shape of the light curves.
| Eclipsing type | All | with | with |
|---|---|---|---|
| Algol (EA) | 728 | 272 | 703 |
| Beta Lyrae (EB) | 191 | 145 | 184 |
| W Ursae Majoris (EW) | 117 | 100 | 108 |
| Other | 96 | 23 | 61 |
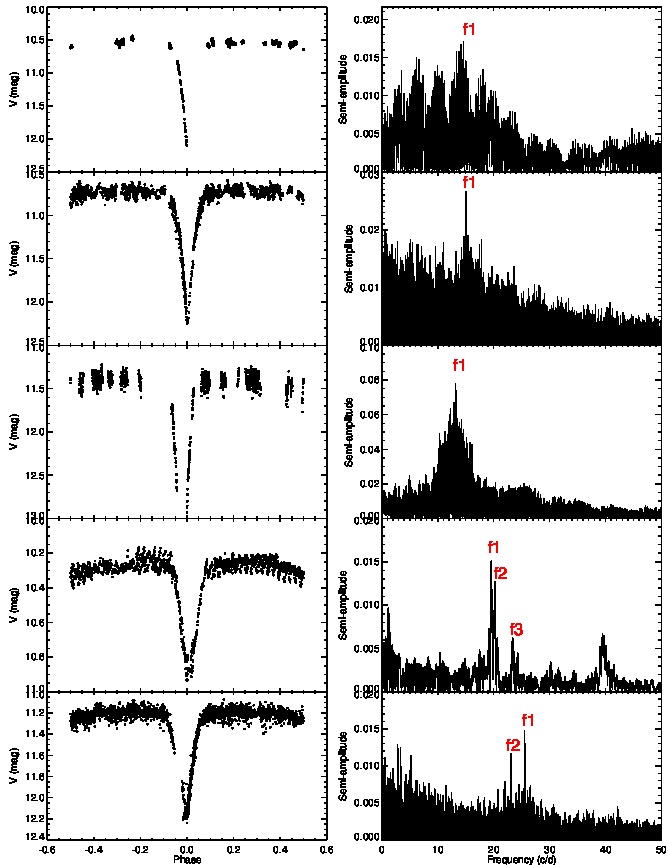
In order to detect pulsations in the components of these systems, we have analysed all eclipsing binaries in OMC–VAR, by modelling their folded OMC light curves with polyfit (Prša et al., 2008), aiming to fit just their overall shape. Then we subtracted the fitted curves from the original data. The residuals obtained, avoiding the intervals when eclipses occur, were analysed for periodic signals by calculating the Fourier periodogram. With this method we confirmed four previously known eclipsing systems with a pulsating component and we proposed a new candidate, AW Vel. We have found pulsational periods similar to the values previously reported in the literature for Y Cam, MX Pav and BG Peg. For DY Aqr, the pulsational period measured in previous works is also detected, but it is not the main one. These results are sumarized in Table 2 and the folded light curves and periodograms are plotted in Fig. 1.
| Name | SpT (A+B) | Reference | Semi-amplitude | |||
|---|---|---|---|---|---|---|
| (days) | (days) | (days) | (mag) | |||
| Y Cam | A9IV+K1IV | 3.3057 | 0.0665 | 1, 2, 3, 4, 5 | 0.0685(1) | 0.018(2) |
| AW Vel | A4 + [G2IV] | 1.9925 | 0.0664700(1) | 0.026(1) | ||
| MX Pav | A5 + K3IV | 5.7308 | 0.0756 | 6, 7 | 0.0756005(2) | 0.081(2) |
| DY Aqr | A0 + [F3] | 2.1597 | 0.0427 | 8, 9 | 0.051113(1) | 0.0141(7) |
| BG Peg | A2 + [G2IV] | 1.9527 | 0.0391 | 8, 10 | 0.03912730(4) | 0.014(1) |
3 Introduction to DY Aqr
DY Aqr was identified as an Algol-type binary showing Scuti oscillations by Soydugan et al. (2009, 2010). The only information known before this study about the spectral type of the components was given by Svechnikov & Kuznetsova (1990) and Malkov et al. (2006), who proposed it to be A0+[F3]. Zasche (2011) modelled the binary system using only the OMC photometric light curve, assuming the primary component to be an A0 V star. As far as we know, there is no spectroscopic information available for this source up to now. The lack of precise multiband photometric and spectroscopic data led us to perform a more detailed follow-up study of this binary system, which has allowed us to refine the properties of its components.
4 Observations
DY Aqr was observed by OMC for 5 days in two different epochs in 2002 and 2003. With the aim of characterizing the system, ground-based multicolour photometry and high-resolution spectroscopy were carried out and analysed. We obtained time for 6 nights of photometric and 6 nights of spectroscopic observations.
4.1 Photometric observations
OMC photometric data for DY Aqr in the Johnson filter have been extracted from the OMC database (Gutiérrez et al., 2004). DY Aqr was observed on 24-26 December 2002 and 7-8 November 2003. The OMC light curve has 1699 photometric measurements.
Additional multi-colour photometric observations were collected at the Observatorio de Sierra Nevada (OSN, Granada, Spain) on 7-8 and 10-13 September 2012. Strömgren photometry was carried out using the six channel photometer attached to the 90-cm telescope at OSN (OSN/T90) to determine the physical characteristics of the components of the system and to perform a detailed study of the pulsational frequency peaks through different filters. These light curves have 369 photometric measurements each one.
The OSN light curves provide differential magnitudes from a comparison star, HD 211250 ( = 8.51 mag). Since additional photometry for HD 211250 is available in SIMBAD, we have derived the apparent fluxes in the Strömgren filters modelling the Spectral Energy Distribution (SED) of the star and doing synthetic photometry on the model. Once the Strömgren magnitudes for the comparison star are obtained, the photometry for our target can be directly derived. The best fit for the SED of HD 211250 was obtained for K, and solar metallicity. Another comparison star, HD 211517, was used to check the stability of the photometry.
4.2 Spectroscopic observations
We obtained time series of high-resolution spectra for 6 nights from 27 August to 2 September 2012. For each observation, we took 3 or 4 exposures of 1200 s, which were combined in order to reject cosmic rays and to get better signal-to-noise ratio. In this way, 22 combined spectra were obtained in this campaign, covering reasonably well the different phases in the folded light curve. All spectra were taken with HERMES, a fibre-fed prism-cross-dispersed echelle spectrograph on the MERCATOR telescope, in the high-resolution mode (HRF, R85000), covering a wavelength range between 3800 and 8750 Å. The MERCATOR Telescope is a 1.2 m semi-robotic telescope located at the Observatorio del Roque de los Muchachos (ORM) on La Palma (Canary Islands, Spain).
The calibration of the spectra was performed with the automated reduction pipeline (Raskin et al., 2011). It performs the corrections for the bias level, the inter-order background level, the fringing on the detector, and the modulation of the intensity in each spectral order and applies a pre-normalisation eliminating the global wavelength-dependency of the flatfield calibration system. Finally, it applies a (non-absolute) flux calibration to each order and merges them into a single spectrum.
5 Spectral classification
The spectral type and physical parameters of the primary component of DY Aqr were determined using the spectra obtained with HERMES/MERCATOR.
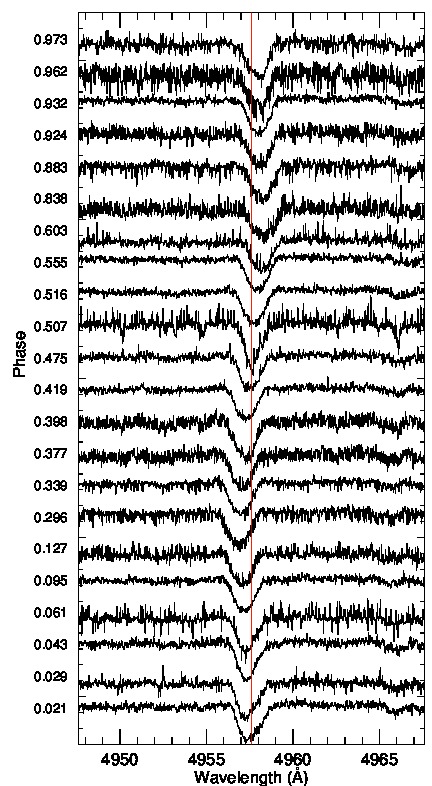
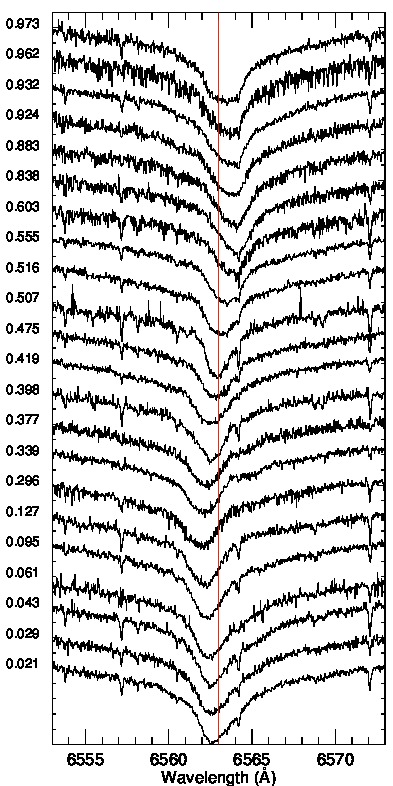
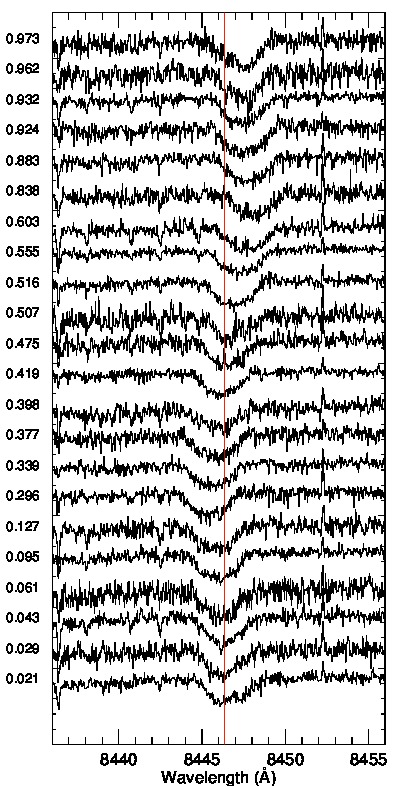
With the aim of separating each component spectra, we applied the spectral disentangling technique, using korel, a fortran code for disentangling spectra of binary and multiple systems which uses Fourier transform in the wavelength domain (Hadrava, 1995, 1997). korel assumes that an observed double-lined spectrum is a simple linear combination of two single-lined spectra whose velocities reflect the orbital properties of the system. When applied to a set of spectra covering the orbital phases, korel extracts the contribution of each component and provides the corresponding velocities relative to the system barycenter. For the 22 spectra, we have studied different regions along the spectral range, covering the most significant spectral lines (Ca ii-K 3933.73 Å, Fe i 4957.60 Å, Na i D 5889.95 Å, 5895.92 Å, H 6562.80 Å, O i 8446.36 Å and Ca ii 8662.14 Å) and we have found that in all the cases the secondary contribution was below the detection level. In Fig. 2 we have plotted the 22 spectra vertically arranged according to the orbital phase in the regions of Fe i 4957.60 Å, H 6562.80 Å and O i 8446.36 Å. The solid lines represent the rest wavelengths. No hints of the secondary component can be appreciated. On the other hand, if we examine the profiles of the lines close to the primary minimum, the Rossiter-McLaughlin effect (hereafter RME; Rossiter (1924); McLaughlin (1924)) can be observed.
Based on the korel results and as we will discuss in Sect. 7, we have considered the contribution of the secondary component to the combined spectra to be not significant enough for our purpose of making a spectral classification, since the spectral lines expected to come from it are not detected. Although the contribution to the continuum is about 3-4% in the V band (see Table 4), the effect in the spectral lines should be less noticeable. Moreover, the spectral lines are diluted because of the rotational velocity and are probably below the noise level. We have then combined all the available spectra, except those affected by the RME, taking into account the Doppler shifts for each phase point. In this way we obtained a normalized spectrum with higher signal-to-noise ratio to work with.
First of all, we examined the blue region of the spectrum. In this region, the hydrogen lines are enhanced by Stark broadening (Mihalas, 1978), but these lines become narrower toward later types. For DY Aqr we measured a width of 33 Å for H which is compatible with an effective temperature around 7500-8000 K and between 3.5 and 4.5 (see Fig. 5.5 in Gray & Corbally (2009)). Moreover, in this part of the spectrum, there are other features that can be used in the classification of A-type stars, like the comparison of the hydrogen Balmer lines, which are broadest for A2, with the Ca ii K-line, which grows in strength as the temperature decreases. Finally, looking at the near-infrared region of the spectrum, the most interesting trend is the appearance of the hydrogen Paschen lines. In the early A-type stars, these lines are much stronger than the near-infrared Ca ii triplet, but in the late A-type stars and in F-type stars, the Ca ii triplet becomes stronger. As the effective temperature decreases, the P13, P15 and P16 lines become stronger relative to the other unblended Paschen lines. On the other hand, the O i 8446 and some N i lines in this region are sensitive to gravity. Examining these lines, the spectrum of DY Aqr corresponds to a main sequence star.
According to these criteria, the primary component has to be a main sequence star with an effective temperature around 7500-8000 K. To quantify its properties, we synthesized a set of high-resolution spectra, using the suite of programmes SYNTHE (Kurucz, 1993). SYNTHE takes as input the list of the atomic and molecular transitions and the spectral range to be synthesized, together with the corresponding model atmosphere (Castelli & Kurucz, 2003) for a given temperature, gravity and metallicity, including the atomic fractions of the different elements. SYNTHE computes the excitation and ionization populations of neutrals and ions and then produces the final spectrum within the defined spectral range. A special module of SYNTHE computes intensities at several inclinations in the atmosphere and uses these, along with the value of , to reproduce the spectrum of the star.
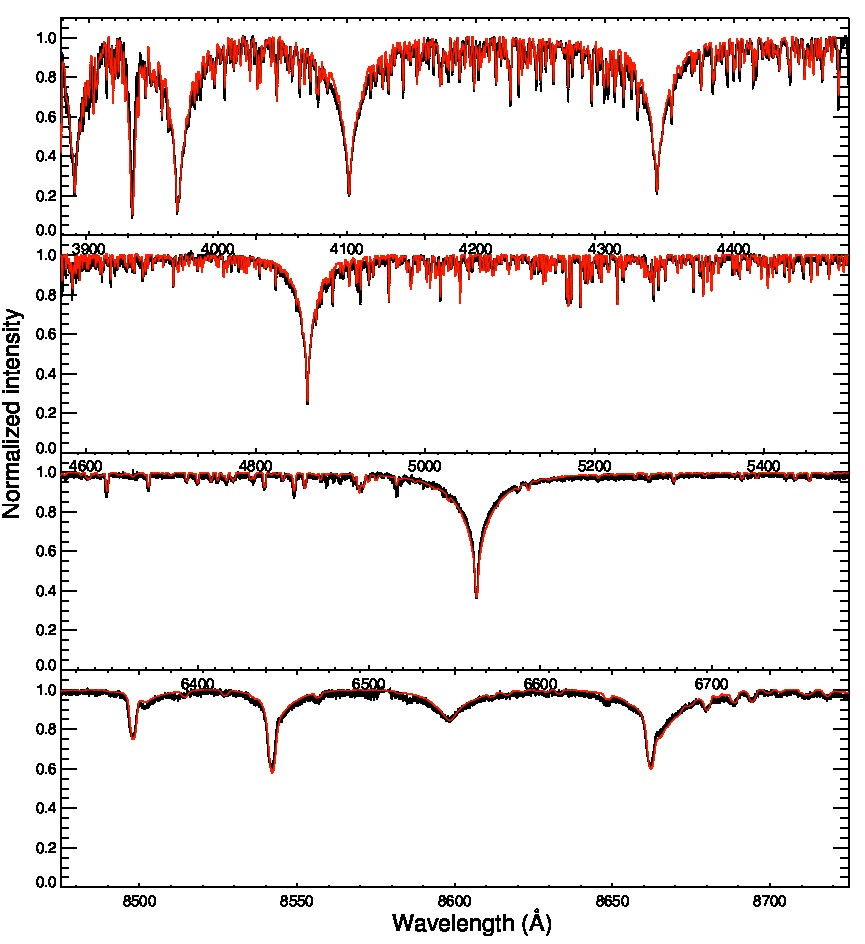
We explored the parameter space with between 7000 and 8500 K and between 3.5 and 4.5, with steps of 125 K and 0.25 dex respectively. The synthetic spectra were broadened with rotational velocities, , between 0 and 100 km s-1, with a step of 10 km s-1. Typical uncertainties in and are 125 K and 0.25 dex, correspondingly. We concluded that the model with K, , solar metallicity and km s-1 provides the best fit to the data (see Fig. 3). These parameters correspond to a spectral type A7.5 V (Schmidt-Kaler, 1982), plus or minus one spectral subtype, which indicates that DY Aqr is much cooler than assumed in the past.
6 O-C evolution
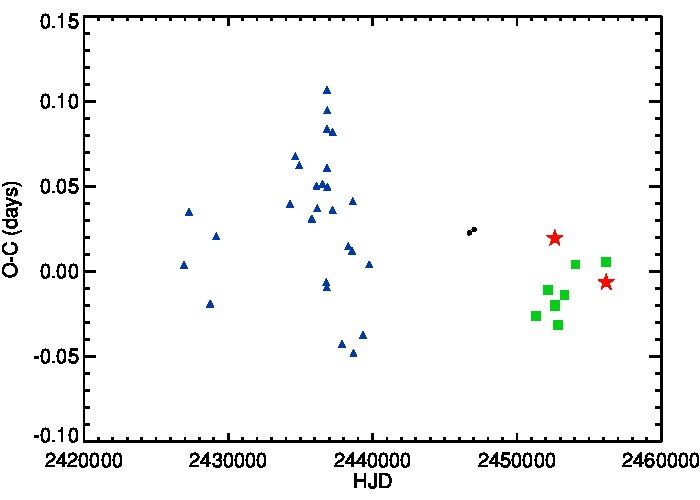
In order to construct the O-C diagram, the linear ephemerides HJD were used (Kreiner, 2004; Paschke & Brat, 2006). Two primary minima at different times were determined from our photometric data, using the method described in Kwee & van Woerden (1956). From the OMC data, we measured a primary minimum at HJD and from OSN data, a minimum was measured at HJD . As can be seen in Fig. 4, no significant long-term changes in the period are appreciated.
7 Binary modelling
It is only after removing the effects from binarity that the pulsational characteristics of the primary component of the system can be analysed on the residual data. The properties of the binary system have been derived from the photometric light curves in five colours (Johnson from OMC and Strömgren from OSN) and from the radial velocity (RV) curve of the primary component extracted from the high-resolution HERMES/MERCATOR spectra.
The binary modelling was made using phoebe (Prša & Zwitter, 2005), a package based on the Wilson-Devinney code (hereafter WD; (Wilson & Devinney, 1971; Wilson, 1979)). We tried two different configurations, detached and semi-detached with the secondary star filling its Roche lobe, founding that the first one converges to the second one, so we modelled our data with the configuration of a semi-detached system with the secondary component filling its Roche lobe. First, we analysed separately the radial velocity curve and the multi-colour photometric light curves and then, we combined all the available data to get the final solution.
Using the HERMES/MERCATOR spectra we derived the radial velocity curve for the primary component (see Fig. 5) but not for the secondary, because it was too weak compared to the primary to distinguish any of its spectral features. To measure the radial velocities we used the iraf package fxcor, with the spectrum closest to the secondary eclipse (to minimize the secondary component contribution) as template. According to the spectral type of the star, the best wavelength region of the spectra to carry out the correlation is 3900-5100 Å.
When we applied the spectral disentangling technique (see Sect. 5), the radial velocitiy curves provided by korel for the primary component disentangled spectrum for each region were found to be in good agreement with the results found with fxcor.
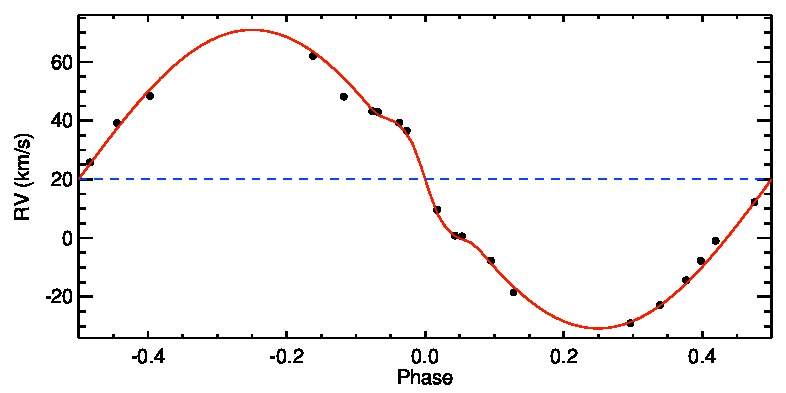
In the RV curve, the effects of the RME can be appreciated. The RME occurs in eclipsing systems when the companion crosses in front of the star; it is due to stellar rotation and creates a distortion in the radial velocity curve of the star. It strongly depends on the radii and separation of the stars, on the orbital inclination or impact parameter and on the position angle of the rotation axis. Its modelling allows to determine these values with a higher precision. In this case, the anomaly is symmetric with a similar redshift during the first half of the eclipse as the blueshift during the second half, so that we can conclude that the rotational spin and the orbital axis are aligned. phoebe considers the RME and proximity effects in the modelling. In Fig. 5, the RV measurements of the primary (black dots) and the phoebe fit of the radial velocity curve (red solid line), as well as the modelled systemic velocity (blue dashed line) are plotted. The RV semi-amplitude of the primary component is km s-1.
To solve the photometric light curves some basic assumptions were made (see Table 3). According to the results from the grid of synthetic spectra, the effective temperature of the primary was fixed to 7625 K. We also fixed the orbital period, that was obtained from OMC data and the Phase Dispersion Minimization (PDM) method (Stellingwerf, 1978), as explained in Alfonso-Garzón et al. (2012). As the secondary eclipse is centered at phase 0.5 and the light curve appears symmetrical, we have considered that the orbit is circular so the eccentricity was fixed to 0.
The mass-function has been calculated from the values of the orbital period and the semi-amplitude of the radial velocity curve of the primary component, considering that the orbit is circular. This leads to a value of M⊙. The effective temperature and gravity of the primary component, determined from the spectroscopic analysis ( K and 0.25), can be placed on a HR diagram along with the evolutionary tracks from Girardi et al. (2002). This allows to estimate a mass of 1.8 M⊙. The uncertainties in the effective temperature and gravity lead to an uncertainty of M⊙. As we will see in Sect. 9, a classical mass-luminosity relation (MLR) will provide us with an approximate value of the mass, although the luminosity of a star that is a member of a close binary system is usually larger than expected. From the mass-function and considering the uncertainties in the mass of the primary component, we have estimated the mass of the secondary component to be between 0.51 M⊙ and 0.59 M⊙. The mass-ratio is therefore constrained to the range 0.29 and 0.32, leading to a value of . Combining this information with the expected radius of the Roche-lobe filling component for a mass-ratio (Eggleton, 1983) and the relative sum of the radii obtained from the width of the eclipses, we could put some constraints in the fit. Theoretical values of the bolometric albedos (A1 = 1.0 and A2 = 0.6) and gravity-darkening exponents (g1 = 1.0 and g2 = 0.32) were adopted for the primary and secondary stars, corresponding to radiative and convective envelopes, respectively, in agreement with their final surface temperatures (Rucinski, 1969). The limb darkening coefficients were taken from the phoebe limb darkening tables (Prša et al., 2011). The combined depths and widths of the eclipses were then adjusted by altering the inclination and stellar potentials, respectively.
| Parameter | Values |
|---|---|
| Time of primary minimum (BJD) | 2452632.03258 |
| Orbital period (d) | 2.15967989(1) |
| Orbital eccentricity, e | 0.0 |
| Primary (K) | 7625(125) |
| Primary Bolometric albedo | 1.0 |
| Secondary Bolometric albedo | 0.60 |
| Primary gravity brightening | 1.0 |
| Secondary gravity brightening | 0.32 |
| Primary rotation | 1.00 |
| Secondary rotation | 1.00 |
| Third light | 0.0 |
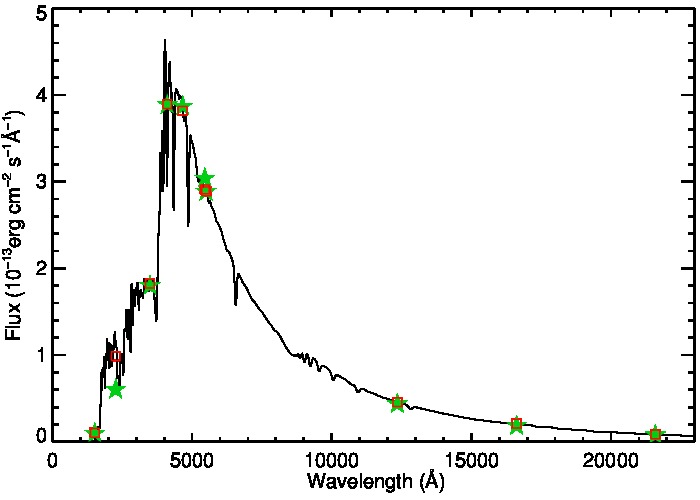
With the system parameters resulting from the first iteration of the modelling, we proceeded to estimate the reddening. We built the spectral energy distribution (SED) of DY Aqr, using data from our observations and from the 2MASS (Cutri et al., 2003) and GALEX catalogues (Bianchi et al., 2011). With the parameters of the first fit, we built the combined synthetic spectrum and obtained the photometrical points at various bands. By comparing these photometrical points with the observed ones, we estimated the value corresponding to the derived reddening. The best fit of the models to our SED was provided assuming a value of (see Fig. 6). A standard Galactic extinction law (Cardelli et al., 1989) was used.
Then, the photometric light curves were dereddened using the derived value of . As the reddening is wavelength dependent we had to calculate the contribution of the reddening for each filter and for each point of the light curve. In the case of binary systems, the composite spectrum in each phase point is slightly different due to geometrical effects and this fact has to be taken into account. The best way for the treatment of reddening of the light curves is the following: Using the model spectra of the primary and of the secondary, and the values of the radial velocities of the primary and the estimated mass-ratio, we can doppler-shift the model spectra and add them together to get the composite spectrum for each phase point. Then we have to multiply the composite spectrum by the reddening function. After that, we integrate the resulting reddened spectrum. If we compare this flux with the one resulting from the same process but without convolving it with the reddening function, the ratio between the flux obtained from both cases is the reddening correction for each data point. Doing this for each phase point and for each filter, the corresponding dereddening corrections were derived. This process was performed for the five photometric light curves.
Once the light curves were corrected for extinction, a second iteration of the orbital fit with similar considerations as for the first one was carried out. The final results of the binary model are summarized in Table 4. Synthetic and observed light curves are presented in Fig. 7. The errors assigned to the masses and to the mass-ratio come from the errors of the effective temperature and gravity, as we explained above and the errors of the other parameters were estimated measuring the variations of each value considering the range of different plausible solutions. These error bars are larger than those obtained from the covariation matrix, but are more realistic because many of the parameters involved in the modelling of binary stars are intercorrelated.
| Parameter | Values |
|---|---|
| System parameters | |
| Semi-major axis (R⊙), | 9.4(5) |
| Mass ratio, | 0.31(2) |
| Center-of-mass velocity (km ), | 20.10(5) |
| Orbital inclination (degrees), | 75.4(5) |
| Argument of periastron (rad), | 1.57(1) |
| Stellar parameters | |
| Secondary effective temperature (K), | 3800(200) |
| Primary mass (M⊙), | 1.8(2) |
| Secondary mass (M⊙), | 0.55(4) |
| Primary radius (R⊙), | 2.1(1) |
| Secondary radius (R⊙), | 2.7(1) |
| Primary potential, | 4.8(1) |
| Primary (cgs), | 4.1(1) |
| Secondary (cgs), | 3.3(1) |
| Luminosity ratio in band, LL | 0.003(2) |
| Luminosity ratio in band, LL | 0.008(5) |
| Luminosity ratio in band, LL | 0.02(1) |
| Luminosity ratio in band, LL | 0.04(2) |
| Luminosity ratio in V band, LL | 0.037(1) |
Note: The values in parentheses give the 1 uncertainty in the previous digit.
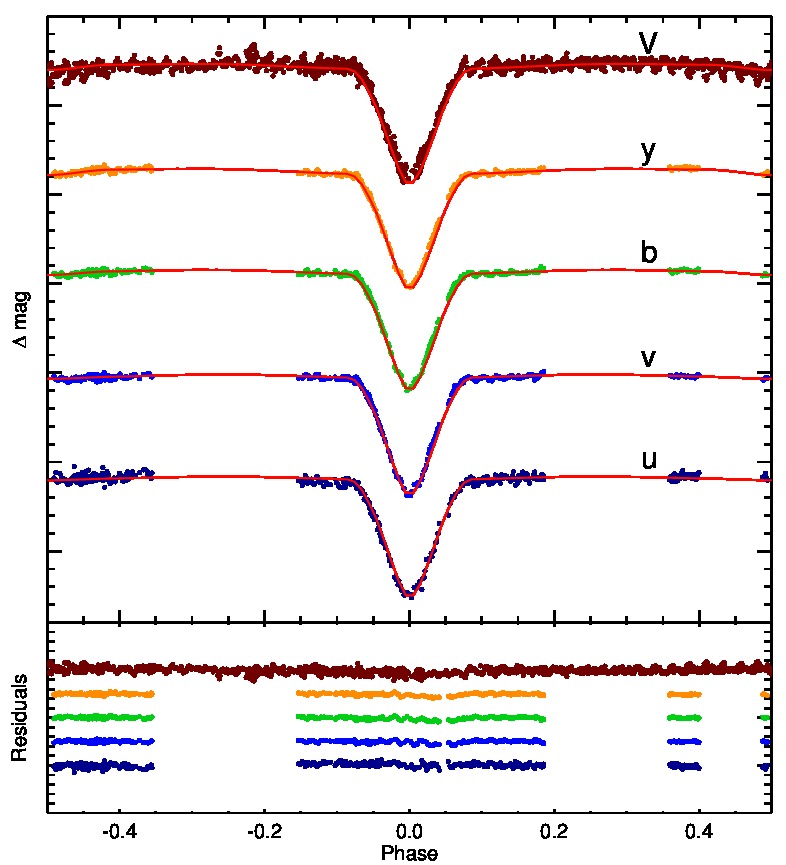
From the derived parameters of the binary modelling and assuming synchronous rotation, we have calculated the projected rotational velocities of each component, obtaining km s-1 for the primary and km s-1 for the secondary. The projected rotational velocity of the primary is in good agreement with the measurement from the grid of synthetic spectra. On the other hand, the of the secondary is quite high and the implied dilution could explain why we have not detected the spectral lines of the secondary star in our spectra.
8 Pulsation frequencies
| Filter | Frequency | Semi-amplitude | Phase | S/N |
|---|---|---|---|---|
| (c/d) | (mag) | |||
| 23.36(2) | 0.0062 | 0.89 | 4.7 | |
| 23.37(2) | 0.0058 | 0.52 | 7.6 | |
| 23.37(2) | 0.0059 | 0.11 | 5.4 | |
| 23.36(2) | 0.0047 | 0.56 | 6.2 |
After removing the binary model and avoiding the eclipses areas, we derived the frequency spectrum of the residual data to study the pulsations from the primary component of DY Aqr using period04 (Lenz & Breger, 2004). As mentioned above, DY Aqr was identified as an eclipsing binary system containing a -Scuti by Soydugan et al. (2009). In that work a frecuency of 23.39 c/d and an semi-amplitude of 0.006 mag were measured.
With OMC data the pulsational frecuency of 23.39 c/d found by Soydugan et al. (2009) is confirmed with a semi-amplitude of 0.005 mag, in agreement with the value they measured. However, with OMC data, two more frequencies at 19.56 c/d and semi-amplitude 0.014 mag and at 20.19 c/d and semi-amplitude 0.013 mag were found, being more significant than the previously reported one. This could be an indication of mode amplitude variations with time. In order to check if this was a real change in the pulsation characteristics of DY Aqr, we analised separately the Strömgren multi-colour photometry. The frequencies found at each filter are summarized in Table 5. We considered a peak to be significant if its S/N ratio is larger than 4.0. The error of these frequencies is the corresponding Rayleigh frequency resolution = 0.16 c/d. The spectral window and power spectrum for the first frequency are shown in Fig. 8, respectively. To confirm these results, we also performed the frequency analysis with SigSpec (Reegen, 2007) and the agreement between the two methods was good. We did not find any evidence from the analysis of the OSN data of the two additional frequencies detected in the OMC lightcurve.
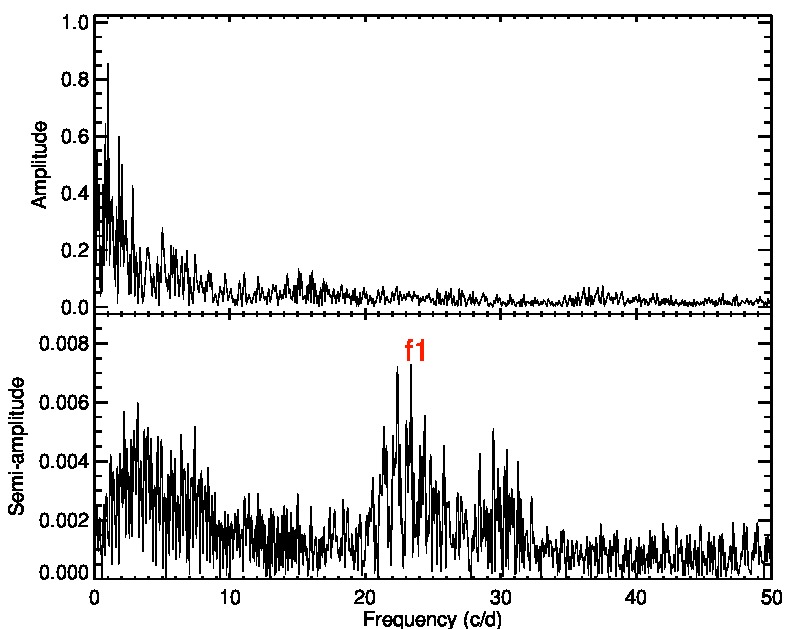
If we compare our results with the values reported by Soydugan et al. (2009), we conclude that no obvious amplitude variation is detected for the frequency of 23.39 c/d. We have analysed any potential instrumental effects that could explain the other frequencies detected in the OMC data, but none of them is able to justify these frequencies. Moreover, they appear in two different epochs, separated by one year. We plan to continue monitoring DY Aqr in the future looking for potential short-lived instabilities affecting its pulsation modes.
9 Evolution
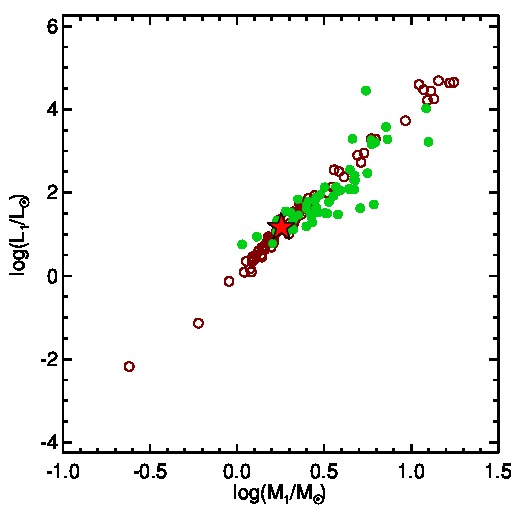
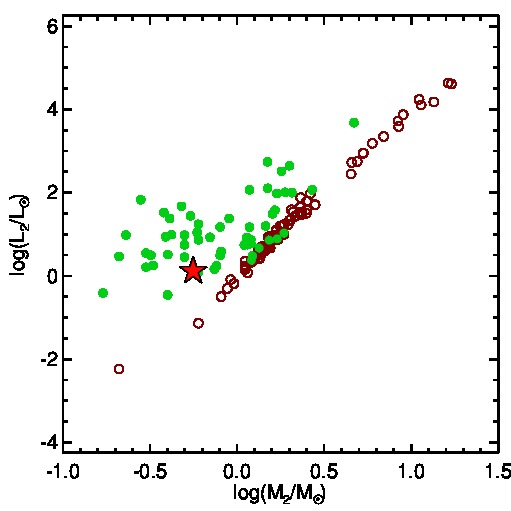
It is known that stars in close binary systems evolve in a different way than isolated stars do. Several mass-luminosity relations (MLRs) for eclipsing binaries have been obtained in the last years (Gorda & Svechnikov, 1998; Malkov, 2003). One of the main conclusions of these studies is that the systems with spectral type A and F have higher luminosities (radii) and temperatures than single stars with the same spectral type (Malkov, 2003). This fact is in good agreement with the results we obtained in our binary modelling. The primary component of DY Aqr has a larger radius than it would be expected for a single star with its temperature (Girardi et al., 2002). Ibanoǧlu et al. (2006) compiled a sample of Algol-type systems with well-determined absolute parameters and found a MLR for the primary and secondary components of detached and semi-detached Algol-type stars. In Fig. 9 we have plotted the luminosities of both components of detached and semi-detached systems against their masses as in Ibanoǧlu et al. (2006). We have overplotted the corresponding values for the primary and secondary components of DY Aqr obtained in this work. According to these plots, especially because of the behaviour of the secondary component, DY Aqr seems to present luminosities in agreement with being a semi-detached system.
10 Correlation between orbital and pulsational period
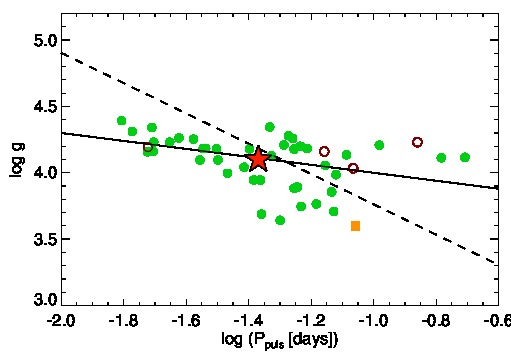
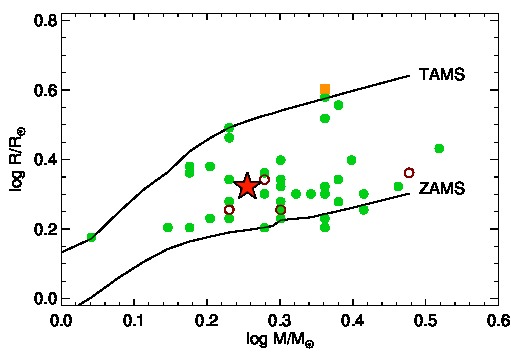
Soydugan et al. (2006) and Liakos et al. (2012) discovered a connection between the orbital and pulsation periods of the oEAs. Liakos et al. (2012) found an empirical relation between the pulsational frequency of the Scuti and the evolutionary state of the system, differing from the evolutionary behaviour of single Scuti stars.
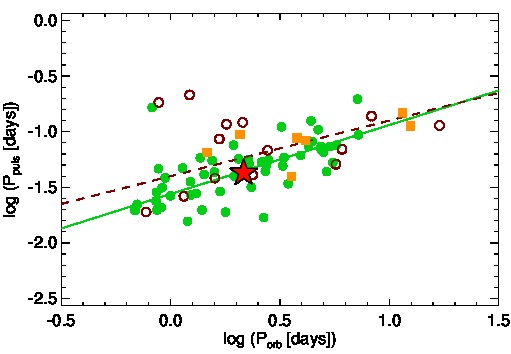
In Fig. 10 the parameters of DY Aqr are represented in similar plots as those shown by Liakos et al. (2012). It can be seen in the figure that DY Aqr behaves indeed as other semi-detached systems, which is consistent with our results, althought the difference between detached and semi-detached behaviour is not very evident in these plots. Furthermore, the bottom panel of this figure shows that DY Aqr is not very evolved yet, being located close to the ZAMS in the diagram.
On the other hand, Zhang et al. (2013) derived the following theoretical relation between the pulsation and orbital periods of pulsating stars in close binaries, based on their Roche lobe filling:
| (1) |
where
| (2) |
being the pulsation constant , the filling factor, the equivalent radius of the Roche lobe calculated from Eggleton (1983), and the mass ratio.
Fitting this equation to all the data they collected, they obtained the numerical relation:
| (3) |
which is very similar to the fit derived by Liakos et al. (2012) for semi-detached systems, as shown in the top panel of Fig. 10.
Applying the results obtained in this work, we derived for DY Aqr that , , and Q = 0.019 d. This value of the pulsation constant indicates that DY Aqr pulsates in p-modes, which is expected for a Scuti. If we use the orbital and pulsational periods of DY Aqr, we get , which is in perfect agreement with equation 3.
11 Conclusions
We have searched for Scuti stars in eclipsing binaries in the OMC–VAR catalogue of variable objects, confirming four previously detected eclipsing systems with a Scuti component and proposing a new candidate, AW Vel. We have performed a detailed analysis of one of the systems, DY Aqr, poorly studied in the past, and for which we had identified with OMC a possible change in the fundamental pulsational frequencies. Episodic mass-transfer events in these objects can indeed affect their pulsational characteristics.
High-resolution spectroscopy with HERMES/MERCATOR classifies the primary component of DY Aqr as an A7.5 V star, much cooler than previously reported.
The O-C diagram does not show any evidence of orbital period changes.
Binary modelling with phoebe combining the multicolour photometric ligth curves (OMC and OSN) and the radial velocity curve of the primary component (HERMES/MERCATOR) constraints the primary component to an effective temperature of K and and the secondary component to an effective temperature of K and . The detection of the spectrum of the secondary component would provide a better determination of the physical parameters of each component, but the secondary contribution was below the limit of detection in our data.
After removing the binarity effect from the light curves, the pulsational frequencies were studied through Fourier analysis. We did not confirm with the OSN data the first and second frequencies detected by OMC at 19.56 and 20.19 c/d. On the other hand, the same fundamental frequency found by Soydugan et al. (2009) at 23.39 c/d, also detected by OMC, was present in this ground-based photometry. The detection of these 2 additional frequencies by OMC can not be attributed to known instrumental effects, and point to a drastic, short-lived change in the pulsational characteristics. A further monitoring would be required to confirm short lived pulsational instabilities in this star.
The physical parameters obtained for each component of DY Aqr in the binary modelling are in agreement with the expected evolution of the components of a semi-detached Algol-system as given by Ibanoǧlu et al. (2006).
Finally, our conclusion of DY Aqr being an oEA is compatible with the results by Liakos et al. (2012) and Zhang et al. (2013) on how the mass-transfer in these systems affects their pulsational behaviour, but the detection of the secondary spectrum will be necessary to accurately determine the physical parameters of the system.
Acknowledgements
We want to thank the anonymous referee for his/her very helpful comments and suggestions. Thanks to Jesús Maldonado for his help with fxcor, to Andrej Prsă and Kelly Hambleton for their help with phoebe and to Petr Hadrava for his help with korel. The development, operation and exploitation of OMC have been funded by Spanish MICINN under grants AYA2012-38897-C02-01 and previous ones. INTEGRAL is an ESA project funded by ESA member states (especially the PI countries: Denmark, France, Germany, Italy, Spain, Switzerland), Czech Republic, Poland, and with the participation of Russia and the USA. OMC was also funded by Ireland, United Kingdom, Belgium and the Czech Republic. This research has made use of data from the OMC Archive at CAB (INTA-CSIC), pre-processed by ISDC, and of the SIMBAD database, operated at CDS, Strasbourg, France.
References
- Aerts et al. (2010) Aerts, C., Christensen-Dalsgaard, J., & Kurtz, D. W. 2010, Asteroseismology (Springer Science+Business Media B.V)
- Alfonso-Garzón et al. (2012) Alfonso-Garzón, J., Domingo, A., Mas-Hesse, J. M., & Giménez, A. 2012, A&A, 548, 79
- Baglin et al. (2009) Baglin, A., Auvergne, M., Barge, P., et al. 2009, IAU Symposium, 253, 71
- Baker & Kippenhahn (1961) Baker, N. & Kippenhahn, R. 1961, AJ, 66, 278
- Bianchi et al. (2011) Bianchi, L., Herald, J., Efremova, B., et al. 2011, Ap&SS, 335, 161
- Borucki et al. (2010) Borucki, W. J., Koch, D., Basri, G., et al. 2010, Science, 327, 977
- Breger (2000) Breger, M. 2000, in Breger M., Montgomery M. H., eds, ASP Conf. Ser, Vol. 210, Delta Scuti and Related Stars. Astron. Soc. Pac., San Francisco, p. 3
- Broglia & Conconi (1984) Broglia, P. & Conconi, P. 1984, A&A, 138, 443
- Broglia & Marin (1974) Broglia, P. & Marin, F. 1974, A&A, 34, 89
- Brown & Gilliland (1994) Brown, T. M. & Gilliland, R. L. 1994, ARA&A, 32, 37
- Buzasi et al. (2005) Buzasi, D. L., Bruntt, H., Bedding, T. R., et al. 2005, ApJ, 619, 1072
- Cardelli et al. (1989) Cardelli, J. A., Clayton, G. C., & Mathis, J. S. 1989, ApJ, 345, 245
- Castelli & Kurucz (2003) Castelli, F. & Kurucz, R. L. 2003, in N. Piskunov, W.W. Weiss, and D.F. Gray, eds, Proc. IAU Symp. 210, Modelling of Stellar Atmospheres. Astron. Soc. Pac., p. A20
- Chaplin & Miglio (2013) Chaplin, W. J. & Miglio, A. 2013, ARA&A, 51, 353
- Chini et al. (2012) Chini, R., Hoffmeister, V. H., Nasseri, A., Stahl, O., & Zinnecker, H. 2012, MNRAS, 424, 1925
- Chini et al. (2013) Chini, R., Nasseri, A., Dembsky, T., et al. 2013, EAS Publications Series, 64, 155
- Cutri et al. (2003) Cutri, R. M., Skrutskie, M. F., van Dyk, S., et al. 2003, VizieR Online Data Catalog, 2246, 0
- da Silva et al. (2014) da Silva R., Maceroni C., Gandolfi D., Lehmann H., Hatzes A. P., 2014, A&A, 565, A55
- De Cat & Aerts (2002) De Cat, P. & Aerts, C. 2002, A&A, 393, 965
- Eggleton (1983) Eggleton, P. P. 1983, ApJ, 268, 368
- Fernie (1995) Fernie, J. D. 1995, AJ, 110, 2361
- Gilliland et al. (2010) Gilliland, R. L., Brown, T. M., Christensen-Dalsgaard, J., et al. 2010, PASP, 122, 131
- Girardi et al. (2002) Girardi, L., Bertelli, G., Bressan, A., et al. 2002, A&A, 391, 195
- Gorda & Svechnikov (1998) Gorda S. Y., Svechnikov M. A., 1998, ARep, 42, 793
- Gray & Corbally (2009) Gray, R. O. & Corbally, J., . C. 2009, Stellar Spectral Classification, Princeton Univ. Press, Princeton, NJ
- Gutiérrez et al. (2004) Gutiérrez, R., Solano, E., Domingo, A., & García, J. 2004, Astronomical Data Analysis Software and Systems (ADASS) XIII, 314, 153
- Hadrava (1995) Hadrava, P. 1995, A&AS, 114, 393
- Hadrava (1997) Hadrava, P. 1997, A&AS, 122, 581
- Hambleton et al. (2013) Hambleton, K. M., Kurtz, D. W., Prša, A., et al. 2013, MNRAS, 434, 925
- Handler et al. (2002) Handler, G., Balona, L. A., Shobbrook, R. R., et al. 2002, MNRAS, 333, 262
- Ibanoǧlu et al. (2006) Ibanoǧlu C., Soydugan F., Soydugan E., Dervişoǧlu A., 2006, MNRAS, 373, 435
- Kim et al. (2002) Kim, S., Lee, J. W., Youn, J., Kwon, S., & Kim, C. 2002, A&A, 391, 213
- Kreiner (2004) Kreiner, J. M. 2004, Acta Astron., 54, 207
- Kurucz (1993) Kurucz, R. L. 1993, SYNTHE spectrum synthesis programs and line data: Smithsonian Astrophysical Observatory, 1993, 18
- Kwee & van Woerden (1956) Kwee, K. K. & van Woerden, H. 1956, Bulletin of the Astronomical Institutes of the Netherlands, 12, 327
- Lampens (2006) Lampens, P. 2006, in Sterken, C. and Aerts, C., eds, ASP Conf. Ser. Vol 349, Astrophysics of Variable Stars. Astron. Soc. Pac., San Francisco, p. 153
- Lehmann et al. (2013) Lehmann H., Southworth J., Tkachenko A., Pavlovski K., 2013, A&A, 557, A79
- Lenz & Breger (2004) Lenz, P. & Breger, M. 2004, in IAU Symposium, Vol. 224, The A-Star Puzzle, 786–790
- Liakos et al. (2012) Liakos, A., Niarchos, P., Soydugan, E., & Zasche, P. 2012, MNRAS, 422, 1250
- Maceroni et al. (2014) Maceroni C., et al., 2014, A&A, 563, A59
- Malkov (2003) Malkov O. Y., 2003, A&A, 402, 1055
- Malkov et al. (2006) Malkov, O. Y., Oblak, E., Snegireva, E. A., & Torra, J. 2006, A&A, 446, 785
- Mas-Hesse et al. (2003) Mas-Hesse, J. M., Giménez, A., Culhane, J. L., et al. 2003, A&A, 411, L261
- Mason et al. (2001) Mason, B. D., Gies, D. R., & Hartkopf, W. I. 2001, ASSL, 264, 37
- Mason et al. (2009) Mason, B. D., Hartkopf, W. I., Gies, D. R., Henry, T. J., & Helsel, J. W. 2009, AJ, 137, 3358
- Mayor et al. (2001) Mayor, M., Udry, S., Halbwachs, J., & Arenou, F. 2001, in IAU Symposium, Vol. 200, The Formation of Binary Stars, Postdam, Germany, p. 45
- McLaughlin (1924) McLaughlin, D. B. 1924, ApJ, 60, 22
- Michalska & Pigulski (2007) Michalska, G. & Pigulski, A. 2007, Communications in Asteroseismology, 150, 71
- Mihalas (1978) Mihalas, D. 1978, Stellar Atmospheres (W. H. Freeman)
- Mkrtichian et al. (2007) Mkrtichian, D. E., Kim, S., Rodríguez, E., et al. 2007, in O. Demircan, S. O. Selam, and B. Albayrak, eds, ASP Conf. Ser., Vol. 370, Solar and Stellar Physics Through Eclipses. Astron. Soc. Pac., San Francisco, p. 194
- Mkrtichian et al. (2004) Mkrtichian, D. E., Kusakin, A. V., Rodriguez, E., et al. 2004, A&A, 419, 1015
- Mkrtichian et al. (2003) Mkrtichian, D. E., Nazarenko, V., Gamarova, A. Y., et al. 2003, in Interplay of Periodic, Cyclic and Stochastic Variability in Selected Areas of the H-R Diagram, Vol. 292, 113
- Paschke & Brat (2006) Paschke, A. & Brat, L. 2006, Open European Journal on Variable Stars, 23, 13
- Pigulski & Michalska (2007) Pigulski, A. & Michalska, G. 2007, Acta Astron., 57, 61
- Prša & Zwitter (2005) Prša, A. & Zwitter, T. 2005, ApJ, 628, 426
- Prša et al. (2008) Prša, A., Guinan, E. F., Devinney, E. J., & Engle, S. G. 2008, A&A, 489, 1209
- Prša et al. (2011) Prša, A., Batalha, N., Slawson, R. W., et al. 2011, AJ, 141, 83
- Raskin et al. (2011) Raskin, G., van Winckel, H., Hensberge, H., et al. 2011, A&A, 526,
- Reegen (2007) Reegen, P. 2007, A&A, 467, 1353
- Rodríguez & Breger (2001) Rodríguez, E. & Breger, M. 2001, A&A, 366, 178
- Rodríguez et al. (2007) Rodríguez, E., García, J. M., Costa, V., et al. 2007, Communications in Asteroseismology, 150, 63
- Rodríguez et al. (2010) Rodríguez, E., García, J. M., Costa, V., et al. 2010, MNRAS, 408, 2149
- Rossiter (1924) Rossiter, R. A. 1924, ApJ, 60, 15
- Rucinski (1969) Rucinski, S. M. 1969, Acta Astron., 19, 245
- Samus et al. (2009) Samus, N. N., Durlevich, O. V., & et al. 2009, VizieR Online Data Catalog, 1, 2025
- Sana & Evans (2011) Sana, H., & Evans, C. J. 2011, IAU Symposium, 272, 474
- Schmidt-Kaler (1982) Schmidt-Kaler, T., 1982, in: Landolt-Börnstein, Vol. 2b, eds. K. Schaifers, H. H. Voig. Springer, Heidelberg
- Soydugan et al. (2006) Soydugan, E., Soydugan, F., Demircan, O., & İbanoǧlu, C. 2006, MNRAS, 370, 2013
- Soydugan et al. (2009) Soydugan, E., Soydugan, F., Senyuz, T., et al. 2009, IBVS, 5902, 1
- Soydugan et al. (2010) Soydugan, E., Soydugan, F., Şenyüz, T., et al. 2010, ASP Conf. Ser. Vol. 435, Binaries - Key to Comprehension of the Universe. Astron. Soc. Pac., San Francisco, p. 331
- Soydugan et al. (2011) Soydugan, E., Soydugan, F., Şenyüz, T., Püsküllü, c., & Demircan, O. 2011, New A, 16, 72
- Stellingwerf (1978) Stellingwerf, R. F. 1978, ApJ, 224, 953
- Svechnikov & Kuznetsova (1990) Svechnikov, M. A. & Kuznetsova, E. F. 1990, Katalog priblizhennykh fotometricheskikh i absoliutnykh elementov zatmennykh peremennykh zvezd: Izd-vo Ural’skogo universiteta, 1990- (Sverdlovsk : Izd-vo Ural’skogo universiteta, 1990-)
- Walker et al. (2003) Walker, G., Matthews, J., Kuschnig, R., et al. 2003, PASP, 115, 1023
- Watson et al. (2012) Watson, C., Henden, A. A., & Price, A. 2012, VizieR Online Data Catalog, 1, 02027
- Watson (2006) Watson, C. L. 2006, Journal of the American Association of Variable Star Observers (JAAVSO), 35, 318
- Wilson (1979) Wilson, R. E. 1979, ApJ, 234, 1054
- Wilson & Devinney (1971) Wilson, R. E. & Devinney, E. J. 1971, ApJ, 166, 605
- Winkler et al. (2003) Winkler, C., Courvoisier, T. J. L., Di Cocco, G., et al. 2003, A&A, 411, L1
- Zasche (2011) Zasche, P. 2011, New A, Volume 16, Issue 3, p. 157-160., 16
- Zhang et al. (2013) Zhang, Y. X., Zhou, X. L., Zhao, Y. H., & Wu, X. B. 2013, ApJ, 145, 42
- Zhou (2010) Zhou, A. Y. 2010, ArXiv e-prints, 1002, 2729