The supergiant shell with triggered star formation in Irr galaxy IC 2574: neutral and ionized gas kinematics.
Abstract
We analyse the ionized gas kinematics in the star formation regions of the supergiant shell (SGS) of the IC 2574 galaxy using observations with the Fabry–Perot interferometer at the 6-m telescope of SAO RAS; the data of the THINGS survey are used to analyze the neutral gas kinematics in the area. We perform the ‘derotation’ of the H and H i data cubes and show its efficiency in kinematics analysis. We confirm the SGS expansion velocity 25 obtained by Walter & Brinks (1999) and conclude that the SGS is located at the far side of the galactic disc plane. We determine the expansion velocities, kinematic ages, and the required mechanical energy input rates for four star formation complexes in the walls of the SGS; for the remaining ones we give the limiting values of the above parameters. A comparison with the age and energy input of the complexes’ stellar population shows that sufficient energy is fed to all H ii regions except one. We discuss in detail the possible nature of this region and that of another one, which was believed to be an SNR according to radio observations. We measured the expansion velocity of the latter and confirm its identification as an old SNR. Our observations allowed us to identify a faint diffuse H emission inside the SGS which was never observed before.
keywords:
galaxies: individual: IC 2574 – galaxies: star formation – ISM: bubbles – ISM: kinematics and dynamics1 Introduction.
Extensive observations of kpc large supergiant shells (SGS) and holes in the H i distribution in galaxies have been performed for a long time (see e.g. Warren et al., 2011). Giant holes in some dwarf irregular (dIrr) galaxies represent the dominant feature of the ISM (see e.g. Young & Lo, 1997; Ott et al., 2001; Simpson, Hunter & Knezek, 2005; Cannon et al., 2011a; Warren et al., 2011, and references therein) and their origin has been the subject of debate for more than two decades. In the standard approach based on the Weaver et al. (1977) model, H i shells result from the cumulative action of multiple stellar winds and supernovae explosions (see e.g. McCray & Kafatos, 1987; Tenorio-Tagle & Bodenheimer, 1988; Ott et al., 2001). However, it was recognized long ago (see, e.g., Tenorio-Tagle & Bodenheimer, 1988; Rhode et al., 1999; Kim et al., 1999; Simpson at al., 2005; Silich et al., 2006) that this scenario cannot explain the origin of giant supershells in which the mechanical energy input from the detected stellar clusters appears to be inconsistent with that required by the standard model. Several other mechanisms have been proposed for the formation of the observed H i distribution and kinematics in galaxies: collisions of high velocity clouds with galactic discs (Tenorio-Tagle, 1981), radiation pressure from field stars (Elmegreen & Chiang, 1982), non-linear evolution of self-gravitating turbulent galactic discs (Wada, Spaans & Kim, 2000; Dib & Burkert, 2005), ram pressure of the intergalactic medium (Bureau & Carignan, 2002), fractal ISM (Elmegreen, 1997), H i dissolution by UV radiation (Vorobyov & Shchekinov, 2004), and even exotic mechanisms (see references in Silich et al. 2006 and Warren et al. 2011).
Recent studies have found that multiple star formation events over the lifetime of the giant hole do provide enough energy to drive the hole formation. The situation has become clear as a result of Hubble Space Telescope (HST) observations. Weisz et al. (2009a) showed that the holes in the Holmberg II galaxy contain multiple stellar generations and could indeed be formed from the energy input of these stars. Today it is clear that high star-formation rates can be maintained for a much longer time period than previously believed: dwarf galaxies are characterized by the ability to sustain a high star-formation efficiency over several hundred Myr, and even up to 1000 Myr in some cases (McQuinn et al., 2009, 2010a, 2010b), with local short starbursts occurring during this period. Such long periods of intense star formation provide enough energy from stellar winds and supernova explosions to drive the formation of giant cavities and supergiant shells (see e.g. Weisz et al., 2009a, b; Cannon et al., 2011a, b). Note that a number of SGSs exhibit conspicuous signs of expansion-triggered star formation at their periphery. Of special interest is a detailed analysis of the interaction of stars and gas in the regions of new star formation sites in the walls of giant shell-like H i structures, which can elucidate the process of their evolution.
Dwarf irregular galaxies provide the best environment for studying the creation mechanisms of giant H i structures with star-formation episodes on their rims. Because of the slow solid-body rotation and the lack of strong spiral density waves which can destroy the giant shells, they grow to a larger size and live longer compared to such structures in spiral galaxies. The overall gravitational potential of dwarfs is much smaller than that of spiral galaxies, their H i disc scale height is larger and the gas volume density is lower than in spirals. Therefore the same amount of mechanical energy fed to the ISM of dwarf Irr galaxies creates very large long-lived holes with star formation in the walls triggered by their expansion.
The aim of this work is to clarify the effect on supergiant HI shells of new bursts of star formation in their walls. For this purpose we analyse the recent bursts of star formation in the rims of the well known ’supergiant shell’ in the dIrr galaxy IC 2574 based on the detailed kinematics of both neutral and ionized gas.
The IC 2574 galaxy (alternative names: UGC 5666, DDO 81, VII Zw 330), which is a member of the M81 group, is located at a distance Mpc (1 arcsec = 19.5 pc) according to Karachentsev et al. (2013); the systemic velocity of IC 2574 is . It hosts a large number of giant H i supershells and holes: 48 holes have been identified by Walter & Brinks (1999), 27 holes – by Bagetakos et al. (2011); see also Rich et al. (2008). The difference in the total number of holes is due to the different criteria used to classify a structure as a hole or a supershell.
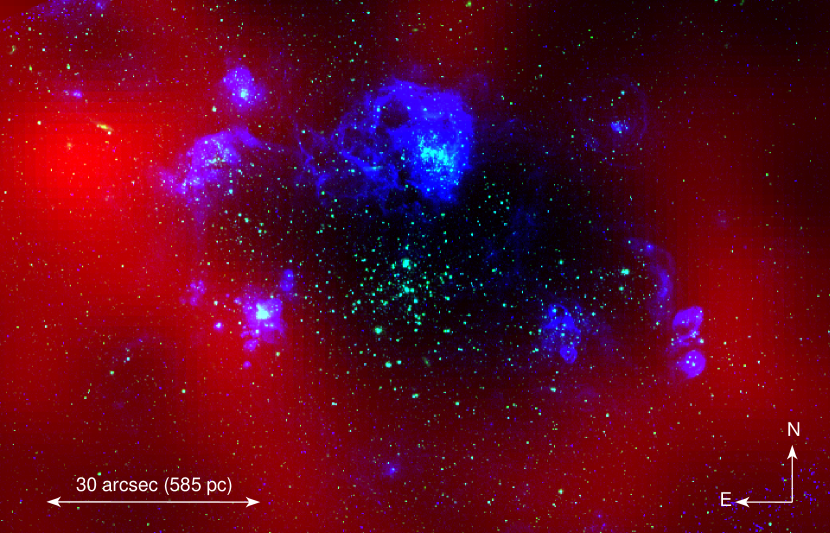
The SGS surrounding a pc hole in the most prominent region of current and recent star-formation activity near the N-E outskirts of the IC 2574 galaxy represents an impressive example of a giant H i shell with triggered SF along the rims (see Fig. 1 and Fig. 2). It is the best candidate for a detailed study of the interplay between the recent bursts of star formation and the gas in the rims of giant supershells. This elliptical SGS denoted as # 35 in the list of Walter & Brinks (1999) has been extensively studied at radio (Walter et al., 1998; Walter & Brinks, 1999), UV (Stewart & Walter, 2000), optical (Tomita et al., 1998; Pasquali et al., 2008; Weisz et al., 2009b), mid-infrared (Cannon et al., 2005; Dalcanton et al., 2012), and X-ray wavelengths (see Walter et al., 1998; Yukita & Swartz, 2012, and references therein).
An analysis of the resolved stars based on HST data (Weisz et al., 2009b) shows that the last most significant episodes of star formation in the SGS began 100 Myr ago and the recent bursts of star formation along its walls are as young as Myr. The ages of the younger star-formation events are consistent with those derived from broadband photometry (e.g., Stewart & Walter 2000; Cannon et al. 2005; Pasquali et al. 2008) and are younger than the estimated kinematic age of the H i shell, Myr (Walter et al., 1998; Walter & Brinks, 1999).
In this paper we present a new study of the morphology and kinematics of ionized and neutral gas in the SGS. Our analysis is based on observations made with the 6-m telescope of the Special Astrophysical Observatory (SAO RAS). We also use the Very Large Array (VLA) 21 cm observations of H i gas in the galaxy from the THINGS survey (Walter et al., 2008).
The paper is organized as follows: in Section 2 we describe the observations and data reduction. Section 3 presents the results of our re-estimation of the SGS expansion velocity from the 21 cm data. Section 4 presents an analysis of ionized gas kinematics in the star-formation regions in the rims of the SGS. In Section 5 we discuss the obtained results. Section 6 summarizes our main conclusions.
2 Observations and data reduction
2.1 Optical FPI-observations
| Data set | Date of obs | FOV | , ′′ | sp. range | or | ||
|---|---|---|---|---|---|---|---|
| scanning FPI | 17/18 Oct 2012 | sec | 0.71 | 2.1 | 8.8Å around H | 0.48Å () | |
| 18/19 Oct 2012 | sec | ||||||
| THINGS H i | 03 Sep 1992 | 14 h | 1.5 | around 21 cm | |||
| FN655 image | 07/08 Mar 2013 | 1800 sec | 0.36 | 2.0 | H [N ii] | ||
| FN674 image | 07/08 Mar 2013 | 3000 sec | 0.36 | 2.0 | [S ii] | ||
| long-slit | 19/20 Nov 2012 | 3600 sec | 0.35 | 1.7 | 5800–7400Å | 5.5Å | |
| F658N image | 6 Jan 2008 | 1200 sec | 0.05 | 0.09 | H [N ii] | ||
| F814W image | 6 Jan 2008 | 6400 sec | 0.05 | 0.10 | continuum |
The observations were made at the prime focus of the 6-m telescope of SAO RAS using a scanning Fabry–Perot interferometer (FPI) mounted inside the SCORPIO-2 multi-mode focal reducer (Afanasiev & Moiseev, 2011). The operating spectral range around the H emission line was cut by a narrow bandpass filter with a Å bandwidth. The FPI751 interferometer provides a free spectral range between the neighbouring interference orders Å with a spectral resolution (FWHM of the instrumental profile) of about Å. During the scanning process, we have consecutively obtained 40 interferograms at different distances between the FPI plates. The log of these observations and the parameters of other data sets are given in Table 1, where is the exposure time, FOV – the field of viev, – the final angular resolution, and or is the final spectral or velocity resolution.
The data reduction was performed using a software package running in the idl environment. After the initial reduction, sky line subtraction, and photometric and seeing corrections made using the reference stars and wavelength calibration, the observational data were combined into data cubes, where each pixel in the field of view contains a 40-channel spectrum. (For a detailed description of the data reduction algorithms and software see Moiseev 2002 and Moiseev & Egorov 2008.) We observed the galaxy at two position angles in order to remove the parasitic ghost reflection. These data were reduced separately to get the wavelength cubes of the object. Both cubes were then co-added.
In order to get rid of the stellar continuum emission in the constructed data cube and reveal only the gas emission details, we perform a second-order background fit in each pixel at the edges of the line profiles and subtract it. The analysis of the H line profiles was carried out using the multi-component Voigt fitting (Moiseev & Egorov, 2008).
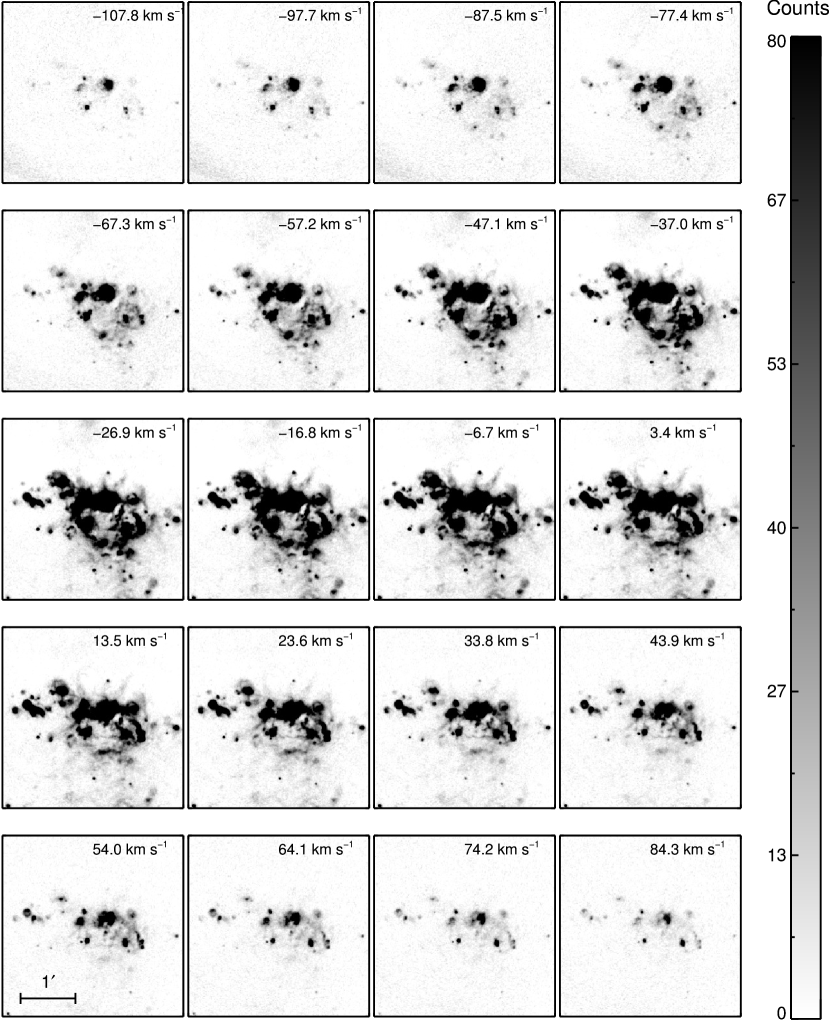
The channel maps of data cube obtained shown in Fig. 17 in Appendix.
2.2 Narrow-band imaging
The deep optical images in the H and [S ii] emission lines were taken at the prime focus of the 6-m telescope of SAO RAS with SCORPIO-2 multi-mode focal reducer using filters FN655 and FN674 with the central wavelengths 6559 and 6733 Å and FWHM = 97 and 60 Å respectively. While the FWHM of the FN655 filter is broader than the distance between the H and [N ii] emission lines, the image in this filter is contaminated by [N ii] 6548, 6584 Å emission. The image obtained with FN674 represents the emission of the [S ii] 6717, 6731 Å lines.
We used the broader-band FN608 and i-SDSS filters centered on the continuum near the two emission lines to subtract the stellar contamination from the images obtained on the same night. Note that the subtraction was not ideal and residuals due to the stellar contribution can be seen in our final images in several regions, especially in those taken in the [S ii] lines. In order to calibrate the emission-line images to energy fluxes we observed the standard star AGK+81d266 immediately after observing the galaxy.
2.3 Other observational data
In order to study the H i gas kinematics in the SGS, we analysed archival H i 21 cm line THINGS survey VLA data (Walter et al., 2008). In this work we used the natural-weighted data cube (see the parameters in Table 1).
We performed long-slit spectroscopy of the H ii regions in IC 2574 with the 6-m telescope of SAO RAS and the SCORPIO focal reducer (Afanasiev & Moiseev, 2005). An analysis of these data will be presented in our forthcoming work (Egorov et al., in preparation); here we use the data obtained with one slit position to analyse the I([S ii])/I(H) ratio distribution in H ii Region # 7 (see Sec. 5.1).
To study the ionized gas morphology in the SGS region we used the archival HST Advanced Camera for Survey (ACS) images in the F658N filter (which contains the H + [N ii] emission lines) and the F814W filter presented in Weisz et al. (2008, 2009b).
2.4 Construction of a circular rotation model
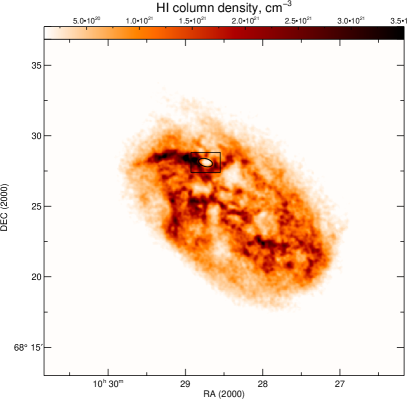
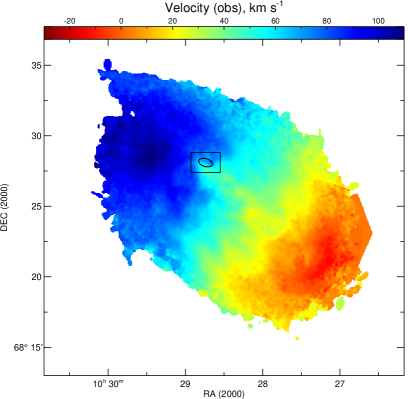
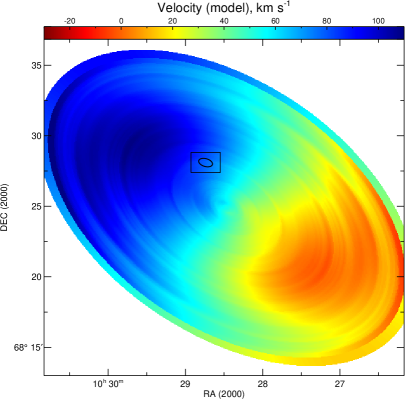
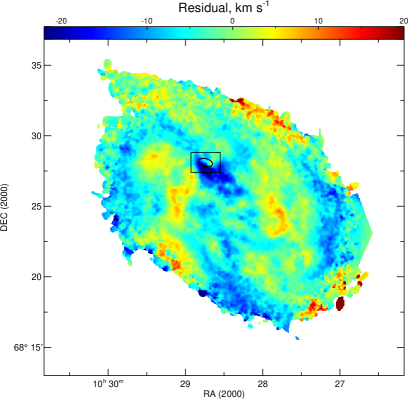
The structure and kinematics of gas in the region around the SGS are very complex and it would therefore be useful to exclude the regular component associated with the rotation of the galaxy to understand its local kinematics. We construct a rotation model of IC 2574 from the H i velocity field (moment 1) using the tilted-ring approximation adapted to dwarf galaxy kinematics (Moiseev, 2014). The coordinates of the dynamical centre, the inclination and the initial value of the major axis position angle were adapted from Oh et al. (2008), who performed a careful study of the H i kinematics of this galaxy. The model takes into account the radial variation of the position angle of the kinematic major axis in order to describe the large-scale non-circular streaming motions associated with the bar and two-armed spiral structure. The final model is based only on the data for the regions whose velocity does not deviate significantly from the initial model based on the entire field. Figure 2 shows the model velocity map as well as the observed velocity field, residual velocities and H i column density map.
We correlated the observed data cubes as follows. The velocity of each spectral channel in each pixel was modified by the value of the radial velocity at a given location in the galaxy taken from the rotation model. A new velocity grid (common for all pixels) was then constructed with the same velocity sampling. The spectrum from each spatial element was then interpolated (‘derotated’) to the new velocity grid and a new data cube was constructed. This procedure was carried out for the H i 21cm and H line data cubes presented below. To demonstrate the result of this correction we show two position – velocity (PV) diagrams along and across the SGS in Fig. 3, where the corrected PV diagrams denoted as ‘derotated’. The effect of ‘derotation’ is most clearly seen on PV diagram # 1 since it crosses the SGS in the direction of significant line-of-sight velocity gradient. Considering the relatively large size of the investigated area and hence a possible large contribution of galactic rotation to the PV diagrams, the ‘derotation’ allowed us to eliminate the effect of the disc rotation and to emphasize the local kinematics.
3 Global gas kinematics of the SGS
Two reasons prompted us to re-estimate the expansion velocity of the H i SGS. First: Walter & Brinks (1999) measured (see also Walter et al. 1998). However, Weisz et al. (2009b) point out that ‘Walter & Brinks (1999) measure an H i expansion velocity of from a break in the PV diagram, which is only an indirect measure of expansion, and in fact is consistent with stalled expansion as well’. Second: the neighbourhood of the SGS is a dynamically very complex region of the galaxy in the 21 cm line, making it difficult to distinguish the effect of SGS expansion.
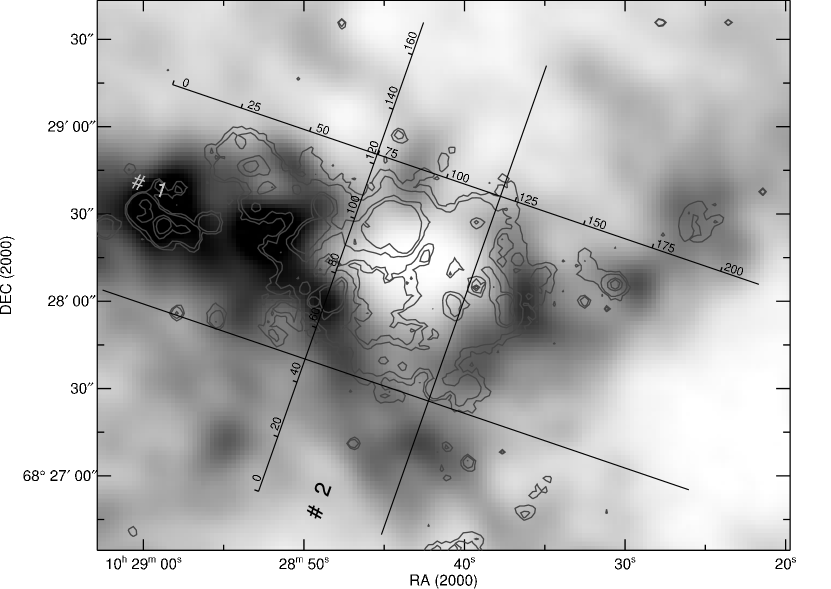
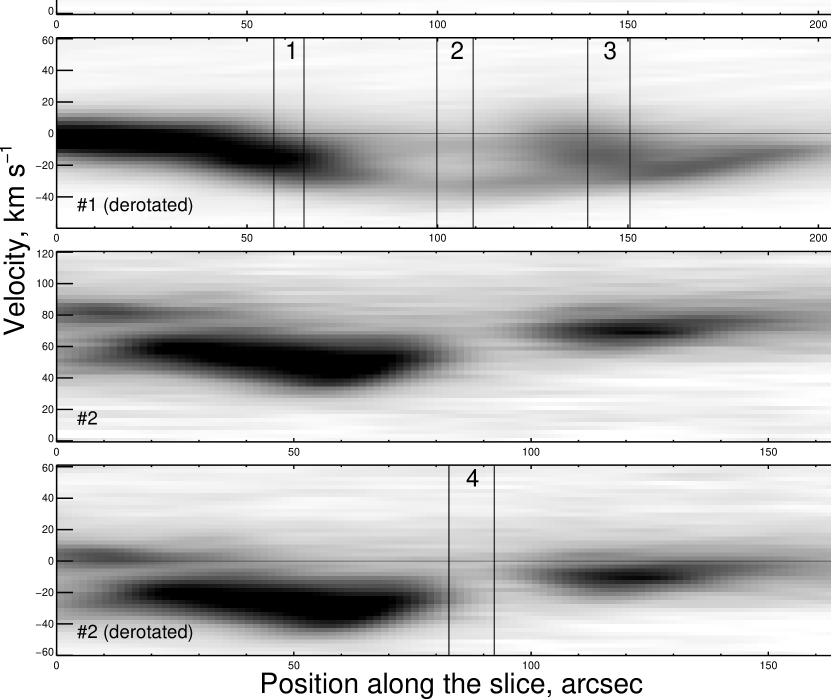
We made two wide PV diagrams along the SGS major and minor axes (their full width was 75 and 45 arcsec, respectively). Figure 3 shows the location of these wide scans and the corresponding PV diagrams. A clear ‘velocity ellipse’ corresponding to the emission of the approaching and receding sides of the shell is seen on the ‘derotated’ PV diagram # 1 in this figure.
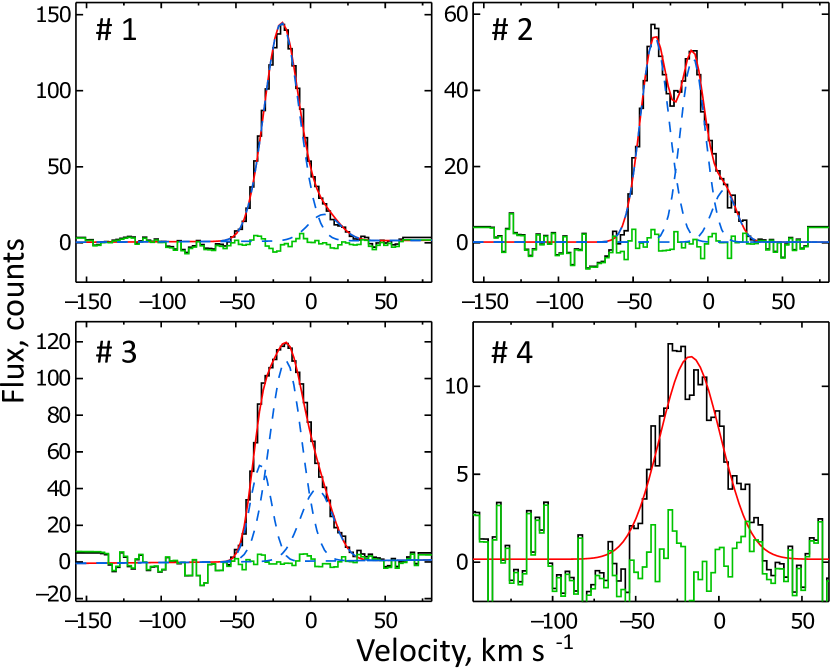
To provide an accurate estimate of the expansion velocity of neutral gas in the entire SGS region we made a Gausssian decomposition of the H i 21 cm line profile at several positions along the PV diagram. These positions are shown in Fig. 3, and the corresponding line profiles – in Fig. 4. All profiles show a complex structure and can be decomposed into two or three components. The maximum velocity difference between the components is observed in line profile # 2 from the entire SGS region. This difference is , implying that the expansion velocity111Hereinafter, we give the formal uncertainties of the expansion velocity measurements obtained by fitting synthetic spectra with the same signal-to-noise ratio as the observed spectra in this area is about . Profile # 4 constructed for the SGS region at the position shown in the bottom PV diagram in Fig. 3 is not separated into components, but its FWHM is the same as for profile # 2. All these results confirm the value estimated by Walter & Brinks (1999).
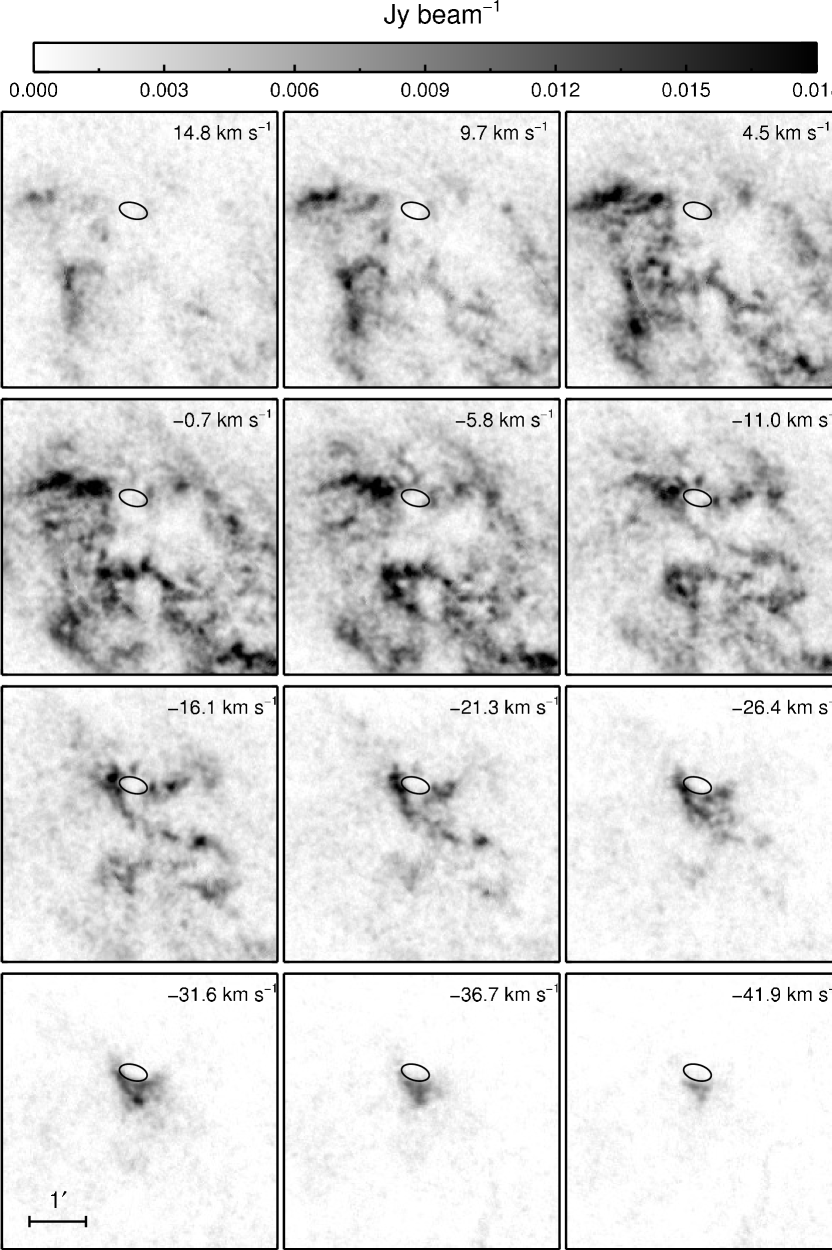
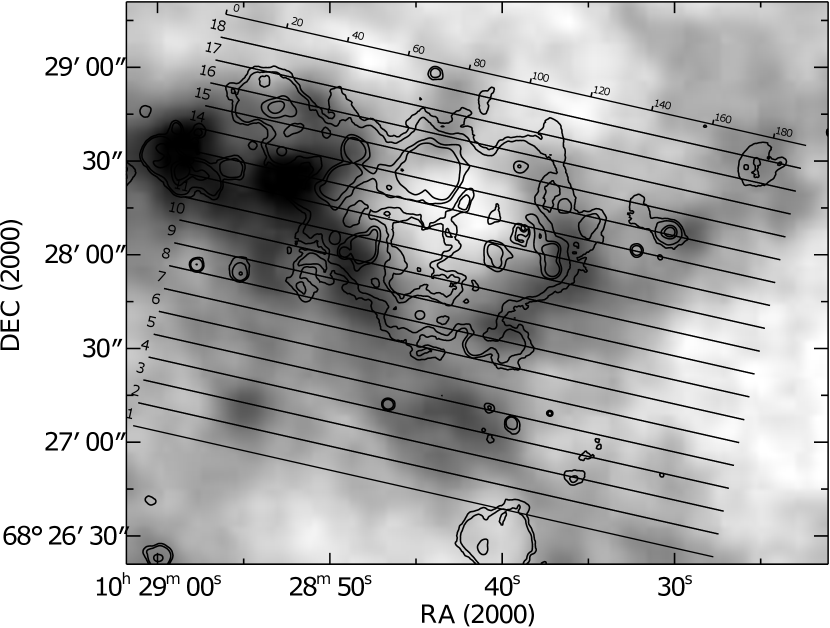
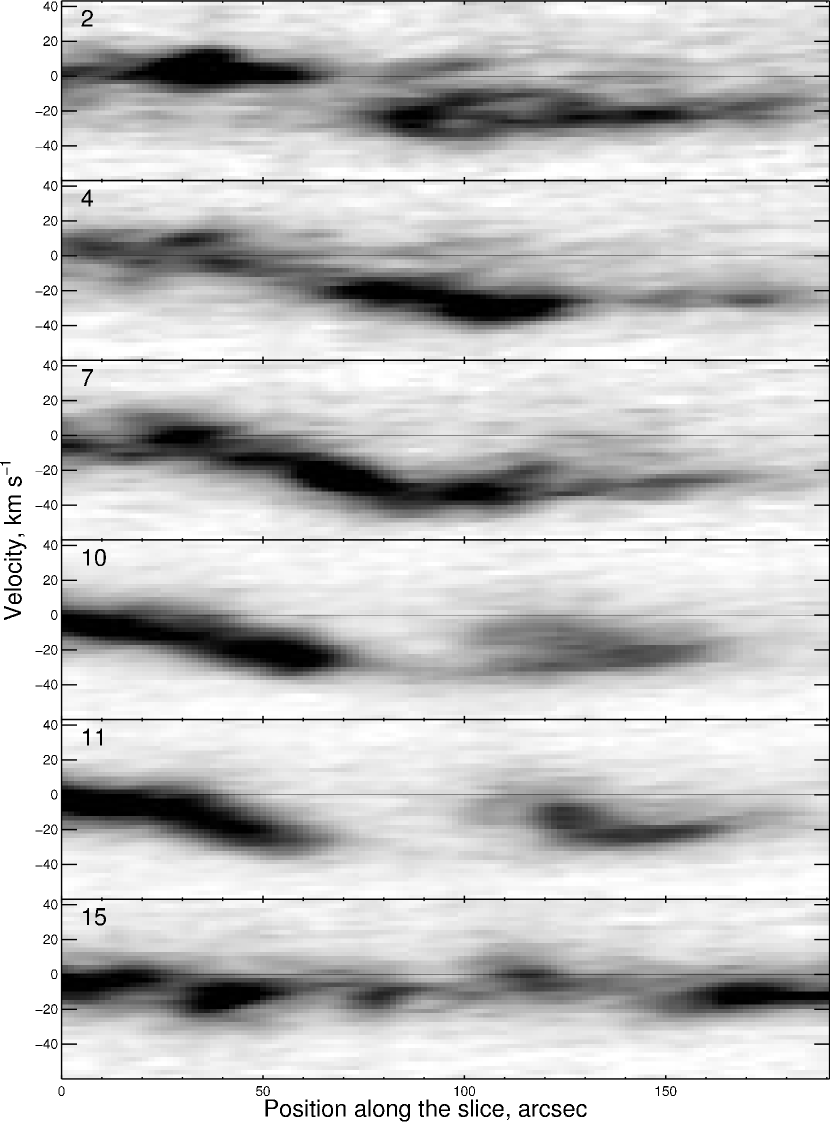
The vicinity of the SGS is a place where several contacting and, possibly, interacting shells are located. It is the only region showing significant deviations of the line-of-sight velocity field from the fitted circular rotation model (see the bottom right panel in Fig. 2). If these peculiar velocities occur in the disc plane, they should represent the inflow of gas into the large-scale stellar bar, because in the case of a normal trailing spiral the SE-half of the galaxy’s disc is nearest to the observer. An alternative explanation of the observed kinematics is their attribution to vertical gas motions caused, for example, by the fall of an H i gas cloud or vice versa, by SGS expansion. The channel map of the ‘derotated’ data cube (Fig. 5) reveals that these negative residual velocities are related to the high-velocity () H i cloud, which moves towards us and is located south of and adjacent to the SGS. It is the only place in the galaxy that emits in the H i 21 cm line at such high negative velocities. At smaller velocities the channel map shows a pattern typical of expanding shells: the bright approaching southeastern part of the SGS can be seen mostly at negative velocities, whereas the faint receding northwestern part shows up at positive velocities. Note that the SGS has a non-uniform structure which is very different from the regular elliptical shape that most authors use to describe the central hole. The observed elliptical shape of the SGS is due to the inclination of the galaxy, (Oh et al., 2008). In the first approximation, the shell has a round shape if seen in the plane of the galaxy. Because of the non-uniform structure and kinematics of neutral gas in the extended NE region of the galaxy, we decided to analyse the H i kinematics in the region in more detail. For this aim, we created 18 PV diagrams along the SGS major axis, each with a width of 7.5 arcsec; they cover a arcmin area around the SGS. Their location is shown in the top panel of Fig. 6; the bottom panels show the most interesting PV diagrams. The approaching side of the shell shows up conspicuously in these diagrams, whereas the contribution of the receding side to the neutral hydrogen emission is barely discernible. This may be due to the fact that the density of the ambient gas at the receding side of the SGS is lower than at the approaching side. Hence the SGS must reside at the far side of the galactic disc.
4 Ionized gas kinematics in star formation regions
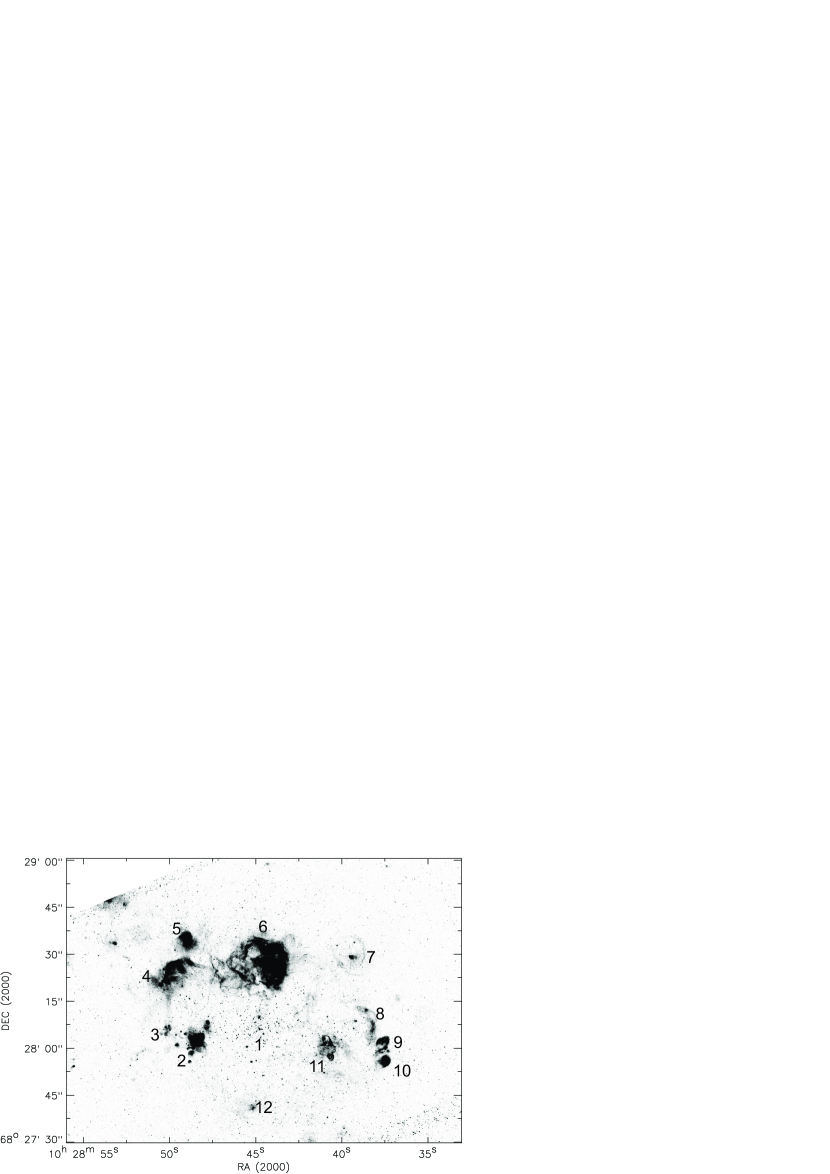
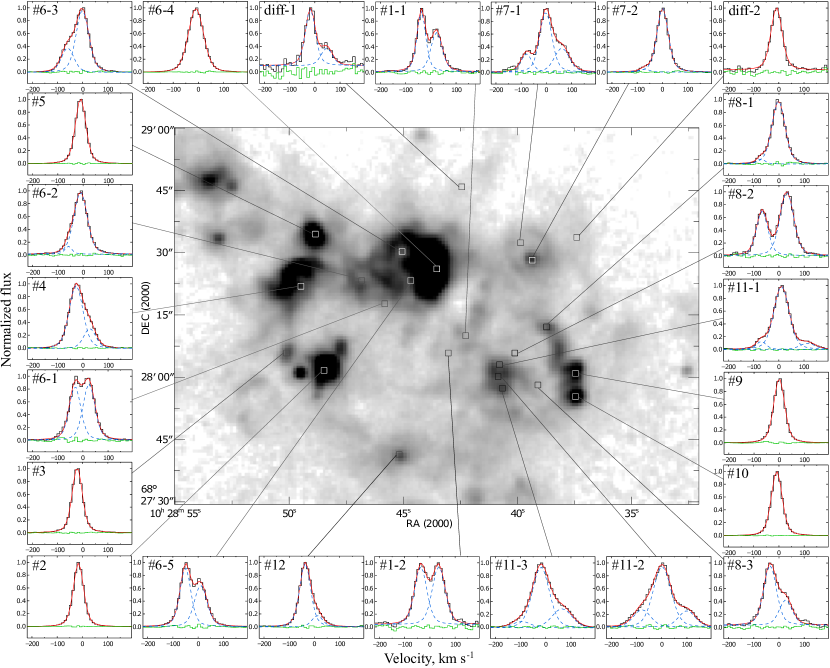
The rims of SGS contain numerous groups of triggered star-formation that are observed as H ii complexes. The H image of the region obtained with HST/ACS is shown in Fig. 7. The complexes of star formation are denoted by numbers according to their identification in Stewart & Walter (2000). Note that these authors named the region of FUV emission around the central star cluster inside the SGS ‘Region # 1’. They noticed the absence of H emission in this region. We detected faint extended H emission inside the interior of the SGS. We therefore designated as Region # 1 not only the area near the central cluster, but the entire interior of the SGS.
To study the nature of the H ii complexes in the wall of the SGS we evaluated their expansion velocities. Given the size and expansion velocity of the H ii shell one can estimate its kinematic age and the energy input rate needed for its formation using the relations that describe the evolution of the supershell driven by supernovae and stellar wind (Mac Low & McCray, 1988):
| (1) |
| (2) |
where , , and is the ambient gas volume density (in our case, the ambient H i density ). According to Walter et al. (1998), the mean value in the SGS is . The density distribution in the SGS walls is highly non-uniform and therefore for our analysis of H ii complexes we estimate the local unperturbed H i density in their neighbourhood. We use two methods to convert the observed H i surface density into H i volume density.
| # of region | Size, pc | , Myr | , cm-3 | Age, Myr | E/Age, | |||
| SW (YS) | HST | FPI | FPI | [1] | [2] | FPI | SW (YS) | SW (YS) |
| (1) | (2) | (3) | (4) | (5) | (6) | (7) | (8) | (9) |
| 1 (C2) | 8.5 (17) | 1.5 (29) | ||||||
| 2 (C3) | 3.5 (17) | 0.8 (16) | ||||||
| 3 | 4.0 | 0.24 | ||||||
| 4 (C4) | 27 | 2.4 | 4.2 (7) | 0.9 (4.7) | ||||
| 5 | 3.5 | 0.22 | ||||||
| 6 (C1) | 30 | 4.0 | 4.1 (7) | 2.4 (27) | ||||
| 7 | 210 | 65 | 1.0 | 4.2 | 0.11 | |||
| 8 | 260 | 45 | 1.7 | 4.5 | 0.23 | |||
| 9 | 90 | 3.4 | 0.04 | |||||
| 10 | 65 | 3.4 | 0.03 | |||||
| 11 SNR | see text | 4.3 | 0.32 | |||||
| 12 | 40 | 4.1 | 0.07 | |||||
-
•
SW – data derived by Stewart & Walter (2000);
-
•
YS – results obtained by Yukita & Swartz (2012) for complexes C1, C2, C3 and C4 (in parentheses);
-
•
HST – estimated based on the HST/ACS F658N image;
-
•
FPI – obtained from our FPI observations in the H line;
-
•
* the typical uncertainty of is ;
-
•
** estimates based on the H i data;
- •
The first method consists of the use of the relation between the column density and the volume density :
| (3) |
where we adopt the scale height of the H i disc of the galaxy pc (Walter & Brinks, 1999). The inclination of the galactic disc increases the scale height along the line of sight as . We adopted from Oh et al. (2008). Note that this method may underestimate the density, because the line-of-sight H i distribution is non-uniform and can be dominated by the contribution of small dense clouds.
The second method is a modification of the one suggested by Walter & Brinks (1999). These authors define areas with an effective radius around each of the H ii regions and assume that H i emission comes mostly from the volume of the sphere of radius . We believe it to be more correct to compute the volume where the H i emission emerges as the area of the cloud in the SGS wall multiplied by the wall thickness. We assume a uniform gas distribution and that the size of the gas layer in the wall is the same along the line of sight and in the sky plane. We found this size to be equal to 360 pc based on an analysis of several H i clouds in the southern and western parts of the SGS. Unlike the first method, this one may overestimate the volume density , because it does not take into account the fact that H i emission is integrated along the line of sight outside the volume considered.
The volume density estimates obtained for all the H ii regions studied are listed in Table 2. The densities obtained using the first and second methods are marked by [1] and [2] in columns (5) and (6), respectively. The densities obtained by Walter & Brinks (1999) are given in parentheses.
The other columns of Table 2 give: (1) the number of the complex according to Stewart & Walter (2000) (shown in Fig. 7) and Yukita & Swartz (2012) (in parentheses); (2) the size estimated from the HST/ACS F658N image; (3) obtained from our ionized gas kinematics analysis; (4) the kinematic age calculated from equation (2); (7) the kinetic energy input rate required to drive the formation of the complex computed from its size and expansion velocity; (8) the age of the complex reported by Stewart & Walter (2000) and Yukita & Swartz (2012) (in parentheses); (9) the kinetic energy input rate provided by the stellar population of the complex according to the estimates of Stewart & Walter (2000) and Yukita & Swartz (2012) (in parentheses).
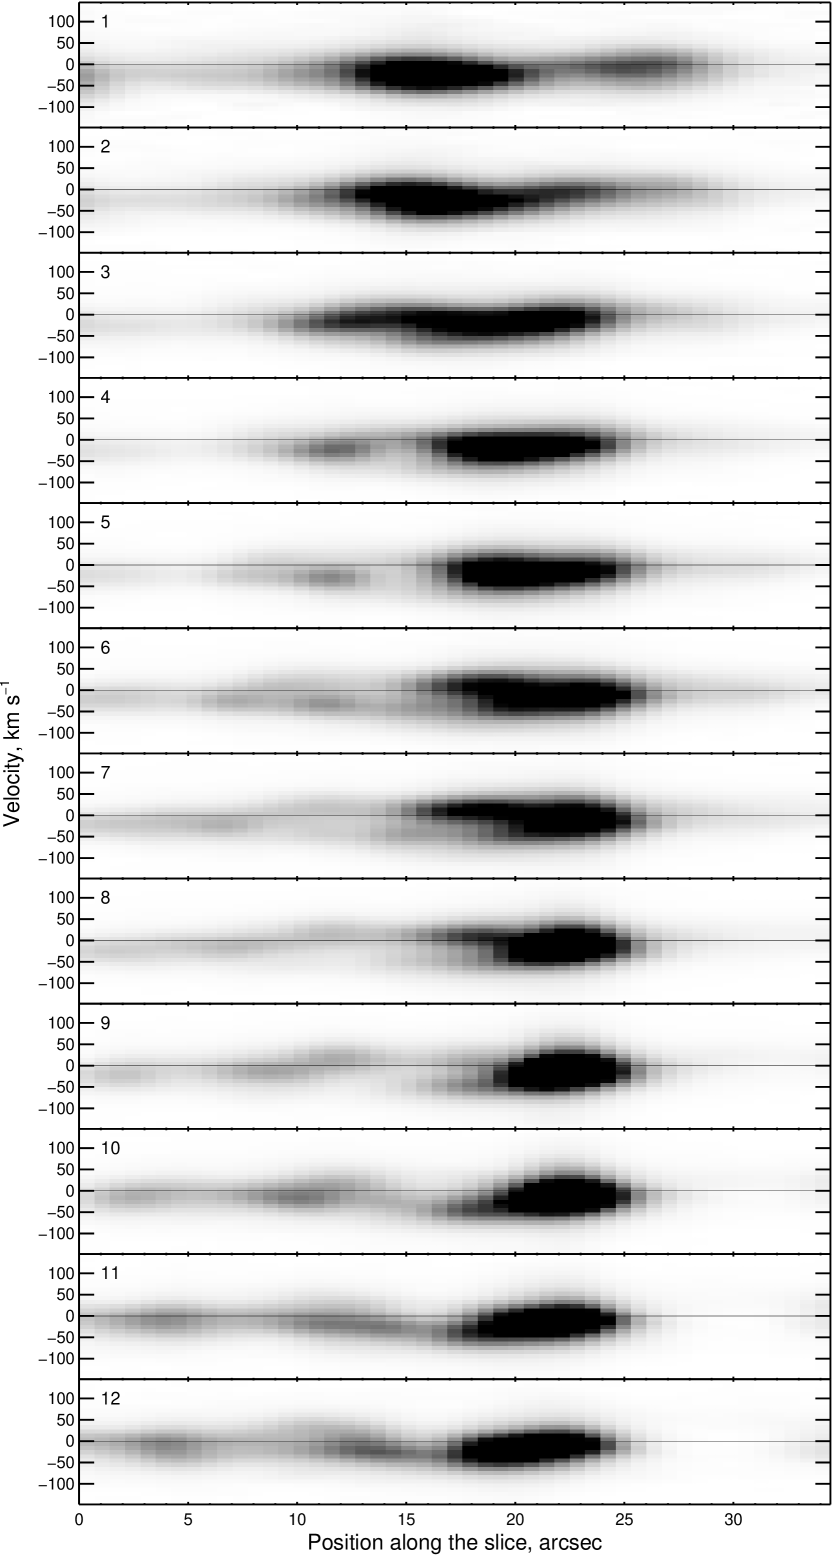
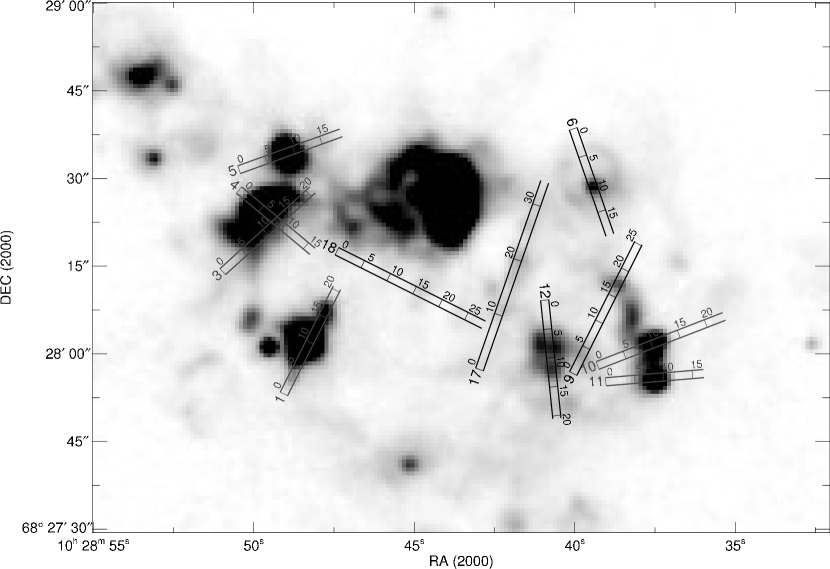
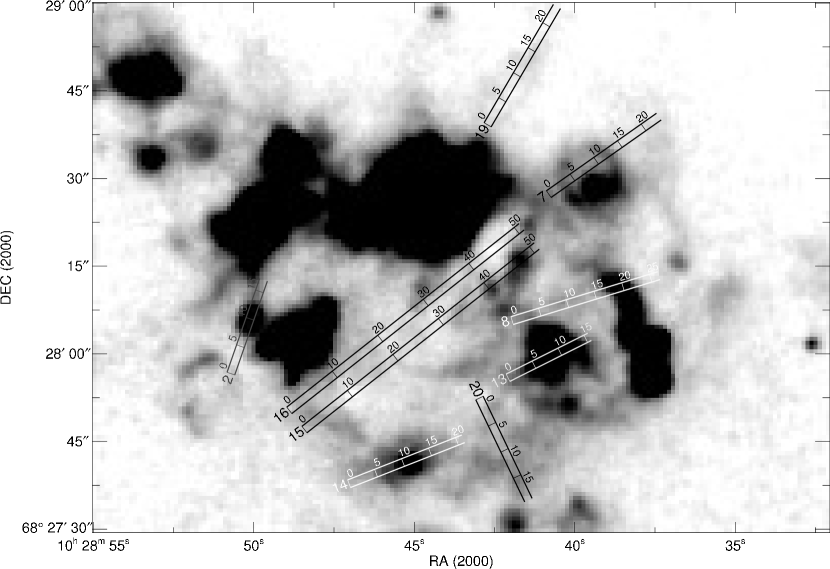
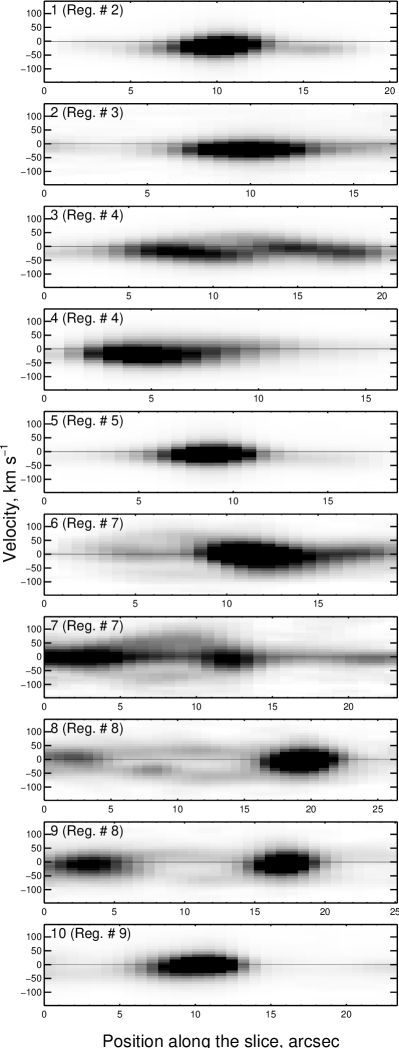
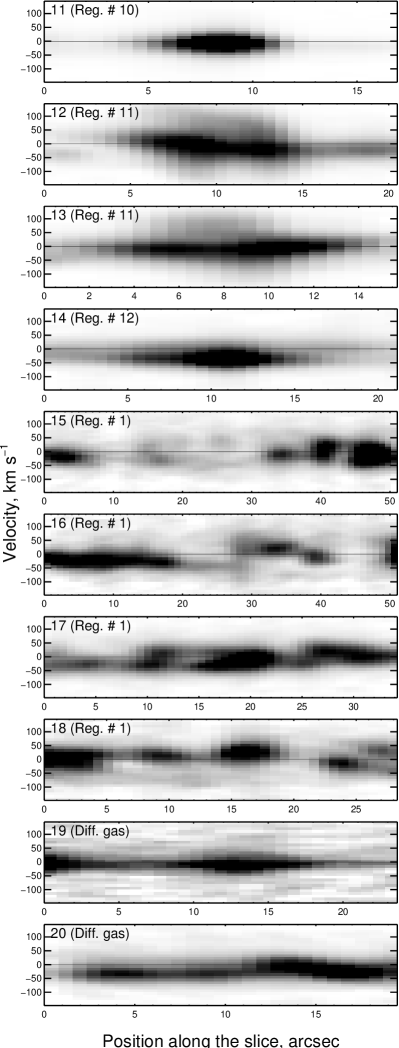
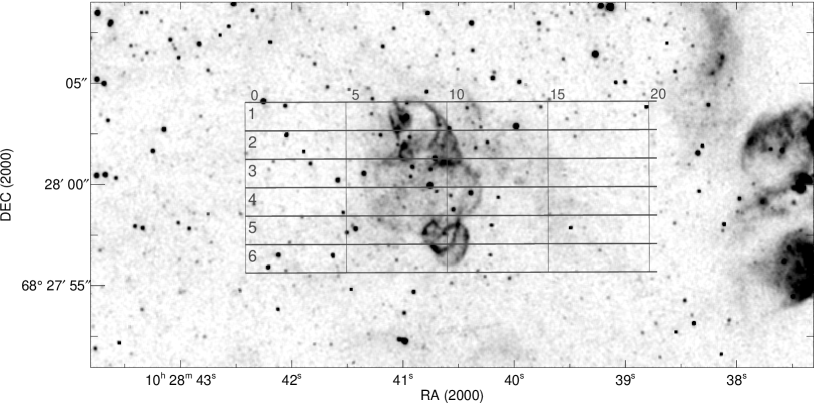
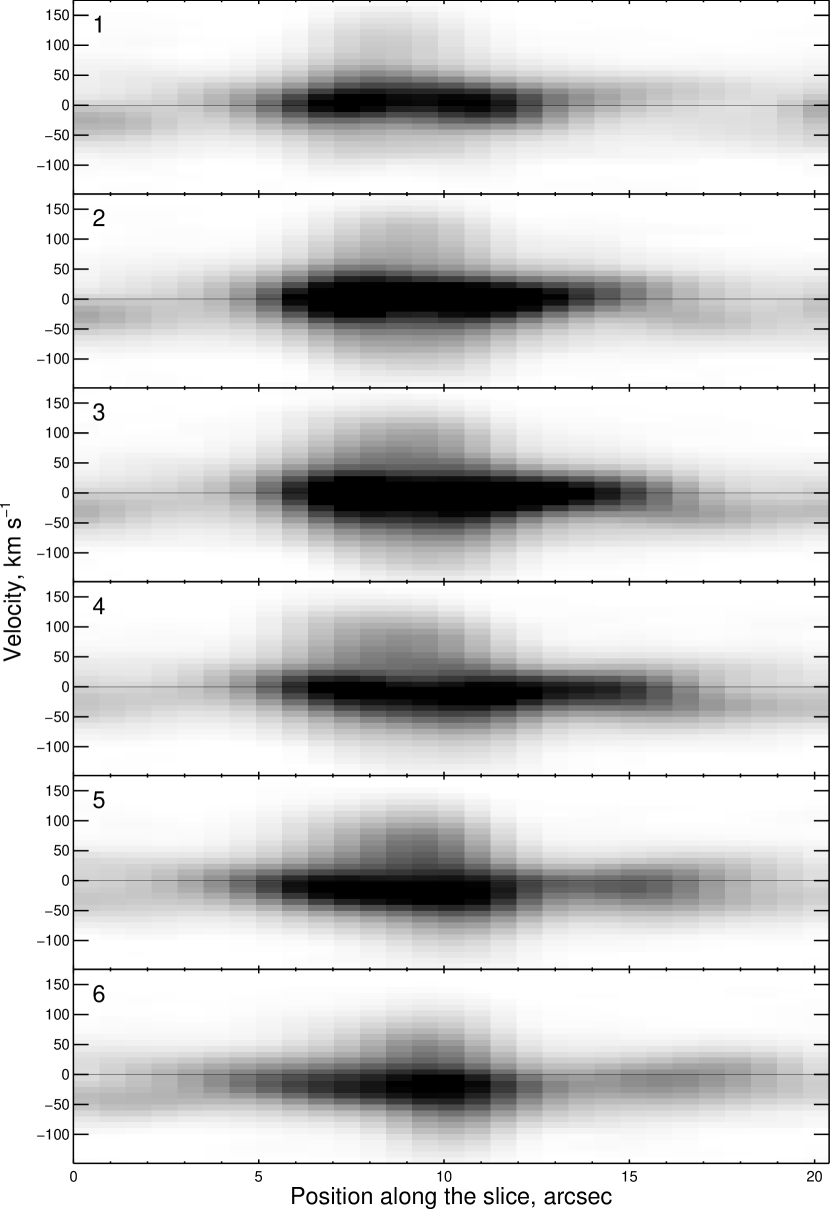
To reveal the effect of the expansion of H ii complexes using the data of FPI observations in the H line we covered each of the H ii regions in the SGS walls by a series of PV diagrams. We use them together with the results of multi-component fitting of H line profiles to estimate , kinematic age , and the required energy input rate . This way we measured the expansion velocities for 4 star formation complexes in the SGS and the upper limits of for the other regions. As an example of our analysis we will discuss in detail the largest Region # 6. Figure 8 shows the H PV diagrams and their location for this region. To avoid overloading the figures, for the other H ii complexes (except for the special case of Region # 11) we marked in Fig. 9 the locations of the most distinctive PV diagrams shown in Fig. 10. Examples of H line profiles from all regions and the results of their Voigt decomposition are shown in Fig. 11.
4.1 H ii complexes with measured expansion velocities
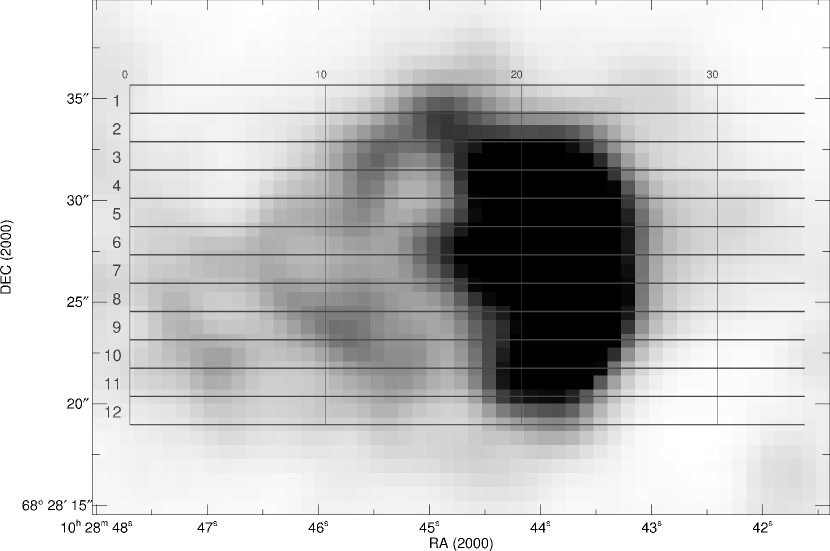
Region # 6 (C1). Star-forming complex # 6 (C1) – an extended ( pc) fine-filamentary H ii region – is located in the northern wall of the SGS. Yukita & Swartz (2012) identified the young star cluster C1 inside Region # 6. The C1 cluster includes PI 13z from the list of Pellerin et al. (2012); cluster PI 07c is located in the eastern part of the region (Fig. 7). Drissen, Roy & Moffat (1993) found three Wolf-Rayet star candidates in Region # 6.
The PV diagrams (Fig. 8) reveal several expanding shell-like structures inside the complex. In the brightest western part of the complex the profile does not resolve into two components, but has a large FWHM of up to compared to in the neighbouring positions. The expansion effect shows up conspicuously east of this bright region in the fainter filamentary part of the complex (see the positions from 7 to 20 arcsec in Fig. 8). The corresponding profiles (6-1, 6-3, 6-5 in Fig. 11) can be fitted confidently by two components. The distance between the components is about , while their FWHM is . These data yield a characteristic expansion velocity of for Region # 6 (C1).
The eastern shell-like structure appeared at arcsec on the PV diagrams in Fig. 8 is probably not a part of Region # 6 but belongs to Region # 4, and the interaction of these two structures produces the faint details in H line profile 6-2 in Fig. 11.
We estimate the ambient gas volume density for Region # 6 to be and using the first and second method, respectively. The corresponding energy input rates are and .
Yukita & Swartz (2012) determined the age Myr and the current mechanical energy produced by the central star cluster C1, ; according to Stewart & Walter (2000), the age of the cluster is 4.1 Myr and the mechanical energy input rate is , see Table 2. As is evident from the above, this energy is definitely sufficient to drive the formation of the shell-like complex given the inferred expansion velocity.
Region # 4. This region has the form of a bright ‘half-shell’ whose eastern part adjoins the dense wall of the SGS (see Fig. 1), with a fainter filamentary inner part. The full size of the region is about pc, and the accepted characteristic radius is pc. The faint filaments in the northwest extend out to the faint eastern filaments of Region # 6. This region hosts the clusters PI 21z, 22z, and 23z (see Fig. 7). In the PV diagrams (Fig. 10) the intensity of the line decreases and its width increases in the direction from the bright edge of the half-shell toward its inner parts. The characteristic velocity of the region is about . Inside the region the line profiles (Fig. 11) reveal a two-component structure with the peak velocities equal to and , respectively, implying an expansion velocity of .
Region # 7. This region has a well-defined structure of a thin ring with a diameter of 210 pc surrounding the cluster PI 01b, with the cluster P3 01d located in the southeastern part of the ring. Inside the ring there is a small ( 40 pc) bright emission region coincident with the cluster.
The PV diagrams and the line profiles show a well-defined three-component structure in the ring nebula. The peak velocities of the components are equal to , 0, and . The FWHM of the shifted components are equal to about and that of the central component is equal to , which corresponds to the halfwidth of the single line observed outside the ring (see profile ‘diff-2’ in Fig. 11). This leads us to conclude that the central component is associated with the emission of the background gas in this region, and the shifted components – with the approaching and receding sides of the expanding shell. The corresponding expansion velocity is . The inferred expansion velocity implies an age of Myr for the ring-shaped H ii region, which is substantially smaller than the ages of other star-forming complexes.
We discuss the possible nature of this unique ring nebula in Section 5.
Region # 8. In the HST/ACS image (Fig. 7) a very faint broad ring can be seen whose western part is Region # 8 itself and the eastern part reaches Region # 11. The curvature of the eastern region indicates that these two parts may be considered as a single ring structure. Region # 8 itself appears as an arc with a chord length and curvature radius of about pc and pc, respectively. Its bright western edge has a single-component line profile (see profile #8-1 in Fig. 11) and the line profile of the inner part has a two-component structure (#8-2 in Fig. 11). The velocity of one component varies little and is equal to about , whereas that of the other component varies from in the east to at the centre, implying an expansion velocity of about at the centre. The halfwidth of all the line components is . In the PV diagrams shown in Fig. 10 Region # 11 borders with Region # 8 in its left part. As is evident from these diagrams, the extended ring expands as a whole. The radius pc and expansion velocity of this ‘combined’ region imply an age of Myr and a required energy input rate of .
4.2 HII-complexes with estimates of the upper limit of the expansion velocity
Region # 2, the brightest nebula in the SGS, is rather non-uniform and consists of a central nebula pc wide, several more compact ( pc) clumps that surround it, and two faint external shells southeast and northwest of the region with the sizes of pc and 35 pc (see Fig. 7). The PV diagrams passing through the central nebula (see PV diagram # 1 in Fig. 10) show no clear signs of expansion. The velocity of the peak of the single-component line profile (Fig. 11) varies slightly over the interval; the FWHM of the line profile corrected for the instrumental contour is . We can estimate only the upper limit for the expansion velocity of the region as half of its FWHM, . Hence the kinematic age of the complex is Myr and given the inferred density of the ambient neutral gas (method 1) and (method 2) the required mechanical energy input rate does not exceed and , respectively.
Region # 3, a faint pc diffuse region, consists of several smaller ( pc) nebulae (see Fig. 7). The PV diagrams and the line profiles show no expansion effect; the line halfwidth and peak velocity are equal to and , respectively.
Region # 5 consists of a relatively bright pc compact core located in the southern part and a fainter, irregularly structured extended region about 70 pc to the north. The region hosts the PI 24z cluster at its centre (see Fig. 7). The PV diagrams (Fig. 10) show no noticeable features; the line profile has a single-component structure with an FWHM of about ; the mean line peak velocity is equal to .
Region # 9 is a lenticular shell with a size of about 90 pc. The line profiles do not resolve into two components and the PV diagram shows no clear signs of expansion. The average velocity of the region is about . The FWHM of the line is and at the centre and periphery of the shell, respectively. The region hosts the clusters PI 25e, 25g, and PII 25h.
Region # 10 has a round shape and a size of about 65 pc. It shows no signs of expansion either in the PV diagrams or in the line profiles; the peak velocity and FWHM of the line are equal to about and , respectively. The region hosts the cluster PI 25c.
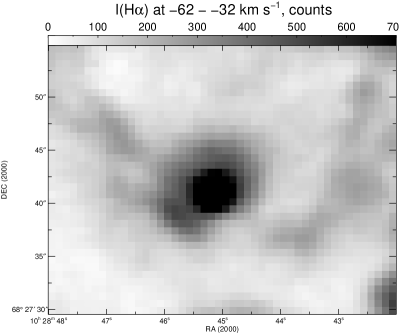
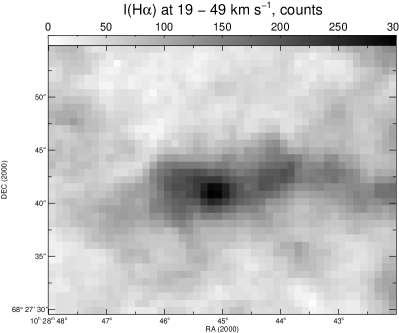
Region # 12 has a compact structure with a size of about 40 pc and a small bright core at its centre. The region hosts the cluster PI 28b. The H profile is asymmetric throughout the entire region (Fig. 11). A bright component is observed at a velocity of about , and a second, weaker component, at . The FWHM of both components is . The shape of this region in the H images at different velocities (Fig. 12) reveals two regions – a bright compact one corresponding to the first profile and a faint extended region responsible for the second profile. Such a complex structure may be due to the fact that the object is located in the non-uniform region at the northeastern boundary of the high-velocity H i cloud mentioned in Section 3. That is why for this region we list only the limiting values of , and in Table 2.
4.3 Region # 11 - an old supernova remnant.
VLA radio observations by Walter et al. (1998) have shown that the three brightest optical star-forming regions in the SGS are the main sources of thermal radio continuum emission (see their fig.1). The fourth source located in the area of shell # 11 is non-thermal and its radio emission is much stronger than one would expect from an H ii region with rather weak H emission. The authors concluded that it is most likely a supernova remnant.
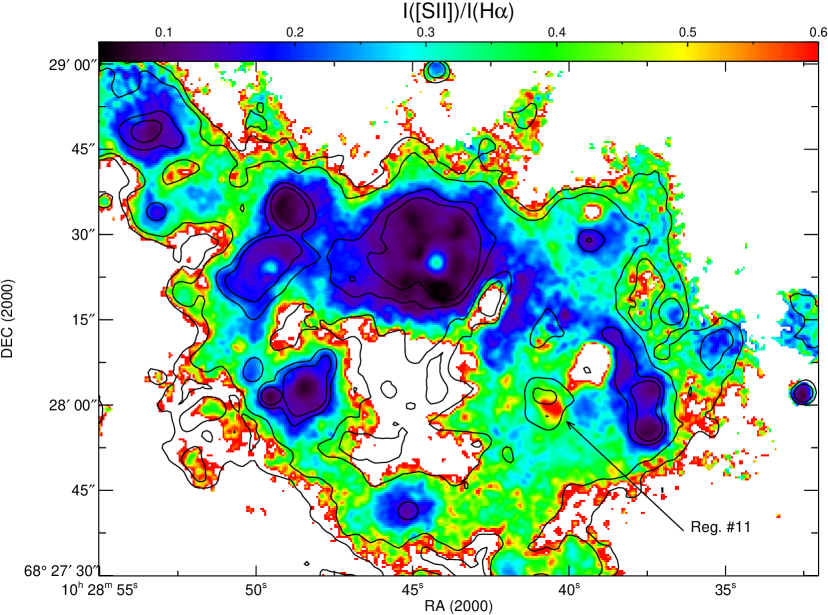
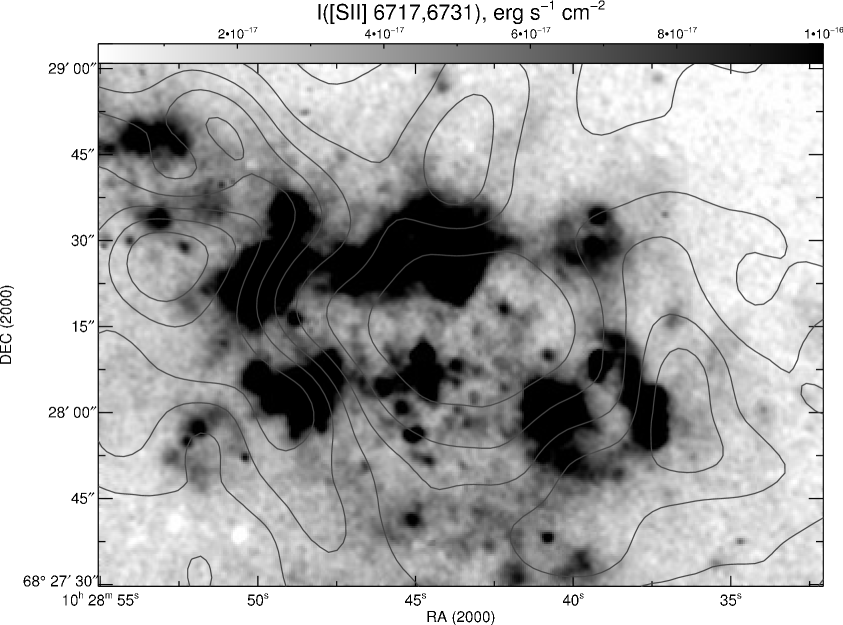
To verify this conclusion, we map the distribution of the I([S ii])/I(H) line intensity ratio based on the SCORPIO narrow band direct images (see Fig. 13). The strong [S ii] 6717, 6731 Å feature in the SNR area (I([S ii])/I(H) ) is typical for cooling gas emission behind a shock front, which confirms the SNR identification (Allen et al., 2008; Millar, White & Filipović, 2012, and references therein).
The HST/ACS image of the region (see Fig. 14) reveals its filamentary central shell ( pc) and two pc ‘lobes’ north and south of it (the full size is pc). The region also hosts the PI 02z cluster (see Fig. 7).
The supernova remnant is characterized by high-velocity motions. The PV diagrams based on our FPI observations (Fig. 14) reveal the presence of high-velocity gas in the SNR; the H line profiles (#11-1, 11-2, 11-3 in Fig. 11) show a well-defined three-component structure of the line profile in the central part of the SNR.
All three components of the line profile are better seen in the northern part, whereas the negative velocity component disappears towards the south. The central component has a velocity of about . The FWHM of the central component is about , and that of the shifted components amounts to . The central component of the line probably corresponds to the background emission of gas in the SNR region.
The peak velocities of the shifted components are about and and yield an expansion velocity of . This high expansion velocity provides further support for the identification of the nebula as an SNR.
The high expansion velocity suggests that the SNR still undergoes adiabatic expansion. According to the self-similar solution of Sedov (1946), the evolution of an SNR at the adiabatic stage can be described by the following equations:
| (4) |
| (5) |
where is the explosion energy.
Given the radius pc and the expansion velocity , we infer the SNR age of yr and . Our estimates of the unperturbed ambient density (method 1) and (method 2) yield an initial explosion energy of erg and erg, respectively.
If the SNR currently undergoes the post-adiabatic snow-plough stage of evolution, we can use the analysis performed by Chevalier (1974). According to this work,
| (6) |
where .
In this case the same SNR radius and expansion velocity yield the ratio of ; the two ambient density estimates yield and erg, respectively.
Thus our analysis of SNR kinematics confirms that Region # 11 can be viewed as an old remnant of a standard SN explosion.
We can speculate that the H morphology of the SNR in IC 2574 considered here (a central shell and two symmetrical ‘lobes’ north and south of it) resembles very much the structure of the well-known Galactic SNR W50 with two symmetric eastern and western ‘lobes’ due to jets emerging from the central SS 433 microquasar (see Goodall, Alouani-Bibi & Blundell, 2011, for a recent analysis).
There is a noticeable asymmetry in the extent of the northern and southern lobes of the SNR in IC 2574: (), which is similar to the asymmetry of the eastern and western lobes of W50 (). According to Goodall et al. (2011), the asymmetry of W50 is due to the exponential density profile of the Milky Way disc. We can similarly explain the asymmetry in the extent of the lobes of the SNR in IC 2574 by the density gradient in the wall of the SGS.
A discovery of an X-ray binary in the SNR could provide evidence for the similar nature of the two objects. Chandra observations of the SGS by Yukita & Swartz (2012) reveal a luminous, (in the keV band), point-like source inside the hole of the SGS, but the separation between the source and the SNR is about 15 arcsec.
To sum up, we can confidently conclude that Region #11 really is an old SNR.
5 Discussion
5.1 The expansion of the H ii shells and their energy budget
We have measured bona fide expansion velocities of four H ii complexes (# 4, 6, 7, and 8) from the splitting of the line profile. We can therefore use the above equations (1, 2) for the supershell produced by supernovae and stellar winds to estimate the kinematic ages and mechanical energy input rates required to drive the formation of each H ii complex. For the remaining H ii regions we estimated only the upper limits for the expansion velocity and the corresponding lower age limit and upper limit.
Stewart & Walter (2000) report the results of FUV and optical observations of the SGS, providing an independent measure of the ages, masses and total mechanical energy deposited by the central stellar association and by the clusters in giant H ii regions on the rim of the SGS based on the FUV, B-band, and H fluxes (see table 2 in their paper).
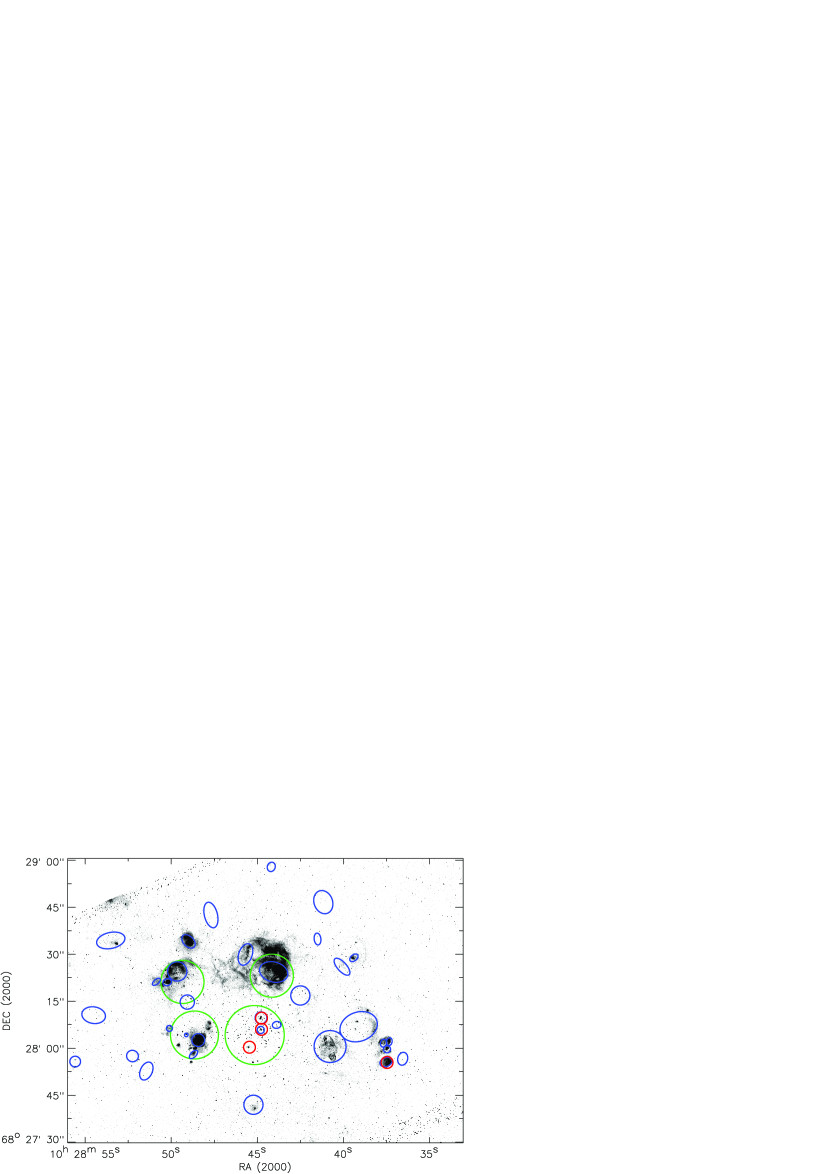
Yukita & Swartz (2012) analysed Chandra X-ray observations of the SGS. The authors performed a multi-wavelength (GALEX and Spitzer) analysis of the stellar population in the SGS area and identified four star forming regions - young star clusters inside and at the edges of the SGS (C1, C2, C3, C4 in their table 1 and fig. 2); C2 coincides with the central star forming region studied by Dalcanton et al. (2012). Their positions are indicated in Fig. 7 by the large green circles. These largest clusters include the small stellar groups from Pellerin et al. (2012), see Fig. 7. The above authors determined the mass, age, and mechanical energy produced by massive stars and supernovae in these four massive star clusters. They estimate the rate of mechanical energy input from the X-ray fluxes in accordance with the best-fitting starburst99 model.
When comparing our study of H ii regions with the analysis of their stellar populations one must bear in mind the uncertainty of our velocity estimates on the one hand and the fact that the reported parameters of star clusters are model dependent on the other hand. The uncertainty of our estimates is due primarily to the non-uniform density of neutral gas in the walls of the SGS and the irregular morphology and kinematics of H ii complexes.
However, Table 2 shows that the mechanical energy input rate for the overwhelming majority of the complexes of triggered star formation associated with the SGS is sufficient to drive the formation of expanding shell-like H ii regions. The only exceptions are regions # 7 and # 8.
The fact that our inferred energy input rate required to drive the formation of Region # 8 significantly exceeds the energy input rate estimated by Stewart & Walter (2000) is quite understandable. We significantly increased the size of this H ii region (and consequently the required energy) by incorporating into it the faint extended arc-shaped nebula that adjoins the SNR from the west, i.e., by combining two faint nebulae into a single shell-like structure.
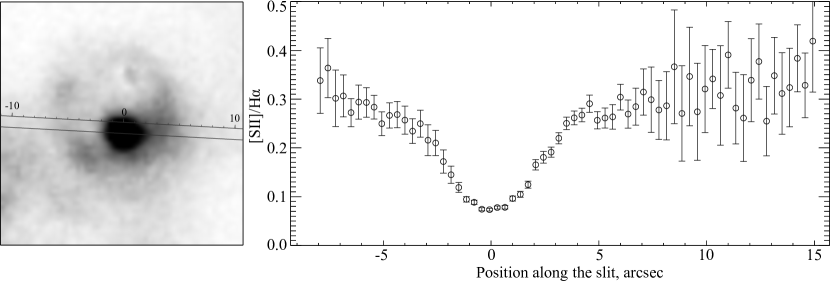
The situation with Region # 7 is very interesting. We estimate and the corresponding Myr (it is the youngest of the complexes discussed here). The high expansion velocity estimated in this study is indicative of a shock effect. To verify this hypothesis, we constructed the distribution of the I([S ii] 6717,6731)/I(H ) line ratio based on the SCORPIO long-slit data (Sect. 2.3). Figure 15 shows the distribution of this ratio along the slit passing through the ring centre.
As is evident from Fig. 15, the ratio I([S ii])/I(H) in the central bright nebula corresponds to the recombination radiation of the H ii region, but at the same time it increases outwards and reaches I([S ii])/I(H) at the edges of the ring nebula, which suggests a possible shock wave effect.
The required kinetic energy input rate of determined above can be provided by winds from several WR or Of stars. Note that the ring nebula is observed not inside the H i cloud, but against a background of tenuous diffuse gas. This suggests that the ambient density of unperturbed gas calculated in both methods is highly overestimated. Given the uncertainty of the estimated in the neighbourhood of Region # 7, even a single star with a strong wind would be enough. The search for WR stars conducted by Drissen et al. (1993) produced no possible candidates in this region. We nevertheless consider it very interesting to perform a detailed analysis of the stellar content of the PI 01b cluster at the centre of the ring nebula.
We cannot rule out the possibility that the large ring in Region # 7 may be an old SNR. At least, with the ambient density of the ring nebula fits well the empirical evolutionary sequence of SNRs on the versus plot suggested by Lozinskaya (1980a, b). The expected radio surface brightness of an SNR 210 pc in diameter is about (see the relation in Lozinskaya 1981; Berezhko & Volk 2004; Asvarov 2006). This surface brightness is less than the limiting brightness at cm in the observations by Walter et al. (1998), which were the basis for the identification of the SNR in Region # 11.
Therefore, the nature of the youngest star-forming complex in the SGS remains an open issue.
5.2 Diffuse ionized medium inside and around the SGS
Deep ground-based images allowed us to identify a faint diffuse component of ionized gas in the SGS region, which does not show in the HST/ACS images.
Inside the SGS in the central Region # 1 and also outside the SGS we observed H line emission with an average brightness level of and [S ii] line emission with an average brightness level of .
As is evident from Fig. 13, the I([S ii])/I(H) intensity ratio is enhanced both in the border regions outside the SGS and in the outer layers of Region # 1 inside the SGS.
To analyse the kinematics of this faint diffuse emission, we constructed the H line PV diagrams for several regions outside the H ii complexes and several PV diagrams at the centre of Region # 1 (Fig. 10, plots 15 – 20).
As is evident from Fig. 11 (diff-2), the H line of the faint diffuse emission in the outer SGS regions has a single-component profile with an FWHM and peak velocity of and , respectively. These are typical parameters for the SGS region. However, there are several faint regions observed with kinematic evidence of local perturbations or a presence of an expanding shell (see, e.g., profile diff-1 in Fig. 11).
The line profile of the central Region # 1 shows a well-defined two-component structure corresponding to the expansion of very faint diffuse structures at a velocity of . The kinematic age of the central cluster in Region # 1, which is responsible for the formation of the SGS, is equal to 14 Myr (Walter et al., 1998; Walter & Brinks, 1999). Therefore the bright H ii nebula is not observed at this location (H arises from the recombination of gas ionized by the radiation of massive stars and is observed over their typical lifetimes Myr). However, one can still see the effect of shocks from stellar winds and SN explosions originating from the central stellar complex in Region # 1. Yukita & Swartz (2012) revealed a bright point-like source CXOU J102843.0+682816 in the SGS in the keV band and detected an excess of diffuse low surface brightness X-ray emission within and around the H i hole after removing the point source from the image (see their fig. 1). According to Sharma et al. (2014), superbubbles can retain a large fraction (up to for ) of the initial energy obtained from SN explosions as bubble thermal energy and kinetic energy of the shell. This reserve of mechanical energy powers the observed diffuse X-ray emission of the hot gas that fills the central hole, drives the expansion of the neutral SGS at a velocity of , and may also be responsible for the observed expansion of the faint ionized gas structures inside the SGS at a velocity of .
The observed parameters of local diffuse gas in the SGS region are similar to those of the extra-planar diffuse ionized medium (DIG) in spiral and Irr galaxies. The observed I([S ii])/I(H) and I([N ii])/I(H) line ratios in the DIG are higher than those in the classical H ii regions. The ionization of DIG is traditionally explained by the leakage of ionizing photons from the H ii regions (see, e.g., Seon, 2009; Hidalgo-Gámez, 2006, and references therein). To explain the increase of I([N ii])/I(H), I([S ii])/I(H) and I([O iii]5007)/I(H) with galactic height, additional sources of ionization were considered: ionization by shocks or turbulent mixing layers may be responsible for some of the DIG emission. Note that the photoionization simulations of a multi-component interstellar medium by Wood & Mathis (2004) do not require as much additional heating as the previous studies.
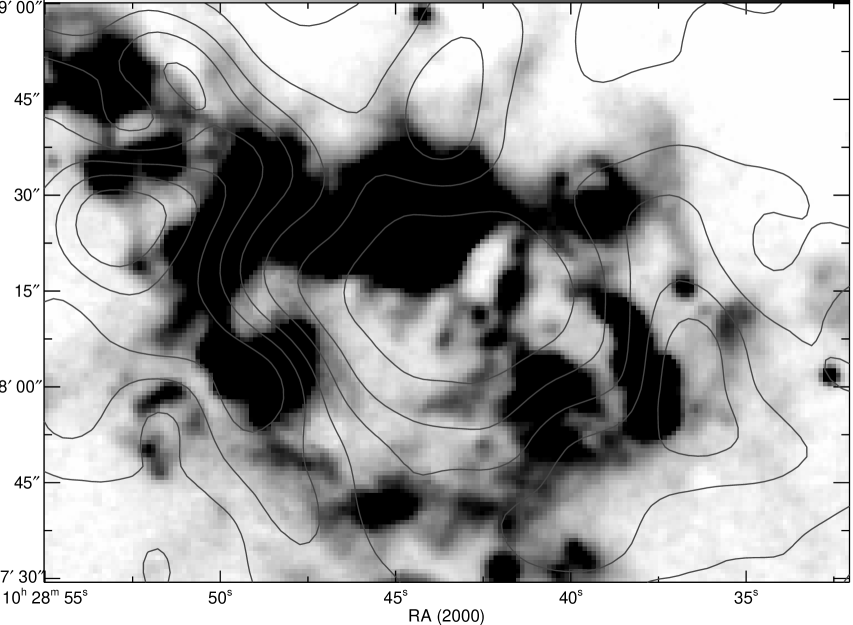
We can similarly explain the faint diffuse ionized gas emission observed in the SGS as a result of leakage from the bright H ii regions of both the ionizing photons and mechanical energy of stellar winds and supernovae. All the H ii complexes studied here indeed have a non-uniform, clumpy, or filamentary structure, which allows the radiation and shocks to leak outside through low-density regions. In a number of cases the results of such a leakage are actually observed. One striking example are the ‘horns’: two faint emission structures observed beyond the northern boundary of Region # 6 around a dense H i cloud (see Fig. 16). These structures are observed both in the H and [S ii] lines.
5.3 The subsequent evolution of the HI structure
The SGS in IC 2574 is one of the most dynamically active H i structures among Irr galaxies, because we observe it during a period of violent star formation in its walls triggered by the expansion of the SGS. What future awaits this structure?
The most dynamically active shell-like H ii complexes exhibiting the expansion effect are regions # 4, 6 and 7, which are located in the northern wall of the SGS. The expansion of Region # 6 rapidly disperses the local H i gas in the northern wall of the SGS. This is, in particular, clearly demonstrated by the emission features mentioned above – the ‘horns’ located beyond the northern boundary of Region # 6 (see Fig 16).
The destruction of the northern wall of the H i supergiant shell due to H ii complexes will result in the growth of the SGS and, ultimately, in its merging with the neighbouring H i structures. One must primarily expect the SGS to merge with the supergiant H i shells # 31 in the west and # 37 in the north (see figs. 9 and 14 in Walter & Brinks, 1999). As a result, after several billion years there will be a system of giant adjoining and/or interacting shell-like H i structures similar to those observed in the Irr galaxy Holmberg II (see Walter et al., 1998).
6 Conclusions
-
1.
To study the kinematics of ionized gas in the regions of triggered star formation in the walls of the SGS, we performed observations with the SAO RAS 6-m telescope using SCORPIO and SCORPIO-2 multi-mode focal reducers operated in the scanning Fabry–Perot interferometer, long-slit and direct imaging modes.
-
2.
Using the THINGS survey data to analyse the kinematics of neutral gas, we ‘derotated’ both (21 cm and H) data cubes with a circular rotation model of IC 2574 constructed by fitting the H i velocity field.
-
3.
The consideration of global H i kinematics confirms the SGS expansion velocity obtained earlier by Walter & Brinks (1999). A more detailed analysis of the H i kinematics revealed the non-uniform structure and kinematics of the SGS; it is shown to be located at the far side of the galactic disc plane.
-
4.
We perform a detailed analysis of the kinematics of all extended H ii complexes in the SGS. We estimated the expansion velocities for four regions, which allowed us to determine their kinematic ages and the kinetic energy input rate required to drive their formation. For the remaining H complexes we estimated the upper limit of the expansion velocity and the corresponding limiting age and kinetic energy input. A comparison with the age and energy input from the stellar population of the complexes based on the data of Stewart & Walter (2000) and Yukita & Swartz (2012) shows that the energy input is sufficient in all complexes except for Region # 7.
-
5.
We discuss in detail the nature of Region # 7, which is a regular faint thin ring with a bright inner region in its southern part. The obtained expansion velocity of shows that Region # 7 is the youngest H complex in the SGS ( Myr). The high expansion velocity is indicative of a shock. The significant role of shock waves in the gas ionization process is evident from the analysis of the I([S ii])/I(H) line ratio.
-
6.
Region # 11 was considered as a possible SNR based on radio observations (Walter et al., 1998). We measured its expansion velosity and estimate the age of the SNR and the initial SN explosion energy under two assumptions: the adiabatic stage or intense radiative cooling. In both cases the results confirm that Region # 11 is an old remnant of a standard SN. Therefore the inferred high expansion velocity and the high relative [S ii] line intensities provide further evidence that Region # 11 is indeed an SNR.
-
7.
Our observations reveal a faint diffuse component of ionized gas in the SGS area, which did not show up previously in HST/ACS images. In the central Region # 1, as well as outside the SGS, we observe H and [S ii] line emission with an average surface brightness of and , respectively. The I([S ii])/I(H) intensity ratio is higher both in the border regions outside the SGS and in the outer layers of Region # 1. The observed parameters of local diffuse gas in the SGS region are similar to those of extra-planar diffuse ionized medium in Sp and Irr galaxies. An analysis of the kinematics of this faint diffuse emission shows a single-component line profile in the outer regions of the SGS, but reveals some structures that show perturbed kinematics with a multi-component H line profile. The central Region # 1 shows well-defined two-component line profiles corresponding to the expansion of faint diffuse inner structures with a velocity of . This expansion velocity and the soft X-ray diffuse emission within the H i hole (and extending slightly beyond it) are extant traces of the initial effect of shock waves from stellar winds and SN explosions in the central stellar complex of Region # 1.
-
8.
Based on the results of the SGS gas kinematics analysis we made speculative conclusions about the future of this structure: it will probably merge with the neighbouring supershells. The vicinity of the SGS will possibly look like the interstellar medium in Holmberg II – a typical example of an object with multiple interacting supergiant shells with triggered star formation at their rims.
ACKNOWLEDGEMENTS
We thank the anonymous referee for valuable comments which have improved the clarity of this paper.
This work was supported by the Russian Foundation for Basic Research (project nos 12-02-31356 and 14-02-00027) and partly supported by the ‘Active Processes in Galactic and Extragalactic Objects’ basic research program of the Department of Physical Sciences of RAS OFN-17. A.V. Moiseev acknowledges the support from the ‘Dynasty’ Foundation. We also thank Victor Afanasiev and Alexander Burenkov who performed the imaging and long-slit observations at the 6-m telescope, and Fabian Walter for providing us with the H i data cube of IC 2574 and the corrected version of their age estimates of H ii complexes.
This work is based on observations obtained with the 6-m telescope of the Special Astrophysical Observatory of the Russian Academy of Sciences. The observations were carried out with the financial support of the Ministry of Education and Science of the Russian Federation (contract nos 16.518.11.7073 and 14.518.11.7070). We used observations made with the NASA/ESA Hubble Space Telescope and obtained from the Hubble Legacy Archive, which is a collaboration between the Space Telescope Science Institute (STScI/NASA), the Space Telescope European Coordinating Facility (ST-ECF/ESA) and the Canadian Astronomy Data Centre (CADC/NRC/CSA). This work has made use of THINGS, ‘The H i Nearby Galaxy Survey’.
References
- Afanasiev & Moiseev (2005) Afanasiev V.L., Moiseev, A.V., 2005, Astron. Letters, 31, 194
- Afanasiev & Moiseev (2011) Afanasiev V.L., Moiseev A.V., 2011, Baltic Astronomy, 20, 363
- Allen et al. (2008) Allen M.G., Groves B.A., Dopita M.A., Sutherland R.S., Kewley L.J., 2008, ApJS, 178, 20
- Asvarov (2006) Asvarov A.I., 2006, A&A, 459, 519
- Bagetakos et al. (2011) Bagetakos I., Brinks E., Walter F., de Blok W.J.G., Usero A., Leroy A.K., Rich J.W., Kennicutt R.C., 2011, AJ, 141, 2011
- Berezhko & Volk (2004) Berezhko E.G., Volk H.J., 2004, AJ, 427, 525
- Bureau & Carignan (2002) Bureau M., Carignan C., 2002, AJ, 123, 1316
- Cannon et al. (2005) Cannon J. M. et al. 2005, ApJ, 630, L37
- Cannon et al. (2011a) Cannon J. M. et al. 2011a, ApJ, 735, 35C
- Cannon et al. (2011b) Cannon J. M. et al. 2011b, ApJ, 735, 36C
- Chevalier (1974) Chevalier R.A., 1974, ApJ, 188, 501
- Cook et al. (2012) Cook D.O. et al., 2012, ApJ, 781, 100
- Dalcanton et al. (2012) Dalcanton J.J. et al., 2012 ApJS, 198, 6
- Dib & Burkert (2005) Dib S., Burkert A. 2005, ApJ, 630, 238
- Drissen et al. (1993) Drissen L., Roy J.-R., Moffat A.F.J., 1993, AJ, 106, 1460
- Elmegreen (1997) Elmegreen B. G. 1997, ApJ, 477, 196
- Elmegreen & Chiang (1982) Elmegreen B. G., Chiang, W.-H., 1982, ApJ, 253, 666
- Goodall et al. (2011) Goodall P. T., Alouani-Bibi F., Blundell K. M., 2011, MNRAS, 414, 2838
- Hidalgo-Gámez (2006) Hidalgo-Gámez A.M., 2006, AJ, 131, 2078
- Karachentsev et al. (2013) Karachentsev I.D., Makarov D.I., Kaisina E.I., 2013, AJ, 145, 101
- Lozinskaya (1980a) Lozinskaya T.A., 1980a, A&A, 84, 26.
- Lozinskaya (1980b) Lozinskaya T.A., 1980b, Astron.Zh., 57, 707
- Lozinskaya (1981) Lozinskaya T.A., 1981, Astron.Letters, 7, 29
- Mac Low & McCray (1988) Mac Low M., McCray R., 1988, ApJ, 324, 776
- McCray & Kafatos (1987) McCray R., Kafatos M., 1987, ApJ, 317, 190
- McQuinn et al. (2009) McQuinn K.B.W., Skillman E.D., Cannon J.M., Dalcanton J. J., Dolphin A., Stark D., Weisz D., 2009, ApJ, 695, 561
- McQuinn et al. (2010a) McQuinn K.B.W. et al., 2010a, ApJ, 721, 297
- McQuinn et al. (2010b) McQuinn K.B.W. et al., 2010b, ApJ, 724, 49
- Millar et al. (2012) Millar W.C., White G.L., Filipović M.D., 2012, SerAJ, 184, 19
- Moiseev (2002) Moiseev A.V., 2002, Bull. Spec. Astrophys. Obs., 54, 74
- Moiseev & Egorov (2008) Moiseev A.V., Egorov O.V., 2008, Astrophysical Bulletin, 63, 181
- Moiseev (2014) Moiseev A.V., 2014, Astrophysical Bulletin, 69, 1
- Oh et al. (2008) Oh S.-H., de Blok W. J. G., Walter F., Brinks E., Kennicutt R. C. J., 2008, AJ, 136, 2761
- Ott et al. (2001) Ott J., Walter F., Brinks E., Van Dyk S. D., Dirsch B., Klein U., 2001, AJ, 122, 3070
- Pasquali et al. (2008) Pasquali A. et al. 2008, ApJ, 687, 1004
- Pellerin et al. (2012) Pellerin A., Meyer M.M., Calzetti D., Harris J., 2012, AJ, 144, 182
- Rhode et al. (1999) Rhode K. L., Salzer J. J., Westpfahl D., Radice L. A. 1999, AJ, 118, 323
- Rich et al. (2008) Rich J. W., de Block W. J. G., Cornwell T. J., Brinks E., Walter F., Bagetakos I., Kennicutt R. C. Jr., 2008, AJ, 136, 2897
- Sedov (1946) Sedov L.I., 1946, Dokl. Akad. Nauk SSSR, 52, 17
- Seon (2009) Seon K., 2009, ApJ, 703, 1159
- Sharma et al. (2014) Sharma P., Roy A., Nath B.B., Shchekinov Yu., 2014, preprint (arXiv:1402.6695)
- Silich et al. (2006) Silich S., Lozinskaya T., Moiseev A., Podorvanyuk N., Rosado M., Borissova J., Valdez-Gutiérrez M. 2006, A&A, 448, 123
- Simpson at al. (2005) Simpson C.E., Hunter D.A., Knezek P.M., 2005, AJ, 129, 160
- Stewart & Walter (2000) Stewart S. G., Walter F., 2000, AJ, 120, 1794
- Tenorio-Tagle (1981) Tenorio-Tagle G., 1981, A&A, 94, 338
- Tenorio-Tagle & Bodenheimer (1988) Tenorio-Tagle G., Bodenheimer P. 1988, ARA&A, 26, 145
- Tomita et al. (1998) Tomita A., Ohta K., Nakanishi K., Takeuchi T.T., Saito M., 1998, AJ, 116, 131
- Kim et al. (1999) Kim S., Dopita M. A., Stavelet-Smith L., Bessel M., 1999, A&A, 350, 230
- Vorobyov & Shchekinov (2004) Vorobyov E. I., Shchekinov Y. A. 2004, A&A, 416, 499
- Wada et al. (2000) Wada K., Spaans M., Kim S., 2000, ApJ, 540, 797
- Walter & Brinks (1999) Walter F., Brinks E., 1999, AJ, 118, 273
- Walter et al. (1998) Walter F., Kerp J., Duric N., Brinks E., Klein U., 1998, ApJ, 502, L143
- Walter et al. (2008) Walter F., Brinks E., de Blok W. J. G., Bigiel F., Kennicutt R. C. Jr, Thornley M.D., Leroy A., 2008, AJ, 136, 2563
- Warren et al. (2011) Warren S.R. et al. 2011, ApJ, 738, 10
- Weaver et al. (1977) Weaver R., McCray R., Castor J., Shapiro P., Moore R., 1977, ApJ, 218, 377
- Weisz et al. (2008) Weisz D. R., Skillman E. D., Cannon J. M., Dolphin A. E., Kennicutt R. C., Lee J., Walter F., 2008, ApJ, 689, 160
- Weisz et al. (2009a) Weisz D. R., Skillman E. D., Cannon J. M., Dolphin A. E., Kennicutt R. C., Lee J., Walter F. 2009a, ApJ, 704, 1538
- Weisz et al. (2009b) Weisz D.R., Skillman E.D., Cannon J.M., Walter F., Brinks E., Ott J., Dolphin A.E., 2009b, ApJ, 691, L59
- Wood & Mathis (2004) Wood K., Mathis J.S., 2004, MNRAS, 353, 1126
- Young & Lo (1997) Young L. M., Lo K. Y. 1997, ApJ, 490, 710
- Yukita & Swartz (2012) Yukita M., Swartz D.A., 2012, ApJ, 750, L16
Appendix A Channel map from FPI H data cube
In this appendix we present a channel map of the ‘derotated’ H data cube of the SGS in IC 2574. During the observations we obtained a 40-channel data cube. We present in Fig. 17 the image of 32 channel map with noticeable H intensity.