Further author information: (Send correspondence to Giuliana Fiorentino)
Giuliana Fiorentino: E-mail: giuliana.fiorentino@oabo.inaf.it, Telephone: +39 051 209 53 18
On the use of asymmetric PSF on NIR images of crowded stellar fields
Abstract
We present data collected using the camera PISCES coupled with the Firt Light Adaptive Optics (FLAO) mounted at the Large Binocular Telescope (LBT). The images were collected for two different pointings by using two natural guide stars with an apparent magnitude of R 13 mag. During these observations the seeing was on average 0.9 arcsec. The AO performed very well, in fact the images display a mean FWHM of 0.05 arcsec and of 0.06 arcsec in the J– and in the Ks–band, respectively. The Strehl ratio on the quoted images reaches 13–30% (J) and 50–65% (Ks), in the off and in the central pointings respectively. On the basis of this sample we have reached a J–band limiting magnitude of 22.5 mag and the deepest Ks–band limiting magnitude ever obtained in a crowded stellar field: Ks 23 mag.
J–band images display a complex change in the shape of the PSF when moving at larger radial distances from the natural guide star. In particular, the stellar images become more elongated in approaching the corners of the J-band images whereas the Ks–band images are more uniform. We discuss in detail the strategy used to perform accurate and deep photometry in these very challenging images. In particular we will focus our attention on the use of an updated version of ROMAFOT based on asymmetric and analytical Point Spread Functions.
The quality of the photometry allowed us to properly identify a feature that clearly shows up in NIR bands: the main sequence knee (MSK). The MSK is independent of the evolutionary age, therefore the difference in magnitude with the canonical clock to constrain the cluster age, the main sequence turn off (MSTO), provides an estimate of the absolute age of the cluster. The key advantage of this new approach is that the error decreases by a factor of two when compared with the classical one. Combining ground–based Ks with space F606W photometry, we estimate the absolute age of M15 to be 13.70 0.80 Gyr.
keywords:
AO systems, globular clusters, data reduction1 INTRODUCTION
One of the main unsolved question in astronomy is how galaxies form and evolve. Resolved Stellar Population (RSP) are one of the most powerful diagnostic to provide solid constraints on the early formation and evolution of the Milky Way (MW). In this context Galactic Globular clusters (GGCs) play a crucial role, since they are the oldest ( 12Gyr) stellar systems to probe the early formation of both the Halo and the Bulge. This means that GGCs are fundamental laboratories to constrain the evolutionary properties of low–mass stars, but also for several open problems in modern Astrophysics. One of the key advantages in using GCs as tracers of the old stellar populations is that they are ubiquitous in early and late galaxies and in massive dwarf galaxies[1].
Absolute and relative ages of GCs together with their proper motions (PMs), galactocentric distances and radial velocities are required to properly understand the MW formation[2, 3]. The GC absolute ages also provide a lower limit on the epoch of pristine galaxy formation, and therefore, on the age of the Universe. The measurements of the above diagnostics do require: i) high–quality multi–band images to perform accurate and precise photometry in crowded stellar fields; ii) high–resolution spectra collected with multi-object spectrographs to estimate heavy element (iron, , CNO) abundances. The photometry allows us to construct Color-Magnitude Diagrams (CMDs) and Luminosity Functions (LFs) to evaluate the cluster age and the proper motion. The spectroscopy provides the chemical enrichment history and the kinematics.
During the last twenty years the unprecedented image quality (stable Point Spread Function, PSF) and spatial resolution of the Hubble Space Telescope (HST) have been a quantum jump in the analysis of stellar populations in crowded stellar fields (Galactic Center, Bulge, innermost regions of GCs). The consequence is that HST optical images allow us to build CMDs with accurate and deep photometry at least five magnitudes fainter than the main sequence turn–off (MSTO). The same outcome does not apply to near-infrared (NIR) images collected with HST (e.g., with the IR channel of the WFC3). The diffraction limit of HST in the Ks band is 0.25”, while it is 0.05” in the I-band. This means limited photometric accuracy in crowded stellar fields (center of GCs) and in stellar regions affected either by large and differential reddening (Galactic center, bulge).
Detailed investigations of the quoted targets do require modern NIR detectors at large ground-based telescopes assisted with Adaptive Optic (AO) systems. The AO systems can allow us to alleviate the effects of the Earth’s atmosphere and to reach their diffraction limit (e.g., EPICS[4]). Note that this means Ks–band images with a FWHM of 0.07” in a 8–meter telescope. It goes without saying that ground–based observing facilities approaching the above limit will have a substantial impact on a very broad range of astrophysical problems ranging from extrasolar planets, to stellar populations, to the detection of primeval galaxies.
These are the main reasons why the astronomical community undertook a paramount effort in improving the efficiency and the robustness of AO systems. During the last few years become available different flavors of AO systems: e.g. Ground Layer Adaptive Optics (GLAO) to Single Conjugate Adaptive Optics (SCAO; one deformable mirror) to Multi Conjugate Adaptive Optics (MCAO; several deformable mirrors) and to Multi-Object Adaptive Optics (MOAO). These pioneering AO systems not only demonstrated on sky the feasibility, but also provided data to address several astrophysical problems. Moreover, and even more importantly, they paved the road for the next generation of Extremely Large Telescopes (ELTs[5, 6, 7]).
The key advantage of the MCAO systems is their uniform correction across a quite large field of view (FOV2x2’), while the SCAO systems “only” correct a small FOV of 30x30”. The improvement is impressive as demonstrated on sky by the Multi–conjugate Adaptive optics Demonstrator (MAD) temporarily available at VLT [8] (see Fig. 1 in Marchetti et al. 2008) and more recently by GeMS (Turri et al. 2014, this SPIE conference) available at the Gemini South Telescope. MAD had a limited sky-coverage, since the closure of the loop required an asterism of three stars brighter than V13 mag over two arcmin on the sky. However, MAD was a very successful experiment, since delivered NIR images with a uniform PSF across the corrected FOV and produced several interesting investigations on RSP [9, 10, 11, 12, 13]. The accuracy and precision of the CMDs based on MAD images is similar or even better than CMDs based on images collected with optical and NIR images collected with HST. Disentangling two different stellar populations in the bulge GGC Terzan 5, MAD observations suggested that this cluster is a candidate building block of the Galactic bulge[14]. However, the complex variation of the PSF across the FOV and in time makes the analysis of MCAO data quite challenging.
Equipped with one deformable secondary mirror and a high-order pyramid wave-front sensor, each LBT eye can work with a SCAO system that coupled with the high spatial resolution of PISCES (pixel scale = 0.0193”) can deliver high quality NIR images of crowded stellar fields. When first mounted on one of the LBT’s (early 2010), the adaptive optics system–FLAO[15]–provided the best NIR images ever collected with a ground–based telescope. The new systems succeeded in delivering images with a PSF across the FOV that was more than three times sharper than images collected with HST. Moreover, during the initial testing phase, the LBT’s adaptive optics system was able to achieve and unprecedented Strehl Ratio in the Ks–band: from 60 to 80 percent. This means an improvement of two-third in image sharpness when compared with similar AO systems available at 8-m class telescopes [15].
Current generation of AO systems are a fundamental playground not only for the technological challenges, but also to sharpen our fingernail in analyzing NIR images of crowded stellar fields that will be collected with MCAO systems. This will offer the unique opportunity to revolutionize our approach to Galaxy evolution and to pave the way for future ELTs (diameter30m[5, 6, 7]). It is of critical importance for the full exploitation of ELT facilities that NIR RSP are explored and successfully modeled. AO deep NIR data will provide crucial inputs for the modeling of cool stars, mainly emitting in NIR, for which uncertainties related to the effective temperature evaluation and to the colour-temperature transformations require further investigation[16, 17].
Moreover, recent deep NIR studies indicate a new robust method to estimate the age of GGCs using the signature of collisional induced absorption of molecular hydrogen in low-mass (M0.4 M⊙) MS stars[12] (see Fig. 2 in Bono et al. 2010). This opacity mechanism shows up as a well–defined Knee observable in the faint MS (MSK), and its position is, at fixed chemical composition, independent of the cluster age (Mk5 and Mj-Mk0.7mag). The magnitude difference between the MSK and the MSTO is thus a solid measurement of the absolute age and, by definition, is independent of reddening and distance. When the MSTO is instead anchored to Horizontal Branch stars, their age dependence is a major systematic on the final age estimation. Ground based telescopes equipped with SCAO or MCAO are expected to detect and calibrate the MSK over a broad metallicity range, providing absolute ages with high accuracy ((MSK–MSTO) (MSTO)/2 1Gyr).
In this paper we focus our attention on M15 which belongs to the metal–poor tail of the GGC distribution ([Fe/H -2 dex]). Moreover, M15 appears to be in an advanced dynamical state (post core collapsed), this means that the innermost cluster regions display a well defined sharp peak in luminosity, and in turn in density profile[18]. It has also been suggested that M15 harbors an Intermediate Mass Black Hole[19]. The above feature made M15 a fundamental laboratory to test the accuracy and the precision of the approach adopted to perform photometry in crowded stellar fields (ALLFRAME[20]).
 |
|
2 Photometric data
The NIR images adopted in this investigation were secured in October 2011 with PISCES by using the DX (right) 8.4 m telescope of LBT where the FLAO was originally mounted. This AO system relies on two key components, namely an adaptive secondary mirror with 672 actuators and an innovative high-order pyramid wave-front sensor.
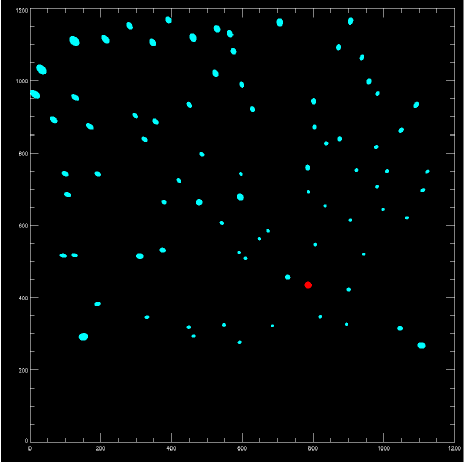
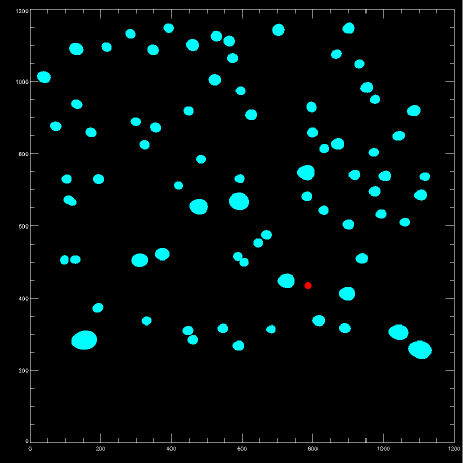
The scientific target was the Galactic Globular M15 (RA21:29:58.33, DEC+12:10:01.2) visible for more than about four hours with an air mass smaller than 1.3. Data were acquired for two different different pointings, the former is centrally located, while the latter is located at 3 arcmin form the center in the South-West direction. Two natural guide stars adopted to close the loop of the AO system are: NGS1, RA= 21:29:58.616, DEC=+12:09:56.34, R=12.6 mag central pointing and NGS2, RA= 21:29:44.6457, DEC=+12:07:30.697, R=12.9 mag off–center pointing. One of the key advantages in observing Galactic Globulars is that NGSs can be easily identified in the innermost cluster regions. Cluster red giant stars are typically brighter than R13 mag up to distances of 10–16 kpc.
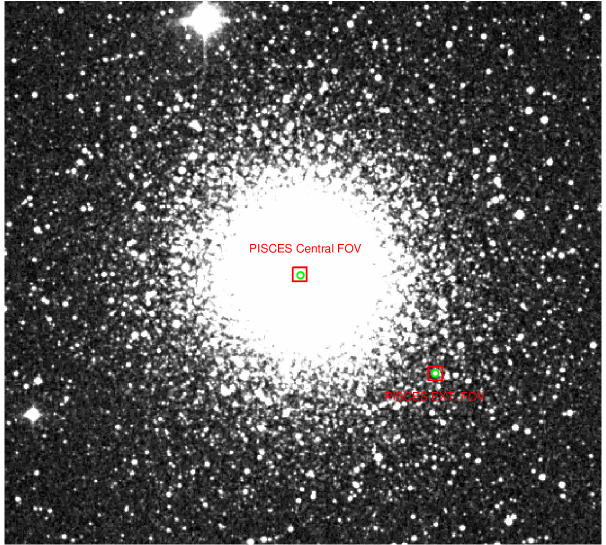
We collected 18 J-band and 20–Ks band images for the central pointing with a total exposure time of 108 and 170 s, while for the off–center pointing we secured 20 J-band and 42 Ks–band images for a total 600 and 630 s (see Table 1). The external DIMM seeing ranges from 0.7 to 1.1 arcsec for the central pointing and from 0.6 to 0.95 arcsec for the off–center pointing. These weather conditions and the selected NGSs allowed us to reach a Strehl ratio up to 65% in Ks and 30% in J in the central pointing and up to 50% in Ks and 13% in J in the off–center pointing. Fig. 1 shows the position of the pointings together with the position of the adopted NGSs.
| INSTRUMENT | PASSBAND | NTEXP |
|---|---|---|
| PISCES-central FOV | J | 92 s |
| PISCES-central FOV | J | 910 s |
| PISCES-central FOV | Ks | 102 s |
| PISCES-central FOV | Ks | 1015 s |
| PISCES-external FOV | J | 2030 s |
| PISCES-external FOV | Ks | 4215 s |
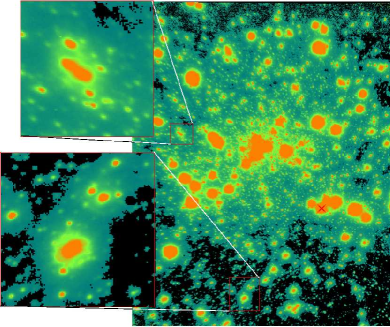
In order to provide a more clear idea concerning the AO performance that can be reached with PISCES, Fig. 2 shows two images collected in the J (left) and in the Ks (right) band for the central pointing. A glance at the shape of the stars plotted in these images clearly shows that the PSF in J-band become more and more elliptical as a function of the distance from the NGS. The FWHM increases from 0.04 arcsec in the very center of the image to about 0.07 arcsec in its outskirt. This effect is more mitigated in the Ks–band, and indeed the shape of the PSF remains almost circular across the entire image (see the zoom on individual stars). The FWHM is on average 0.06 arcsec across the entire image. The above empirical evidence indicates that stars typically cover about 22 and 33 pixels in the J and in the Ks–band, respectively.
In passing we note that for the same cluster space images are also available collected using the F160W–band with WFC3/IR at HST. The images overlap with the off–center pointing, the diffraction limit of HST in this filter is 0.17 arcsec and the pixel scale of the IR channel is 0.13 arcsec per pixel. Fortunately enough, a good set of optical space images of the central regions are also available. They have been collected with ACS/WFC at HST in the F814W (similar to I-band) and in the F606W (similar to a V-band). The diffraction limit in F606W–band is 0.06 arcsec and the pixel scale of the WFC is 0.04 arcsec per pixel. The above evidence indicates that ground-based NIR images are typically oversampled when compared with optical and NIR space images collected with HST.
3 Data reduction
Photometry of crowded stellar fields became a solid opportunity during the late eighties thanks to the development of sophisticated automatic techniques to perform the photometry on digitalized photographic plate images. The use and the role played by these packages became even more crucial in handling hundreds of optical images collected with modern CCDs. The most commonly used packages to perform PSF fitting photometry in crowded stellar fields are DAOPHOT (ALLSTAR/ALLFRAME) [21, 22], ROMAFOT [23, 24], DOPHOT [25], SExtractor[26, 27], Starfinder [28] and software ad hoc developed to deal with HST images [29, 30]. The use of these packages made possible the construction of very deep and precise CMDs based on ground–based and space images that allowed us to investigate in detail RSPs in the very center of GGCs[31] and in the Bulge[32]. Note that the use of the PSF photometry in crowded stellar fields is mandatory not only to improve the precision of the photometry (identification of faint companions), but also to improve the limiting magnitude (identification of faint objects). The latter point is even more crucial in dealing with NIR images, since they are sky limited.
|
|
The use of ground–based NIR images collected with AO systems seems to suggest that a further development of the packages currently available is required. The shorter wavelength images (tipically J–band) display a complex change of the shape of the PSF across the FOV. This evidence further support the suggestion that the performance of a AO system does depend on the Strehl ratio, but also on the image quality and on the temporal stability of the PSF. In the following we discuss in more detail while the latter parameters play a crucial role in the photometry of crowded stellar fields. Note that there is mounting evidence that NIR images collected with MCAO systems (MAD at VLT, [8]) have a more uniform and stable PSF across the FOV. This is the reason why in dealing with these images have been adopted classical approaches[12, 13].
In dealing with NIR images collected with SCAO systems (NACO at VLT, PISCES at LBT) we decided to use ROMAFOT. The key advantage in using ROMAFOT is that we can check the different steps (fit, map of the residuals) of the individual PSF fitting thanks to the graphical interface. The main drawback is that it is lengthy. The key advantages in using analytical PSF fitting of crowded stellar fields when compared with aperture photometry and with numerical PSF[21] have been widely discussed in the literature. We mention that the analytical PSF improves at fixed magnitude the photometric precision thanks to the identification of faint companions and the opportunity to discriminate between stars and galaxies. Moreover, it improves, at fixed exposure time, the limiting magnitude thanks to the identification of faint stellar sources. The latter point is even more crucial in dealing with NIR images, since they are sky limited.
In the following we use a Moffat function that can be expressed as
| (1) |
The parameter fixes the slope of the wings, larger is the value steeper is the slope. We adopted this analytical PSF because it provides a good description of the stellar profiles both in seeing limited and in diffraction limited images. In the ROMAFOT environment the analytical PSF fitting is performed simultaneously with an assumption that accounts for the local sky–background. This means that once the shape of the PSF has been fixed ( and values), by using PSF stars, the number of unknowns for an isolated stellar profile is three (x0, y0, h) plus the term that accounts for the local sky–background. This is the main reason why accurate and precise photometry of crowded stellar fields does require that stars cover at least 22 pixels. To overcome this problem the use of specific analytical[23] and/or numerical[21] PSFs has been suggested. Fortunately, the new CCD images have appropriate pixel scales.
To perform accurate PSF photometry of stellar images with asymmetric profiles have been suggested different approaches. The most simple approach is to split the FOV in a number of smaller subfields and to perform the selection of PSF stars on these individual subfields. A similar approach relies on the selection of a sizable sample of PSF stars across the entire field of view and to assume either a quadratic or a cubic change of the PSF across the image. However, these approaches become quite complicated in dealing with crowded stellar fields, since the number of good isolated PSF stars is limited. The use of specific algorithms overcomes some of the quoted problems and appears quite useful in dealing with images that are on the verge to be undersampled[24]. It has also been suggested to use a “Penny” function i.e. the sum of a Gaussian and of a Lorenz function, in which the latter one can be either tilted or not tilted when compared with the Gaussian function[21].
The quoted approaches present several clear advantages, however, after
different tests and trials on SCAO images we decided to perform the
analytical PSF fitting by using a new asymmetric Moffat function:
PSF(h, x0, y0, a, b, c, , , x, y)=
| (2) |
In spite of the apparently complicated analytical representation, the new analytical function is relatively simple. The main features are the following:
-
•
1) Wings – The paramater of the Moffat function is fixed using PSF stars and does not change across the image.
-
•
2) Ellipse – The core of the Moffat function is no more a circle, but an ellipse characterized by its semi–major (a) and semi–minor (b) axes.
-
•
3) Tilt – The ellipse is not aligned with the X and Y axis, but has an inclination angle––with the X axis.
-
•
4) Asymmetry – The 3D shape of stellar images can be asymmetric thanks to the parameter, i.e. this constrains the departure from an ellipsoidal shaped volume into an egg shaped volume.
The number of unknowns of the new asymmetric Moffat function are eight (plus the sky–background value). The four unknowns affecting the shape of the PSF (a, b, c, ) change across the image and they are fixed by fitting the stellar profile of several, possibly isolated, PSF stars across the frame. We derive for every image, on the basis of the PSF stars, an almost spatially uniform grid of values for the five unknowns. This approach allow us to decrease the number of unknowns, and in turn to speed up the PSF fitting of both isolated and blended stars. The new ROMAFOT according to the position of the star in the grid performs a quadratic interpolation of the four shape parameters across the grid and then performs the fit of individual stellar profile. This means that the unknowns of the new approach are still three (, the height; , , the centroid) plus the sky–background value. The reasons why we devised the above reduction strategy are the following: 1) Current ground-based NIR images collected with AO systems are typically oversampled. Indeed, the sampling parameter, defined as FWHM/Pixel scale, is of the order of 2.5–3 for both J and Ks–band images111Note that the typical FWHM for J- and Ks–band images is 0.05 and 0.06 arcsec, while the PISCES pixel–scale is 0.0193”/pixel. This means that the deconvolution of isolated stars does allow us to provide solid measurements of the unknowns affecting the shape of the PSF. 2) We performed series of numerical experiments on synthetic images and we found that the asymmetrical analytical PSF with four unknowns and five parameters fixed a priori works very well across the entire image. In this context it is worth mentioning that the fit of individual stellar profiles with an asymmetric PSF (nine unknowns) provides less accurate deconvolutions of blended stars in the innermost cluster regions and of fainter stars. 3) The numerical complexity of the PSF fitting significantly decreases.
|
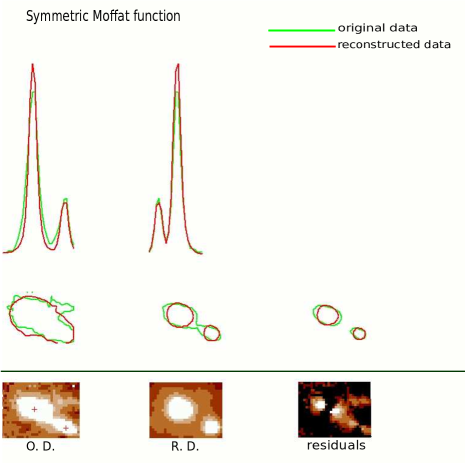
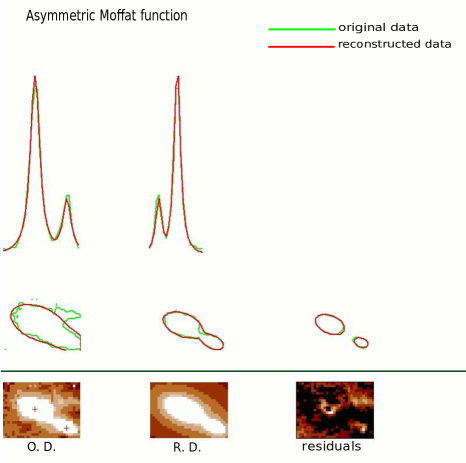
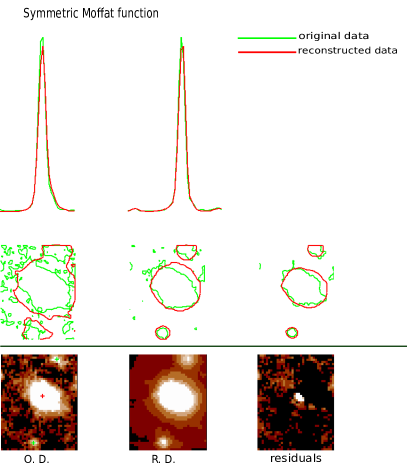
In order to provide a more quantitative analysis of the difference between symmetric and asymmetric analytical PSF Figs. 3–4 display the details of the fit. The plots on the left display the Original Data (OD, green) and the reconstructed Data (RD, red) of the stellar profile projected onto the X- (left) and onto the Y-axis (middle) by using a symmetric Moffat function. The comparison shows that the analytical symmetric PSF does not properly fit the peak of the observed profile. The contours at three arbitrary cuts plotted in the middle panels display a similar problem, but in the wings of the profiles (see also the images plotted in the bottom panel). The discrepancy between observed and reconstructed profile is even more clear in the residual map plotted in the right bottom panel.
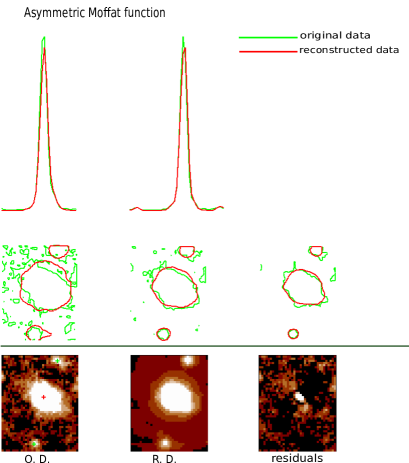
The comparison between observed and reconstructed profile based on an analytical asymmetric PSF is showed in the right panels of Fig. 4. Data plotted in these panels display that the new fits takes account of both the peak and the wings. Indeed the map of the residuals attains vanishing values over the entire area covered by the two close stars. Fig 4 shows the same comparison, but for three nearby stars on Ks–band image. The use of the asymmetric analytical PSF still improves the quality of the fit, but the difference is less clear than for the J-band.
In order to constrain on a quantitative basis the difference between the fit performed with the symmetric and the asymmetric Moffat Function, we estimated the difference in flux, over an area of 1010 pixels around the center of the star, between the reconstructed and the original data. In particular, we adopted the following formula for the residuals:
| (3) |
We found that the residuals in the J-band when using the asymmetric and the symmetric Moffat function are 16% and 34%, respectively. This means a decrease of at least a factor of two. The difference in Ks band is significantly smaller and indeed the two residuals attain similar values, i.e. 20% and 22%, respectively.
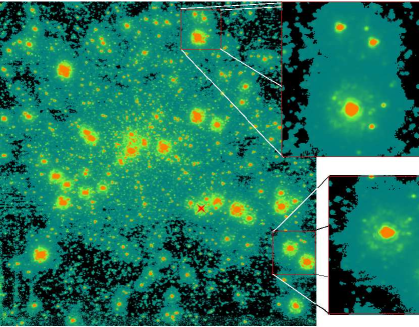
The use of the new asymmetric analytical PSF fitting allowed us to perform accurate photometry across both J- and Ks–band images. In particular, the quality of the individual fits makes the final check of the residual map useless, since the local shape of the PSF takes properly into account the radial variations. To constrain on a more quantitative basis the impact of the new asymmetric PSF, we reconstructed synthetic J- (left panel of Fig. 5) and Ks–band (right panel of Fig. 5) images to be compared with real NIR images collected with SCAO systems. The elongated shape (eggy–like)222The semi–major axis in the J-band ranges from 0.7 to 2.9 pixels, while in the Ks–band from 2.6 to 5.9 pixels. The semi-minor axis attains similar values, and indeed it ranges from 0.6 to 1.9 pixels (J-band) and from 2.3 to 4.4 (Ks–band). and the orientation of the stellar images of the left panel clearly display the same radial trend from the NGS (red dot) showed by real images (see Fig. 2). The similarity also applies to stars located in the corners of the image. The mild change in the shape of the stellar images can also be easily identified in the Ks–band image, but it is less evident when compared with the J-band.
 |
4 Cluster Photometry
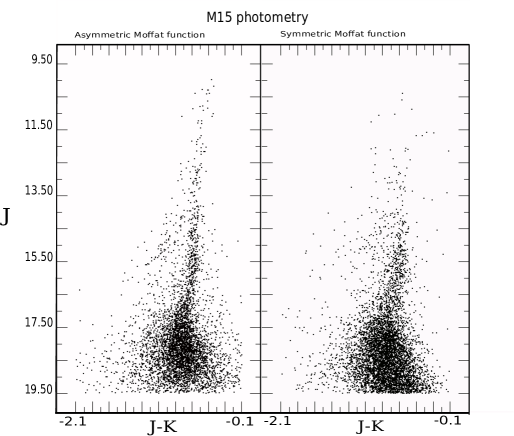
We first performed the photometry on the stacked J- and Ks–band image. The master list includes stars with one measurement in the two bands. The same list was then used to perform the photometry on individual J, and Ks–band images. The final catalog includes stars with at least one measurement per band. Fig. 6 shows the NIR J, J-Ks CMD of the very crowded central pointing. The improvements in using an asymmetric analytical PSF fitting are quite clear. Data plotted in the left panel (asymmetric PSF) display well defined sequences along the Red Giant Branch (RGB, J–Ks=-0.7 mag), the Horizontal Branch (HB, Ks14.5 mag, J–Ks=-1 mag), the sub giant branch (SGB, Ks17 J–Ks=-0.75 mag) and in particular across the MSTO region (Ks18, J–Ks=0.9 mag). On the other hand, the CMD based on a symmetric analytical PSF fitting shows broader evolved sequences (RGB, HB, SGB) and a steady decrease in photometric accuracy approaching the MSTO. This is a crucial difference since the precision in the evaluation of the absolute age of GCs is strongly affected by the photometric precision of the MSTO. Note that an uncertainty of the order of one tenth of a magnitude typically introduces in the comparison with cluster isochrones an uncertainty of the order of 1 Gyr.
The above evidence suggests that the new reduction strategy devised to perform accurate analytical PSF photometry on NIR images collected with SCAO systems appears very promising. Current preliminary results appear even more interesting if we take into account the fact that the cluster regions covered by the central pointing are characterized by a very high central stellar density Indeed, M15 belongs to the small sample of post core–collapsed GCs.
4.1 Absolute photometric calibration
The photometric catalog released by 2MASS has been a quantum jump in the improvement of the absolute calibration of NIR ground-based photometry. However, this catalog can be barely used to provide local standards to new AO systems available at the 8-m class telescopes. The reasons are manifold. The limiting magnitude of the 2MASS catalog is =14–15 mag. This limit becomes even brighter in crowded stellar fields. These objects are typically saturated in NIR images collected with AO systems. The FOV of NIR detectors used with AO systems is at most of the order of 22’, this means that the number of local 2MASS standard stars is quite limited. It goes without saying that a precise calibration, 1–2 hundredths of magnitude, of NIR images collected with AO systems does require a sizable sample of local standards with apparent magnitudes of =16–18 mag. To overcome this problem have been adopted both NIR images collected with both 4m and 8m telescopes (Bono et al. 2010; Stetson et al. 2014).
To calibrate NIR images collected with PISCES at LBT, we secured a set of NIR images collected with LUCI1 on June 2012. The key advantage of the LUCI1 images is that the LUCI1 FOV is 44’, thus it covers the two PISCES pointings. Data reduction for LUCI1 images was performed using the standard procedures DAOPHOT/ALLSTAR/ALLFRAME as described in Monelli et al. 2010[33]. The LUCI1 NIR images were calibrated using 2MASS local standards. The NIR photometry based on LUCI1 images is very accurate down to 19 mag and they were adopted to calibrate the photometric catalogs based on PISCES images (Monelli et al. 2014, to be submitted). Finally, we mention that the use of a sizable sample of local standards overcomes the problem of the aperture correction.
 |
5 The Absolute Age of M15
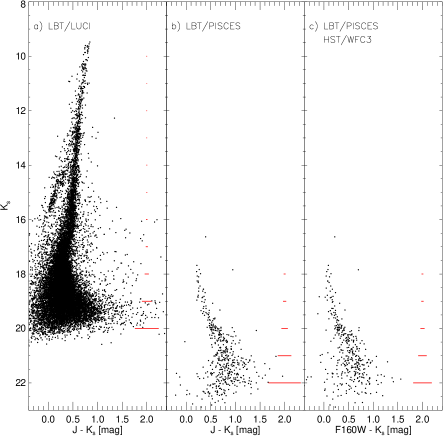
In this section we anticipate a new result detailed in Monelli et al. (2014, to be submitted) concerning the absolute age of M15. This result is based on data collected for the off–center pointing of M15. To perform stellar photometry, we have used the same procedure described above to analyse PISCES@LBT images: an updated version of ROMAFOT with the new asymmetric PSF function (eq. 2). This resulted to be the best choice to obtain the deepest CMD ever observed in near IR by reaching a Ks limiting magnitude of 23 mag, see Fig. 7 (middle panel). In this figure we have also shown the Ks, J-Ks CMD obtained using the camera LUCI1@LBT. As described above, these data were taken mainly for calibration purpose and show the seeing–limited behavior of data taken using the same telescope but a different camera with a pixel scale of 0.118”/px, about 10 times larger than PISCES’one.
We have performed standard data reduction[33] to analyse space telescope data from WFC3@HST using F814W, F606W, and F160W bands. In this paper we show only the results obtained with the near IR channel using F160W passband (see right panel in Fig. 7) to make a fair comparison between space and AO images taken from the ground with LBT. The CMDs coming from the combination of the full set of optical and near IR bands are presented in Monelli et al. 2014 (to be submitted). The resulting near IR CMDs show clearly the jump in limiting magnitude obtained when moving from seeing–limited IR collected with LUCI1 and the AO assisted taken with PISCES@LBT. The reached limiting magnitude is Ks23 mag, that means about 3 mag fainter in Ks band when AO systems are used on the same telescope. In spite of the small FOV corrected for atmosphere turbulence, thanks the AO we are able for the first time to detect the MSK in a very metal poor GGC. The quality obtained using J and Ks bands with PISCES is very likely comparable to what is obtained using a combination of space (F160W) and ground based (Ks) filters. However the intrinsic errors given in J band are much larger than in F160W, this is mainly due to the larger exposure time used for space observation which is 3.5 times larger than what used to integrate J band data.
In order to determine the absolute age of M15, we decided to use the best photometry available, this means a combination of Ks–band from PISCES and optical (F606W) space observations. We have used evolutionary tracks for an old age range (from 12 to 15 Gyr, Vandenberg priv. comm.) with [Fe/H]=-2.4 dex, an enhancement +0.4 and a primordial helium abundance Y0.25. These tracks were transformed into the observational plane using colour–temperature relation provided by Casagrande (priv. comm.). To match the data with isochrones we have adopted a distance modulus of 15.14 mag[34] and a reddening E(B–V)0.08[35].
At this point, we have all the ingredients to derive the absolute age of M15. We approach at this estimation by using two independent methods: the detection of the MSTO and the difference between the MSTO and the MSK magnitudes, i.e. MSTO–MSK (fully described in Bono et al. 2010[12]). We notice that the first method does dependent on distance and reddening whereas the second one, being a differential method, is free from the uncertainties affecting these parameters. In fact, the distance modulus assumed for M15 is given with an error of 0.15 mag[34].
We have used CMD ridge lines to define both the MSTO and the MSK as follows. The MSTO is identified as the bluer point in the TO region. The MSK is defined as the maximum curvature point in the low part of the MS. The same definition has been used to determine the magnitude and colours of these two points for both data and observations. In particular for near IR data, we have constrained the MSTO and MSK locations using LUCI1 and PISCES data respectively. The evolutionary tracks allow us, at fixed chemical composition, to estimate the derivative of the MSTO magnitude as a function of age: F606W/t 0.083 mag/Gyr and Ks/t 0.051 mag/Gyr. The age corresponding to M15 is derived by interpolating the previous relation assuming the observed MSTO magnitude. The error budget has to take into account various sources. From the observational side, we included the error on the TO magnitude, the reddening and distance. In the case of the present data set, the photometric error varies depending on the filter used, from 0.015 in the case of the F606W filter to the 0.04 mag for the LUCI1 Ks. Using these photometric errors and the above derivatives we can estimate the absolute distance of M15 and its global error budget. The MSTO returns 13.97 1.4 Gyr, which is in very good agreement with that obtained using the MSTO–MSK method, i.e. 13.70 0.80 Gyr333The interested reader will find much more details in Monelli et al. (2014, to be submitted)..
6 Conclusions and final remarks
We present new and accurate NIR (J,Ks) photometry for the Galactic globular cluster M15. The images were collected with PISCES at LBT with an innovative SCAO system equipped with high-order pyramid wave-front sensor (FLAO). The images were collected for two different pointings by using two natural guide stars with an apparent magnitude of R 13 mag. The images were collected with medium seeing condition (0.9 arcsec), but the images display a mean FWHM of 0.05 arcsec and of 0.06 arcsec in the J- and in the Ks–band images, respectively. The Strehl ratio on the quoted images ranges from 13–30% (J) to 50–65% (Ks). Current results further support the evidence that new SCAO systems succeed in delivering high-quality NIR images in very crowded fields. However, the J-band images display a complex change in the shape of the PSF when moving at larger radial distances from the natural guide star. In particular, the stellar images become more elongated in approaching the corners of the J-band images. The Ks–band images are marginally affected by this limit.
To overcome this thorny problem we devised a new reduction strategy based on asymmetric Moffat functions to perform accurate and deep photometry in crowded stellar fields. Current approach allowed us to reach in the off–center pointing a limiting magnitude of Ks23 mag. This means, to our knowledge, the deepest K-band photometry ever collected with a ground–based telescope. The new NIR photometry and a well defined knee along the lower main sequence allowed us to estimate the absolute age of M15 with a precision that is a factor of two better when compared with similar estimates based on the MSTO available in the literature, i.e. using the MSTO–MSK we obtain 13.70 0.80 Gyr.
Moreover, we used the photometry of the central pointing to constrain the precision of the new approach in performing accurate and photometry in crowded stellar fields. We found that asymmetric analytical PSF in the J-band images allows us to decrease by a factor of two the residuals in flux between the original and the reconstructed stellar profile. The difference in the Ks–band images is smaller and of the order of 10%. Current findings, once supported by independent investigations, appear very promising not only for constraining the absolute age of globular clusters, but also to improve current understanding of the stellar populations in the crowded regions of the Galactic center and of the Galactic Bulge. Even more importantly, the above results are opening new paths in the reduction and analysis of NIR images will be delivered by NIR detectors available at the next generation of Extremely Large Telescopes. These new observing facilities will be equipped with a challenging suite of AO systems (GLAO, SCAO, MCAO, MOAO). The development of new algorithms to perform accurate photometry seems a good viaticum to fully exploit the capabilities of these unprecedented observing facilities.
Acknowledgements.
GF has been supported by the Futuro in Ricerca di Base 2013 (RBFR13J716). This work was partially supported by PRIN–INAF 2011 “Tracing the formation and evolution of the Galactic halo with VST” (P.I.: M. Marconi) and by PRIN–MIUR (2010LY5N2T) “Chemical and dynamical evolution of the Milky Way and Local Group galaxies” (P.I.: F. Matteucci).References
- [1] McConnachie, A. W., “The Observed Properties of Dwarf Galaxies in and around the Local Group,” AJ 144, 4 (July 2012).
- [2] Marín-Franch, A., Aparicio, A., Piotto, G., Rosenberg, A., Chaboyer, B., Sarajedini, A., Siegel, M., Anderson, J., Bedin, L. R., Dotter, A., Hempel, M., King, I., Majewski, S., Milone, A. P., Paust, N., and Reid, I. N., “The ACS Survey of Galactic Globular Clusters. VII. Relative Ages,” ApJ 694, 1498–1516 (Apr. 2009).
- [3] Leaman, R., VandenBerg, D. A., and Mendel, J. T., “The bifurcated age-metallicity relation of Milky Way globular clusters and its implications for the accretion history of the galaxy,” MNRAS 436, 122–135 (Nov. 2013).
- [4] Kasper, M., Beuzit, J.-L., Verinaud, C., Gratton, R. G., Kerber, F., Yaitskova, N., Boccaletti, A., Thatte, N., Schmid, H. M., Keller, C., Baudoz, P., Abe, L., Aller-Carpentier, E., Antichi, J., Bonavita, M., Dohlen, K., Fedrigo, E., Hanenburg, H., Hubin, N., Jager, R., Korkiakoski, V., Martinez, P., Mesa, D., Preis, O., Rabou, P., Roelfsema, R., Salter, G., Tecza, M., and Venema, L., “EPICS: direct imaging of exoplanets with the E-ELT,” in [Society of Photo-Optical Instrumentation Engineers (SPIE) Conference Series ], Society of Photo-Optical Instrumentation Engineers (SPIE) Conference Series 7735 (July 2010).
- [5] Deep, A., Fiorentino, G., Tolstoy, E., Diolaiti, E., Bellazzini, M., Ciliegi, P., Davies, R. I., and Conan, J.-M., “An E-ELT case study: colour-magnitude diagrams of an old galaxy in the Virgo cluster,” A&A 531, A151 (July 2011).
- [6] Greggio, L., Falomo, R., Zaggia, S., Fantinel, D., and Uslenghi, M., “Resolved Stellar Population of Distant Galaxies in the ELT Era,” PASP 124, 653–667 (July 2012).
- [7] Schreiber, L., La Camera, A., Prato, M., Diolaiti, E., constraint on the PSFS which is an upper bound derived from the Strehl ratio (SR), h. s. i. g. w. s. P. a. f. t. P.-A. s. o. t. E.-E. M. s. M., and different crowding conditions., “Point Spread Function extraction in crowded fields using blind deconvolution,” in [Proceedings of the Third AO4ELT Conference ], Esposito, S. and Fini, L., eds. (Dec. 2013).
- [8] Marchetti, E., Brast, R., Delabre, B., Donaldson, R., Fedrigo, E., Frank, C., Hubin, N., Kolb, J., Lizon, J.-L., Marchesi, M., Oberti, S., Reiss, R., Soenke, C., Tordo, S., Baruffolo, A., Bagnara, P., Amorim, A., and Lima, J., “MAD on sky results in star oriented mode,” in [Society of Photo-Optical Instrumentation Engineers (SPIE) Conference Series ], Society of Photo-Optical Instrumentation Engineers (SPIE) Conference Series 7015 (July 2008).
- [9] Momany, Y., Ortolani, S., Bonatto, C., Bica, E., and Barbuy, B., “Multi-Conjugate Adaptive Optics VLT imaging of the distant old open cluster FSR1415,” MNRAS 391, 1650–1658 (Dec. 2008).
- [10] Gullieuszik, M., Greggio, L., Held, E. V., Moretti, A., Arcidiacono, C., Bagnara, P., Baruffolo, A., Diolaiti, E., Falomo, R., Farinato, J., Lombini, M., Ragazzoni, R., Brast, R., Donaldson, R., Kolb, J., Marchetti, E., and Tordo, S., “Resolving stellar populations outside the Local Group: MAD observations of UKS 2323-326,” A&A 483, L5–L8 (May 2008).
- [11] Moretti, M. I., Dall’Ora, M., Ripepi, V., Clementini, G., Di Fabrizio, L., Smith, H. A., DeLee, N., Kuehn, C., Catelan, M., Marconi, M., Musella, I., Beers, T. C., and Kinemuchi, K., “The Leo IV Dwarf Spheroidal Galaxy: Color-Magnitude Diagram and Pulsating Stars,” ApJL 699, L125–L129 (July 2009).
- [12] Bono, G., Caputo, F., Marconi, M., and Musella, I., “Insights into the Cepheid Distance Scale,” ApJ 715, 277–291 (May 2010).
- [13] Fiorentino, G., Tolstoy, E., Diolaiti, E., Valenti, E., Cignoni, M., and Mackey, A. D., “MAD about the Large Magellanic Cloud. Preparing for the era of Extremely Large Telescopes,” A&A 535, A63 (Nov. 2011).
- [14] Ferraro, F. R., Dalessandro, E., Mucciarelli, A., Beccari, G., Rich, R. M., Origlia, L., Lanzoni, B., Rood, R. T., Valenti, E., Bellazzini, M., Ransom, S. M., and Cocozza, G., “The cluster Terzan 5 as a remnant of a primordial building block of the Galactic bulge,” Nature 462, 483–486 (Nov. 2009).
- [15] Esposito, S., Riccardi, A., Pinna, E., Puglisi, A., Quirós-Pacheco, F., Arcidiacono, C., Xompero, M., Briguglio, R., Agapito, G., Busoni, L., Fini, L., Argomedo, J., Gherardi, A., Brusa, G., Miller, D., Guerra, J. C., Stefanini, P., and Salinari, P., “Large Binocular Telescope Adaptive Optics System: new achievements and perspectives in adaptive optics,” in [Society of Photo-Optical Instrumentation Engineers (SPIE) Conference Series ], Society of Photo-Optical Instrumentation Engineers (SPIE) Conference Series 8149 (Sept. 2011).
- [16] Allard, F., Homeier, D., and Freytag, B., “Stellar to Substellar Model Atmospheres,” in [IAU Symposium ], Richards, M. T. and Hubeny, I., eds., IAU Symposium 282, 235–242 (Apr. 2012).
- [17] Allard, F., Homeier, D., Freytag, B., Schaffenberger, , W., and Rajpurohit, A. S., “Progress in modeling very low mass stars, brown dwarfs, and planetary mass objects.,” Memorie della Societa Astronomica Italiana Supplementi 24, 128 (2013).
- [18] King, I. R., “The Profile of a Star Image,” PASP 83, 199 (Apr. 1971).
- [19] van der Marel, R. P., Gerssen, J., Guhathakurta, P., Peterson, R. C., and Gebhardt, K., “Hubble Space Telescope Evidence for an Intermediate-Mass Black Hole in the Globular Cluster M15. I. STIS Spectroscopy and WFPC2 Photometry,” AJ 124, 3255–3269 (Dec. 2002).
- [20] Stetson, P. B., “The center of the core-cusp globular cluster M15: CFHT and HST Observations, ALLFRAME reductions,” PASP 106, 250–280 (Mar. 1994).
- [21] Stetson, P. B., “DAOPHOT - A computer program for crowded-field stellar photometry,” PASP 99, 191–222 (Mar. 1987).
- [22] Stetson, P. B., “On the growth-curve method for calibrating stellar photometry with CCDs,” PASP 102, 932–948 (Aug. 1990).
- [23] Buonanno, R., Buscema, G., Corsi, C. E., Ferraro, I., and Iannicola, G., “Automated photographic photometry of stars in globular clusters,” A&A 126, 278–282 (Oct. 1983).
- [24] Buonanno, R. and Iannicola, G., “Stellar photometry with big pixels,” PASP 101, 294–301 (Mar. 1989).
- [25] Schechter, P. L., Mateo, M., and Saha, A., “DOPHOT, a CCD photometry program: Description and tests,” PASP 105, 1342–1353 (Nov. 1993).
- [26] Bertin, E. and Arnouts, S., “SExtractor: Software for source extraction.,” A&AS 117, 393–404 (June 1996).
- [27] Bertin, E., “Automated Morphometry with SExtractor and PSFEx,” in [Astronomical Data Analysis Software and Systems XX ], Evans, I. N., Accomazzi, A., Mink, D. J., and Rots, A. H., eds., Astronomical Society of the Pacific Conference Series 442, 435 (July 2011).
- [28] Diolaiti, E., Bendinelli, O., Bonaccini, D., Close, L., Currie, D., and Parmeggiani, G., “Analysis of isoplanatic high resolution stellar fields by the StarFinder code,” A&AS 147, 335–346 (Dec. 2000).
- [29] Anderson, J. and King, I. R., “PSFs, Photometry, and Astronomy for the ACS/WFC,” tech. rep. (Feb. 2006).
- [30] Anderson, J. and van der Marel, R. P., “New Limits on an Intermediate-Mass Black Hole in Omega Centauri. I. Hubble Space Telescope Photometry and Proper Motions,” ApJ 710, 1032–1062 (Feb. 2010).
- [31] Bedin, L. R., Salaris, M., Piotto, G., Anderson, J., King, I. R., and Cassisi, S., “The End of the White Dwarf Cooling Sequence in M4: An Efficient Approach,” ApJ 697, 965–979 (June 2009).
- [32] Lagioia, E. P., Milone, A. P., Stetson, P. B., Bono, G., Prada Moroni, P. G., Dall’Ora, M., Aparicio, A., Buonanno, R., Calamida, A., Ferraro, I., Gilmozzi, R., Iannicola, G., Matsunaga, N., Monelli, M., and Walker, A., “On the Kinematic Separation of Field and Cluster Stars across the Bulge Globular NGC 6528,” ApJ 782, 50 (Feb. 2014).
- [33] Monelli, M., Hidalgo, S. L., Stetson, P. B., Aparicio, A., Gallart, C., Dolphin, A. E., Cole, A. A., Weisz, D. R., Skillman, E. D., Bernard, E. J., Mayer, L., Navarro, J. F., Cassisi, S., Drozdovsky, I., and Tolstoy, E., “The ACS LCID Project. III. The Star Formation History of the Cetus dSph Galaxy: A Post-reionization Fossil,” ApJ 720, 1225–1245 (Sept. 2010).
- [34] Durrell, P. R. and Harris, W. E., “A color-magnitude study of the globular cluster M15,” AJ 105, 1420–1440 (Apr. 1993).
- [35] Sandage, A., Katem, B., and Sandage, M., “The Oosterhoff period groups and the age of globular clusters. I Photometry of cluster variables in M15,” ApJS 46, 41–74 (May 1981).