Crystal nucleation mechanism in melts of short polymer chains under quiescent conditions and under shear flow
Abstract
We present a molecular dynamics simulation study of crystal nucleation from undercooled melts of n-alkanes, and we identify the molecular mechanism of homogeneous crystal nucleation under quiescent conditions and under shear flow. We compare results for -eicosane (C20) and -pentacontahectane (C150), i.e. one system below the entanglement length and one above. Under quiescent conditions, we observe that entanglement does not have an effect on the nucleation mechanism. For both chain lengths, the chains first align and then straighten locally, then the local density increases and finally positional ordering sets in. At low shear rates the nucleation mechanism is the same as under quiescent conditions, while at high shear rates the chains align and straighten at the same time. We report on the effects of shear rate and temperature on the nucleation rates and estimate the critical shear rates, beyond which the nucleation rates increase with the shear rate. In agreement with previous experimental observation and theoretical work, we find that the critical shear rate corresponds to a Weissenberg number of order 1. Finally, we show that the viscosity of the system is not affected by the crystalline nuclei.
pacs:
When a liquid is cooled below its crystal-liquid coexistence temperature, crystallites are formed. The shapes, sizes and structures of these crystallites strongly influence the properties of the final, solidified material. This is particularly relevant for polymers, which generally do not reach a perfect single crystalline state but remain poly- or semicrystalline after cooling.
Polymer melts often flow during processing. Flow can change crystal nucleation and growth processes and hence affect the materials properties of crystalline and semicrystalline plastics. Understanding crystallization in flowing polymer melts is thus a topic of technological relevance. But it is also a challenging topic from the point of view of basic theoretical physics, because relaxation in polymer melts occurs on a hierarchy of time-scales that spans several orders of magnitude. When discussing phase transitions in polymers, one inevitably deals with non-equilibrium processes, which can only to a very limited extent be described by quasi-equilibrium approaches. This fact poses a serious challenge to any attempt to theoretically model polymer crystallization.
In spite of intensive research efforts since the early 1940s, the molecular mechanism of polymer crystallization is still not completely understoodMuthukumar (2004). Experimental research has been carried out using a wide range of techniques both, on polymers under quiescent conditions Imai et al. (1994); Imai M (1995); Ezquerra et al. (1996); Keller et al. (1994); Imai M (1992); Strobl (2000, 2005, 2006); G. Strobl (2007); Strobl (2009) and in external fields Somani et al. (2002a, b); Abuzaina et al. (2002); D. Lellinger et al. (2003); Coppola et al. (2004); Elmoumni and Winter (2006); Acierno and Grizzuti (2008); Zhang et al. (2012). Crystallization rates and critical shear rates have been measured for different polymeric materials, the morphological features of the final crystal structure and the effect of molecular weight on the crystallization kinetics have been studied. But the primary nucleation mechanism has not been identified, because the short length- and time-scales on which it takes place are difficult to access experimentally.
Most theoretical approaches to flow induced crystallization are based on coarse-graining. Generally, sets of coupled differential equations for the time evolution of macroscopic quantities (such as e.g. the volume occupied by crystallites or the thickness of lamellae) are derived partly from the underlying microscopic theories, partly from balance conditions, and from considerations regarding the structure of effective free energy landscapes (see e.g. refs. [Custódio et al. (2009); Coppola et al. (2004); van Meerveld et al. (2008); Zuidema et al. (2001); M. Doi (1986); Shimada et al. (1988); Olmsted, McLeish,Terrill and Ryan (1998); Hongge Tan and Yan (2003); Kaji (2005)]). While undoubtedly useful, these models are inevitably semi-empirical. Coarse-graining requires approximations already in the equilbrium case. For the non-equilibrium case, in which one usually does not know the probability distributions of microstates according to which state-space averages would need to be taken, no systematic approach exists.
As the molecular length- and time scales involved in nucleation and growth processes are below experimental resolution, and a theoretical approach is challenging because of the the full non-eqilibrium nature of the problem, computer simulations are a promising alternative method to solve the problem. McLeish, Olmsted and co-workers have over the past 15 years developed a comprehensive set of theoretical and computer simulation techniques and experimental model systems to study polymers under flow. To address crystallization they derived a kinetic Monte Carlo algorithm on the basis of kinetics extracted from the GLaMM model Graham et al. (2003), embedded it in a Brownian dynamics simulation Graham and Olmsted (2009, 2010) and extended this approach by a fast nucleation algorithm to compute nucleation rates Jolley and Graham (2011). This model captures many features of flow induced crystallization, however, parts of it are based on an effective free energy picture i.e. on the assumption of separating relaxation time-scales and thus quasi-equilbrium.
Atomistic computer simulations have been used to study polymer crystallization under quiescent conditions Esselink et al. (1994); Takeuchi (1998); Fujiwara and Sato (1998, 1999); Yi and Rutledge (2009, 2011); Yi et al. (2013); Zerze et al. (2013); Anwar et al. (2013); Yamamoto (2013, 2010, 2008, 2004, 1998); Luo and Sommer (2011, 2009); Welch and Muthukumar (2001); Meyer and Müller-Plathe (2001); Sommer and Reiter (2000); Waheed et al. (2002); Muthukumar (2005, 2003, 2000) and under flow or large deformation Koyama et al. (2002, 2003); Lavine et al. (2003); Ko et al. (2004); Ionescu et al. (2006); Jabbarzadeh and Tanner (2009); Dukovski and Muthukumar (2003); Baig and Edwards (2010a, b). Most of these studies focus on the growth process rather than the nucleation process, because nucleation is by definition a rare event (an event that occurs on a time-scale much larger than the time-scale of the local dynamics) and therefore difficult to tackle by atomistic simulation. Nucleation in short chain alkanes under quiescent conditions has nevertheless been simulated Esselink et al. (1994); Takeuchi (1998); Fujiwara and Sato (1998, 1999); Yi and Rutledge (2009, 2011); Zerze et al. (2013); Anwar et al. (2013) and a scenario for the nucleation mechanism has been identified. (We will refer to this mechanism in detail in the results section.) The first direct computation of homogeneous nucleation rates in long chain alkanes by means of computer simulation has recently been presented by Rutledge and co-workersYi et al. (2013). Their work was focussed on the nucleation and growth rates and the free energy landscape associated with the crystallization process rather than the microscopic mechanisms.
To our knowledge, there is no simulation study yet that resolves the molecular nucleation mechanism in polymers under shear. In this article, we present a detailed analysis of the formation of crystal nuclei from the melt in short chain alkanes under shear and in long chain alkanes under quiescent and shear conditions.
I Model & Order parameters
We have used a united atom model for polyethylene that has been proposed by Paul et al.Paul et al. (1995) and later modified by Waheed et alWaheed et al. (2002). (For a table of interaction parameters we refer the readers to our previous work Anwar et al. (2013).) In order to carry out the simulations by means of the ESPResSo package Limbach et al. (2006) we implemented (and have made available) the dihedral-cosine potential and Lees Edwards periodic boundary conditions, which were not previously supported by ESPResSo.
We used several order parameters to identify the crystallites in the melt: for the analysis we split the long chains (C150) into segments of 15 monomers, while we regarded the short chains (C20) as single segments. Then we computed the radius of gyration of each segment and the nematic order parameter of those segments that were involved in the formation of the critical nucleus. (A definition and detailed description of these parameters can be found in our previous work on C20 Anwar et al. (2013).) Further we measured the local alignment of bonds: Monomomers within a radius were considered as neighbours, where is the length scale set by the Lennard Jones interaction in the polymer model. Two neighbours and were considered as “aligned” if the chains they belonged to locally were almost parallel . For a particle to be considered “crystalline”, it had to have at least 13 aligned neighbours in case of C20 and 12 aligned neighbours in case of C150. These numbers were obtained by sampling the probability distributions of the number of aligned neighbours in the bulk crystal and the bulk liquid.
II C150 under quiescent conditions
II.1 Simulation details
First we discuss the nucleation mechanism in a quiescent system of -pentacontahectane(C150). We chose C150, because it has the minimum length for which we can capture the effects of entanglement on crystallization and observe a folded chain crystal structure (the entanglement length has been reported to be between 60 and 90 monomersQin and Milner (2011); Hoy et al. (2009); Subramanian and Shanbhag (2008); Tanaka et al. (2000)). We simulated 100 chains at 280K, which corresponds to 30 supercooling. (For the model that we use, the equilibrium melting temperature of C150 is 396.4KYi et al. (2013).) We equilibrated the system at 500K, i.e. well above the melting temperature. After equilibration we quenched the configurations from 500K to 280K and observed the nucleation event. We performed these simulations under constant pressure and constant temperature conditions. The pressure was fixed at 1 atmospheric pressure.
The polymer model contains a Lennard-Jones-type interaction term. We therefore use Lennard Jones units to present our data (i.e. the particle mass , the interaction energy and resulting timescale ). Quantities which can be compared directly with the experimental results are presented in SI units. We used a Langevin dynamics based thermostat and barostatKolb and Dünweg (1999). The friction coefficient used for the thermostat was 1.0 and the piston mass for the barostat was 0.00001.
II.2 Nucleus formation
To determine the induction time and the size of the critical nucleus we performed a mean first passage time analysisWedekind et al. (2007) on 20 independent trajectories. (This method has been successfully applied to simulation data of nucleation in -alkanes before Yi and Rutledge (2009, 2011); Yi et al. (2013).) The values for the induction time and the number of particles in the critical nucleus are given in Table 1. We find the nucleation rates to be in rough agreement with the results of Yi et al. Yi et al. (2013). As we were using slightly different system sizes, different barostats and thermostats, small differences in the results were expected.
| Study | (ns) | ||
|---|---|---|---|
| Yi.et .al Yi et al. (2013) | 14314 | 29319 | 1.470.10 |
| This work | 879 | 35441 | 0.720.08 |
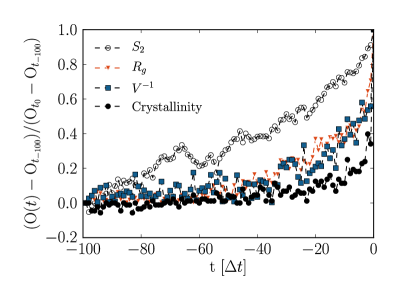
To analyze the nucleation mechanism, we identify in each trajectory those particles that are part of the critical nucleus at the nucleation time . We then trace them backwards in time and compute their structural and orientational properties. We proceed backwards until the particles are indistinguishable from the melt particles. For 20 independent trajectories we compute the average radius of gyration of all chain segments that are part of the nucleus at , the nematic order of these chain segments, the average volume of the Voronoi(Rycroft, 2009) cell associated to each particle that is part of the nucleus and its crystallinity order parameter. In Fig. 1 we show the relative variations of these quantities with respect to the values they had at , where . When we advance from the supercooled melt towards the formation of the critical nucleus at , we observe first an increase in the global orientational order , then an increase in the radius of gyration of the segments and in the local density, and finally the crystal structure is formed. We conclude that the nucleation mechanism in long, entangled chains is the same as in short, non-entangled chains: orientational ordering precedes straightening Anwar et al. (2013).
Note that the Voronoi volume per particle in the nucleus does not deviate from its melt value until the very late stages of the nucleation process. We are thus not dealing with the spinodal decomposition assisted crystallization process that has been proposed by Olmsted Olmsted, McLeish,Terrill and Ryan (1998). Our results also stand in contrast to the scenario suggested by Doi et al. in which crystallization is initiated by an increase in the persistence length, followed by the alignment of the chains M. Doi (1986); Shimada et al. (1988).
In Fig. 2 we present snapshots of the formation of the critical nucleus at different times from to . The monomers that form the critical nucleus at are highlighted as large gray beads. The red color shows the segments of chains that participate with a single stem in the formation of the critical nucleus while blue, green and orange indicate those chains which fold back and participate in the formation of the critical nucleus with more than one stem. For the case of folded chains we show complete chains instead of segments so that folds and tails can be identified. The images of the formation of the nucleus are consistent with the mechanism we proposed based on the values of , , and the crystallinity order parameter (fig. 1).
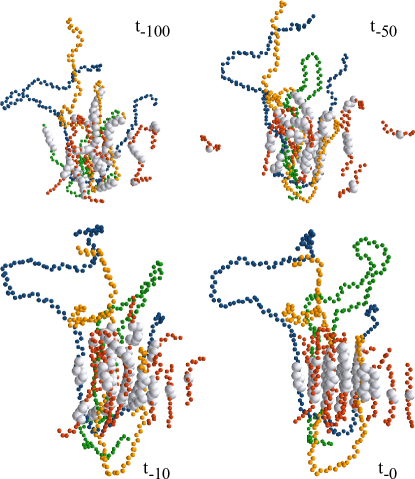
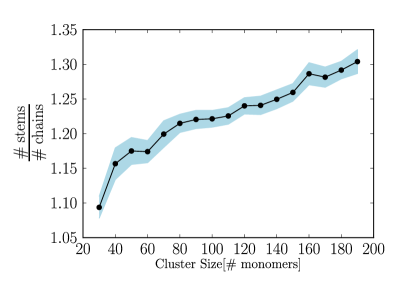
The critical nuclei consist of some chain segment (stems) from different chains and some from the same chain, which is folded. The primary nucleation mechanism is thus a combination of intramolecular and intermolecular mechanisms. Fig. 3 shows the ratio of the number of stems to the number of chains. It is always larger than unity, i.e. there are folded and non-folded chains in the clusters.
III C20 under shear
III.1 Simulation details
We studied the effect of shear on the nucleation rate and mechanism in -eicosane (C20) by means of MD simulations at controlled temperature and constant volume, particle number and shear rate in a box with Lees-Edwards boundary conditions. The system consisted of 500 chains. We equilibrated it at 450K, which is well above the melting temperature. (The equilibrium melting temperature of C20 in the simulation model we use is K Yi and Rutledge (2011), which is in agreement with the experimentally observed value). To set the density of the metastable melt at 1 atm pressure we used Table 2.
We quenched the system from 450K to 250K, applied shear and observed the nucleation event. We ran simulations at seven different shear rates ranging from to ( to ). We also performed simulations at zero shear rate for comparison and we did not find any difference between the nucleation rate at the lowest non-zero shear rate and at zero shear rate. We used the DPD thermostat Soddemann et al. (2003) with the friction coefficient .
In order to avoid the artefactual decoupling of the system from its periodic images remarked upon by Chatterjee Chatterjee (2007) when using the DPD thermostat to treat a dissipative shear-flow, a modification to the pairwise dissipative DPD force was made:
| (1) | |||||
| (2) |
Where is laminar flow velocity, is the pairwise velocity parallel to the laminar flow field, is the component of pairwise separation perpendicular to the flow field in the shear plane and L is the length of simulation box. The effect of this modification is to exempt the laminar flow profile from dissipative forces, while allowing dissipation to operate as normal on the flow field with laminar flow subtracted.
III.2 Nucleus formation
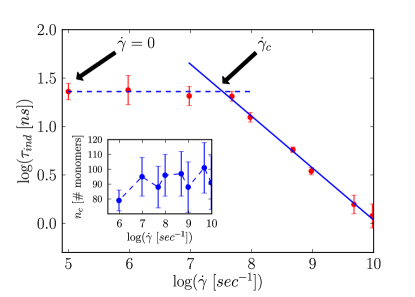
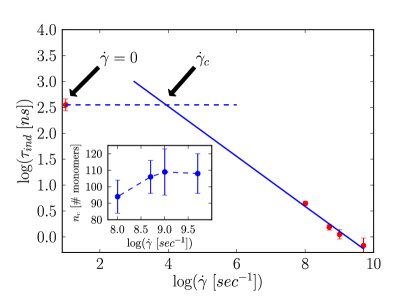
Fig. 4 shows the induction time as a function of shear rate at 250K. There are two regimes, one in which flow has no effect on the induction time, and one where the induction time decreases as a power law in the shear rate. This observation agrees with experimental resultsCoppola et al. (2004); Derakhshandeh and Hatzikiriakos (2012) as well as with the theoretical work by Grizzuti and coworkers Marrucci and Grizzuti (1983); Coppola et al. (2004). Based on the assumption that shear can only affect nucleation if the sheared chains do not have enough time to relax back into their equilibrium structure, the crossover is expected to occur at Weissenberg number , where is the longest relaxation time in the system, and is the critical shear rate, at which the induction time begins to drop. In our simulation data can be estimated from the intersection of the line (continuous) drawn through the induction time data at high shear rates and a horizontal line (dashed) at the value of the induction time under quiescent conditions (). If we assume that the center of mass diffusion of a chain is the slowest relevant process in the system, we find , which confirms the assumption. (Here, we have used the time a chain needs to diffuse over the length of its radius of gyration as an estimate of .)
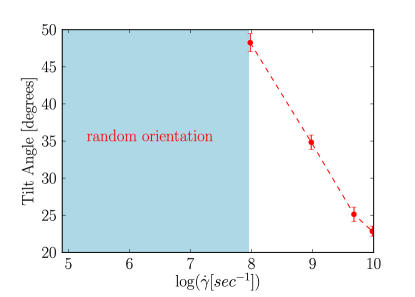
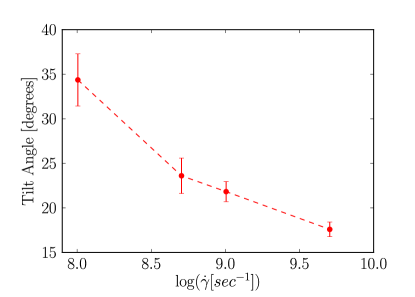
In agreement with this interpretation, we find that at the nuclei are oriented in any random direction, while at the nuclei are oriented on average in the direction of flow, i.e. the stems are parallel to the flow field. In Fig. 5, we show the average tilt angle of the critical nucleus with respect to the flow field at different shear rates. With increasing shear rate the alignment becomes stronger (this effect is also know from experiments Manias (1995); Peters and Tildesley (1995)). In the inset of Fig. 4, the size of the critical nucleus is plotted against the shear rate: there is no effect of shear.
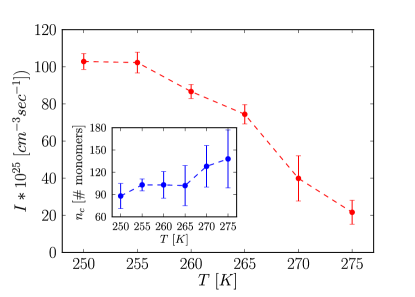
Next we discuss the effect of temperature on the nucleation rate under shear flow. We carried out simulations at seven different temperatures ranging from 250K to 280K at a shear rate of . The integration timestep used in the simulations at 250K was 0.005. Fig. 6 shows the nucleation rate versus temperature. As expected, the nucleation rate decreases with increasing temperature. However, it increases only by a factor of 5 over the temperature range from K to K. As is well above the critical shear rate, the effect of flow on the nucleation rate is stronger than the effect of temperature. The chains align primarily because they are sheared, and only secondarily because of the chemical potential difference between the bulk crystal and the bulk, metastable melt. (Again this observation is in agreement with experiments and quasi-equilbrium theories Coppola et al. (2004); Derakhshandeh and Hatzikiriakos (2012).) In the inset of Fig. 6, we show the critical nucleus size at different degrees of supercooling. As shear is the dominating driving force for crystallization, the size of the critical nucleus depends only weakly on temperature.
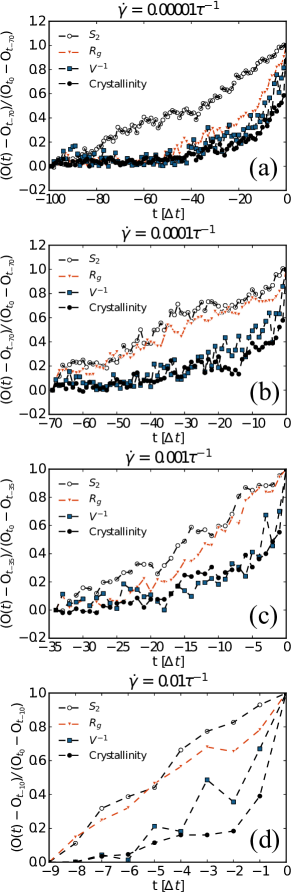
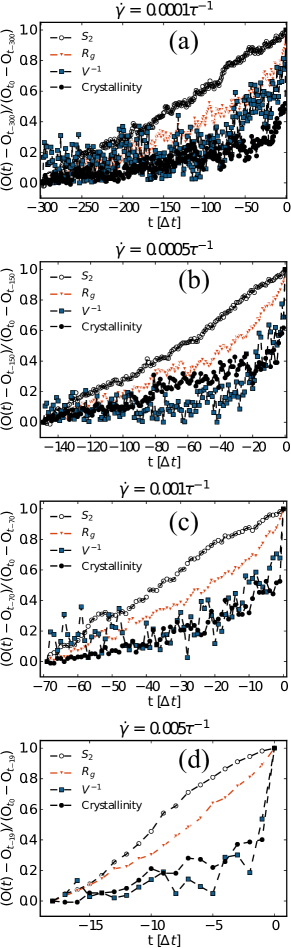
To study the nucleation mechanism we analyze 10 independent trajectories for every shear rate again in terms of the average radius of gyration of all chains that are part of the nucleus at , the nematic order of these chains, the average volume of the Voronoi cell associated to each particle that is part of the nucleus and its crystallinity order parameter. In Fig. 7 we show the relative variations of these quantities with respect to the values they had at , , and respectively, where , at shear rates (), (), () and () respectively. For the lowest shear rate, , on approach to the formation of the critical nucleus at we observe first an increase in the global orientational order , then an increase in the radius of gyration and in the local density, and finally local positional and orientational order are established. Thus the nucleation mechanism is the same as in the quiescent case Anwar et al. (2013): first the chains align, then they straighten.
At and at higher shear rates, we observe a simultaneous increase in the global orientational order and in the radius of gyration . This agrees with the common interpretation of : when the Weissenberg number exceeds 1, the chains are straightened and oriented in the direction of flow. Thus alignment is enhanced, and the crystallization kinetics are accelerated.
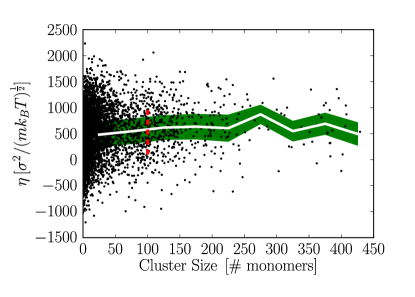
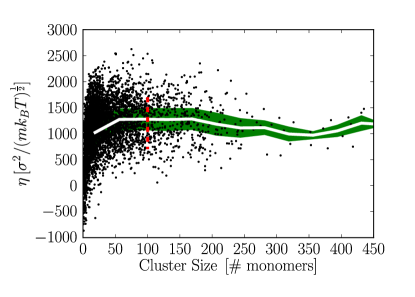
We have shown that the flow field has an effect on the nucleation rate. In turn, the presence of the nucleus should also have an effect on the flow field, because the mechanical properties of a crystal differ considerably from those of the melt. In fig. 8 we show the shear viscosity (measured using the instantatneous system average of the stress tensor) as a function of cluster size for a system consisting of 500 chains of C20, at 250K and at a shear rate of . The black dots represent the simulation data points (which are subject to strong fluctuations due to the small system size), the red dashed line shows the size of the critical nucleus, the white line represents the mean value of the viscosity and the green envelop around the white line represents the standard deviation. We do not observe any change in the viscosity during the formation of the nucleus and growth up to a cluster size of 450 monomers. Above this cluster size the scalar pressure started to decrease, because the phase transition was simulated in the NVT ensemble. We conclude that the nucleation events do not have an effect on the flow field, as the nuclei are small for the temperatures that we discuss here.
IV C150 under shear
We performed simulations of 100 chains of C150, equilibrated the system at 500K and then quenched it to 280K. All simulations were carried out under constant volume and temperature conditions at a density of 0.89 . We applied shear rates ranging from 0.0001 to 0.005 ( to ).
In Fig. 9 we show the induction time versus the shear rate. The red circles represent the simulation data points and the blue line is a fit. Again, the critical shear rate can be estimated as the intersection of the fitted line (continuous) at higher shear rate and a horizontal line (dashed) placed at the value of the induction time under quiescent conditions (). (The data point at is the same as in Table 1.) In the inset of Fig. 9, the size of the critical nucleus is shown versus the shear rate. It is constant within the error bars. And above , the crystallites are again aligned with the flow field (fig. 11). Thus all results are qualitatively the same as those shown in Fig. 4 for C20. Quanititatively, however, there is a difference: if we take the time the center of mass of a chain needs to diffuse across its radius of gyration to estimate the Weissenberg number at the critical shear rate, we obtain . We do not interpret this as a contradiction to the theory, but rather as a finite-size effect. The induction time at zero shear rate has been obtained at constant pressure, while the induction times under shear have been obtained at constant volume. The system sizes that we simulated were relatively small, thus even though the average densities and pressures were matched, there were large fluctuations (much larger than in the case of C20, where we could work with more chains). We therefore assume that our estimate of is not accurate.
To identify the nucleation mechanism, we analyze 10 independent trajectories for every shear rate in terms of the order parameters that we introduced in the previous section. In Fig. 10 we show the relative variations of these quantities with respect to the values they had at , , and respectively, where at shear rates (), (), () and () respectively. For all shear rates, we observe first an increase in the nematic order , then an increase in the radius of gyration and in the local density, and finally the crystal structure with local order is formed.
To conclude, we show in fig. 12 the shear viscosity as a function of cluster size at a shear rate of . Again we do not observe any change in the viscosity during the formation of the nucleus and growth up to cluster size of 450 monomers.
V Conclusions
We have simulated crystal nucleation from undercooled melts of short polymer chains under quiescent and shear conditions and analyzed the formation of the critical nucleus. For C150, which is longer than the entanglement length, we observe the same nucleation mechanism as for C20Anwar et al. (2013), which is shorter than the entanglement length: under quiescent conditions, first the chain segments align, then they straighten, and finally the cluster becomes denser and local positional and orientational order are established.
At low shear rates we observe the same nucleation mechanism as under quiescent conditions while at high shear rates the chains (or chain segments) align and straighten at the same time, then the local density increases and finally local positional and orientational order are established. We estimate the critical shear rates for both systems(C20 & C150) and find power law behaviour between nucleation rate and shear rate in agreement with experiments and theoryCoppola et al. (2004).
Acknowledgements.
We thank Francesco Turci, Jens-Uwe Sommer, Roland Sanctuary, Jörg Baller and Carlo Di Giambattista for stimulating discussions. This project has been financially supported by the National Research Fund (FNR) within the CORE project Polyshear. Computer simulations presented in this paper were carried out using the HPC facility of the University of Luxembourg.References
- Muthukumar (2004) M. Muthukumar, “Nucleation in polymer crystallization,” in Advances in Chemical Physics (John Wiley & Sons, Inc., 2004) pp. 1–63.
- Imai et al. (1994) M. Imai, K. Kaji, and T. Kanaya, Macromolecules 27, 7103 (1994).
- Imai M (1995) M. Imai, K. Kaji, T. Kanaya and Y. Sakai, Physical Review B 52, 12696 (1995).
- Ezquerra et al. (1996) T. A. Ezquerra, E. López-Cabarcos, B. S. Hsiao, and F. J. Baltà-Calleja, Physical Review E 54, 989 (1996).
- Keller et al. (1994) A. Keller, M. Hikosaka, S. Rastogi, A. Toda, P. Barham, and G. Goldbeck-Wood, Journal of Materials Science 29, 2579 (1994).
- Imai M (1992) M. Imai, K. Mori, T. Mizukami, K. Kaji, and T. Kanaya, Polymer 33, 4451 (1992).
- Strobl (2000) G. Strobl, The European Physical Journal E 3, 165 (2000).
- Strobl (2005) G. Strobl, The European Physical Journal E 18, 295 (2005).
- Strobl (2006) G. Strobl, Progress in Polymer Science 31, 398–442 (2006).
- G. Strobl (2007) T. Y. C. G. Strobl, Eur. Phys. J. E 23, 55 (2007).
- Strobl (2009) G. Strobl, Reviews of Modern Physics 81, 1287 (2009).
- Somani et al. (2002a) R. Somani, L. Yang, I. Sics, B. Hsiao, N. Pogodina, H. Winter, P. Agarwal, H. Fruitwala, and A. Tsou, Macromolecular Symposia 185, 105 (2002a).
- Somani et al. (2002b) R. H. Somani, L. Yang, and B. S. Hsiao, Physica A: Statistical Mechanics and its Applications 304, 145 (2002b), scattering Studies of Mesoscopic Scale Structure and Dynamics in Soft Matter.
- Abuzaina et al. (2002) F. M. Abuzaina, B. D. Fitz, S. Andjelić, and D. D. Jamiolkowski, Polymer 43, 4699 (2002).
- D. Lellinger et al. (2003) D. Lellinger, G. Floudas, and I. Alig, Polymer 44, 5759 (2003).
- Coppola et al. (2004) S. Coppola, L. Balzano, E. Gioffredi, P. L. Maffettone, and N. Grizzuti, Polymer 45, 3249 (2004).
- Elmoumni and Winter (2006) A. Elmoumni and H. Winter, Rheologica Acta 45, 793 (2006).
-
Acierno and Grizzuti (2008)
S. Acierno and N. Grizzuti,
International Journal of Material Forming 1, 583 (2008). - Zhang et al. (2012) R.-C. Zhang, A. Lu, and Z.-B. Xu, Journal of Applied Polymer Science 124, 1562 (2012).
- Custódio et al. (2009) F. J. Custódio, R. J. Steenbakkers, P. D. Anderson, G. W. Peters, and H. E. Meijer, Macromolecular Theory and Simulations 18, 469 (2009).
- van Meerveld et al. (2008) J. van Meerveld, M. Hütter, and G. W. Peters, Journal of Non-Newtonian Fluid Mechanics 150, 177 (2008).
- Zuidema et al. (2001) H. Zuidema, G. W. Peters, and H. E. Meijer, Macromolecular theory and simulations 10, 447 (2001).
- M. Doi (1986) S. E. M. Doi, The Theory of Polymer Dynamics (Oxford University Press, 1986).
- Shimada et al. (1988) T. Shimada, M. Doi, and K. Okano, The Journal of Chemical Physics 88, 7181 (1988).
- Olmsted, McLeish,Terrill and Ryan (1998) P. D. Olmsted, W. C. K. Poon, T. C. B. McLeish, N. J. Terrill and A. J. Ryan, Physical Review Letters 81, 373 (1998).
- Hongge Tan and Yan (2003) B. M. Hongge Tan and D. Yan, The Journal of Chemical Physics 119, 2886 (2003).
- Kaji (2005) K. Kaji, “Handbook of thermoplastic polyesters: Homopolymers, copolymers, blends, and composites,” in Handbook of Thermoplastic Polyesters (Wiley-VCH Verlag GmbH & Co. KGaA, 2005) Chap. Structure Formation in PET during the Induction Period of Crystallization, pp. 225–251.
- Graham et al. (2003) R. S. Graham, A. E. Likhtman, T. C. B. McLeish, and S. T. Milner, Journal of Rheology (1978-present) 47, 1171 (2003).
- Graham and Olmsted (2009) R. S. Graham and P. D. Olmsted, Physical Review Letters 103, 115702 (2009).
- Graham and Olmsted (2010) R. S. Graham and P. D. Olmsted, Faraday discussions 144, 71 (2010).
- Jolley and Graham (2011) K. Jolley and R. S. Graham, The Journal of Chemical Physics 134, 164901 (2011).
- Esselink et al. (1994) K. Esselink, P. A. J. Hilbers, and B. W. H. van Beest, The Journal of Chemical Physics 101, 9033 (1994).
- Takeuchi (1998) H. Takeuchi, The Journal of Chemical Physics 109, 5614 (1998).
- Fujiwara and Sato (1998) S. Fujiwara and T. Sato, Physical Review Letters 80, 991 (1998).
- Fujiwara and Sato (1999) S. Fujiwara and T. Sato, The Journal of Chemical Physics 110, 9757 (1999).
- Yi and Rutledge (2009) P. Yi and G. C. Rutledge, The Journal of Chemical Physics 131, 1 (2009).
- Yi and Rutledge (2011) P. Yi and G. C. Rutledge, The Journal of Chemical Physics 135, 11 (2011).
- Yi et al. (2013) P. Yi, C. R. Locker, and G. C. Rutledge, Macromolecules 46, 4723 (2013).
- Zerze et al. (2013) H. Zerze, J. Mittal, and A. J. McHugh, Macromolecules 46, 9151 (2013).
- Anwar et al. (2013) M. Anwar, F. Turci, and T. Schilling, The Journal of Chemical Physics 139, 214904 (2013).
- Yamamoto (2013) T. Yamamoto, The Journal of Chemical Physics 139, 054903 (2013).
- Yamamoto (2010) T. Yamamoto, The Journal of Chemical Physics 133, 034904 (2010).
- Yamamoto (2008) T. Yamamoto, The Journal of Chemical Physics 129, 184903 (2008).
- Yamamoto (2004) T. Yamamoto, Polymer 45, 1357 (2004), modeling of Chain Conformations and Spatial Configurations.
- Yamamoto (1998) T. Yamamoto, The Journal of Chemical Physics 109, 4638 (1998).
- Luo and Sommer (2011) C. Luo and J.-U. Sommer, Macromolecules 44, 1523 (2011).
- Luo and Sommer (2009) C. Luo and J.-U. Sommer, Physical Review Letters 102, 147801 (2009).
- Welch and Muthukumar (2001) P. Welch and M. Muthukumar, Physical Review Letters 87, 218302 (2001).
- Meyer and Müller-Plathe (2001) H. Meyer and F. Müller-Plathe, The Journal of Chemical Physics 115, 7807 (2001).
- Sommer and Reiter (2000) J.-U. Sommer and G. Reiter, The Journal of Chemical Physics 112, 4384 (2000).
- Waheed et al. (2002) N. Waheed, M. S. Lavine, and G. C. Rutledge, The Journal of Chemical Physics 116, 2301 (2002).
- Muthukumar (2005) M. Muthukumar, “Modeling polymer crystallization,” in Interphases and Mesophases in Polymer Crystallization III, Advances in Polymer Science, Vol. 191, edited by G. Allegra (Springer Berlin Heidelberg, 2005) pp. 241–274.
- Muthukumar (2003) M. Muthukumar, Phil. Trans. Roy. Soc. A361, 539 (2003).
- Muthukumar (2000) M. Muthukumar, The European Physical Journal E 3, 199 (2000).
- Koyama et al. (2002) A. Koyama, T. Yamamoto, K. Fukao, and Y. Miyamoto, Physical Review E 65, 050801 (2002).
- Koyama et al. (2003) A. Koyama, T. Yamamoto, K. Fukao, and Y. Miyamoto, Journal of Macromolecular Science, Part B 42, 821 (2003).
- Lavine et al. (2003) M. S. Lavine, N. Waheed, and G. C. Rutledge, Polymer 44, 1771 (2003).
- Ko et al. (2004) M. J. Ko, N. Waheed, M. S. Lavine, and G. C. Rutledge, The Journal of Chemical Physics 121, 2823 (2004).
- Ionescu et al. (2006) T. C. Ionescu, C. Baig, B. J. Edwards, D. J. Keffer, and A. Habenschuss, Physical Review Letters 96, 037802 (2006).
- Jabbarzadeh and Tanner (2009) A. Jabbarzadeh and R. Tanner, Journal of Non-Newtonian Fluid Mechanics 160, 11 (2009), complex flows of complex fluids.
- Dukovski and Muthukumar (2003) I. Dukovski and M. Muthukumar, The Journal of Chemical Physics 118, 6648 (2003).
- Baig and Edwards (2010a) C. Baig and B. J. Edwards, Journal of Non-Newtonian Fluid Mechanics 165, 992 (2010a), proceedings of the 5th International Workshop on Non-Equilibrium Thermodynamics 2009.
- Baig and Edwards (2010b) C. Baig and B. J. Edwards, EPL 89, 36003 (2010b).
- Paul et al. (1995) W. Paul, D. Y. Yoon, and G. D. Smith, The Journal of Chemical Physics 103, 1702 (1995).
- Limbach et al. (2006) H. J. Limbach, A. Arnold, B. A. Mann, and C. Holm, Computer Physics Communications 174, 704 (2006).
- Qin and Milner (2011) J. Qin and S. T. Milner, Soft Matter 7, 10676 (2011).
- Hoy et al. (2009) R. S. Hoy, K. Foteinopoulou, and M. Kröger, Physical Review E 80, 031803 (2009).
- Subramanian and Shanbhag (2008) G. Subramanian and S. Shanbhag, The Journal of Chemical Physics 129, 144904 (2008).
- Tanaka et al. (2000) M. Tanaka, K. Iwata, and N. Kuzuu, Computational and Theoretical Polymer Science 10, 299 (2000).
- Kolb and Dünweg (1999) A. Kolb and B. Dünweg, Journal of Chemical Physics 111, 4453 (1999).
- Wedekind et al. (2007) J. Wedekind, R. Strey, and D. Reguera, The Journal of Chemical Physics 126, 134103 (2007).
- Rycroft (2009) C. H. Rycroft, Chaos 19, 041111 (2009).
- Soddemann et al. (2003) T. Soddemann, B. Dünweg, and K. Kremer, Physical ReviewPhysical Review Letters E 68, 046702 (2003).
- Chatterjee (2007) A. Chatterjee, Molecular Simulation 33, 1233 (2007).
- Derakhshandeh and Hatzikiriakos (2012) M. Derakhshandeh and S. Hatzikiriakos, Rheologica Acta 51, 315 (2012).
- Marrucci and Grizzuti (1983) G. Marrucci and N. Grizzuti, Journal of Rheology (1978-present) 27, 433 (1983).
- Manias (1995) E. Manias, A computer simulation study Nanorheology of strongly confined molecular fluids, Ph.D. thesis, State University of Groningen The Netherlands (1995).
- Peters and Tildesley (1995) G. H. Peters and D. J. Tildesley, Physical Review E 52, 1882 (1995).