Trigonometric Parallaxes of Star Forming Regions
in the Perseus Spiral Arm
Abstract
We report trigonometric parallaxes and proper motions of water masers for 12 massive star forming regions in the Perseus spiral arm of the Milky Way as part of the Bar and Spiral Structure Legacy (BeSSeL) Survey. Combining our results with 14 parallax measurements in the literature, we estimate a pitch angle of 9∘.9 1∘.5 for a section of the Perseus arm. The 3-dimensional Galactic peculiar motions of these sources indicate that on average they are moving toward the Galactic center and slower than the Galactic rotation.
1 INTRODUCTION
Although our Galaxy is known to be a barred spiral galaxy, it is very difficult to determine its structure owing to our location within its disk. Considerable uncertainties still exist regarding the number and locations of spiral arms, the length and orientation of the central bar and the rotation curve. Kinematic distances have often been used to infer spiral structure, however, they have large uncertainties stemming from inaccuracies in the adopted Galactic rotation model and the existence of significant peculiar (non-circular) motions (Xu et al., 2006; Reid et al., 2009b).
Using very long baseline interferometry (VLBI), one can measure trigonometric parallaxes to massive star forming regions with accuracies of order 10 as (Honma et al., 2012; Reid et al., 2014). The Bar and Spiral Structure Legacy (BeSSeL) Survey111http://bessel.vlbi-astrometry.org/ is a National Radio Astronomy Observatory (NRAO) 222The National Radio Astronomy Observatory is a facility of the National Science Foundation operated under cooperative agreement by Associated Universities, Inc. key science project that aims to study the spiral structure and kinematics of our Galaxy by measuring trigonometric parallaxes and proper motions of hundreds of massive star forming regions with the Very Long Baseline Array (VLBA).
The Perseus arm has been proposed as one of the two dominate spiral arms of the Galaxy, emanating from the far side of the Galactic bar (Churchwell et al., 2009). Toward the Galactic anticenter, the Perseus arm is relatively close to the Sun and parallaxes and proper motions of 14 sources in the Perseus arm have already been obtained with the VLBA, the VLBI Exploration of Radio Astrometry (VERA) array, and the European VLBI Network (EVN) (Asaki et al., 2010; Hachisuka et al., 2009; Moellenbrock et al., 2009; Moscadelli et al., 2009; Niinuma et al., 2011; Oh et al., 2010; Reid et al., 2009a; Rygl et al., 2010; Sakai et al., 2012; Sato et al., 2008; Shiozaki et al., 2011; Xu et al., 2006; Zhang et al., 2013).
Here we present trigonometric parallaxes and proper motions of 12 massive star forming regions in the Perseus spiral arm in the outer Galaxy. Combined with results from the literature (with one duplicate source, G094.60–1.79), we have a large sample of 25 sources located in the Perseus arm. These parallax measurements extend our sampling of the arm to smaller and larger Galactic longitudes (in the second and third quadrants) and essentially double the number of Perseus arm sources with trigonometric parallaxes.
In Section 2, we describe our observations and data reduction. We present the parallax and proper motion results in Section 3. In Section 4, we discuss the Galactic locations and peculiar motions of the sources in the Perseus spiral arm. Finally, we summarize our results in Section 5.
2 OBSERVATIONS
| Project | Source | Epoch 1 | Epoch 2 | Epoch 3 | Epoch 4 | Epoch 5 | Epoch 6 |
|---|---|---|---|---|---|---|---|
| BR145E | G100.37–3.57 | 2010 May 16 | 2010 Aug 09 | 2010 Oct 12 | 2010 Nov 27 | 2010 Dec 31 | 2011 May 13 |
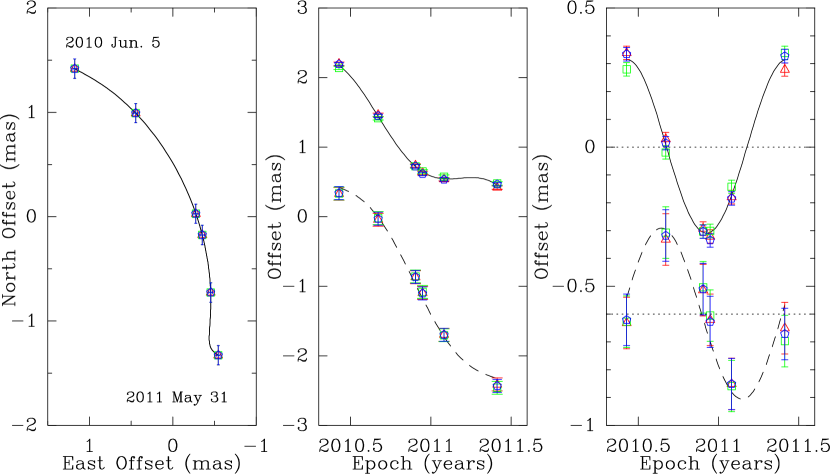
| BR145F | G108.20+0.58 | 2010 Jun 05 | 2010 Sep 02 | 2010 Nov 26 | 2010 Dec 12 | 2011 Jan 30 | 2011 May 31 |
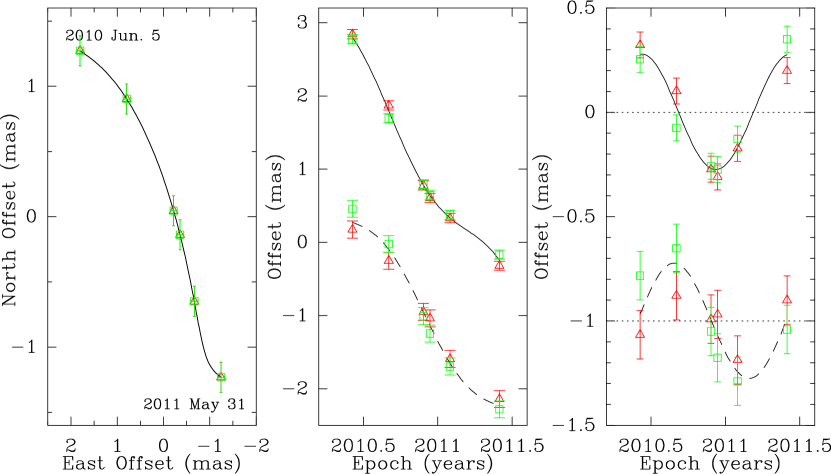
| G108.47–2.81 | 2010 Jun 05 | 2010 Sep 02 | 2010 Nov 26 | 2010 Dec 12 | 2011 Jan 30 | 2011 May 31 | |
| G111.25–0.77 | 2010 Jun 05 | 2010 Sep 02 | 2010 Nov 26 | 2010 Dec 12 | 2011 Jan 30 | 2011 May 31 | |
| BR145G | G183.72–3.66 | 2010 Apr 23 | 2010 Jun 20 | 2010 Aug 23 | 2010 Sep 25 | 2010 Nov 16 | 2011 Mar 21 |
| BR145K | G229.57+0.15 | 2010 Oct 07 | 2011 Jan 04 | 2011 Mar 09 | 2011 Apr 16 | 2011 Jun 02 | 2011 Oct 04 |
| G236.81+1.98 | 2010 Oct 07 | 2011 Jan 04 | 2011 Mar 09 | 2011 Apr 16 | 2011 Jun 02 | 2011 Oct 04 | |
| G240.31+0.07 | 2010 Oct 07 | 2011 Jan 04 | 2011 Mar 09 | 2011 Apr 16 | 2011 Jun 02 | 2011 Oct 04 | |
| BR145P | G094.60–1.79 | 2011 May 15 | 2011 Aug 07 | 2011 Oct 21 | 2011 Nov 22 | 2012 Jan 08 | (2012 May 09) |
| G095.29–0.93 | 2011 May 15 | 2011 Aug 07 | 2011 Oct 21 | 2011 Nov 22 | 2012 Jan 08 | 2012 May 09 | |
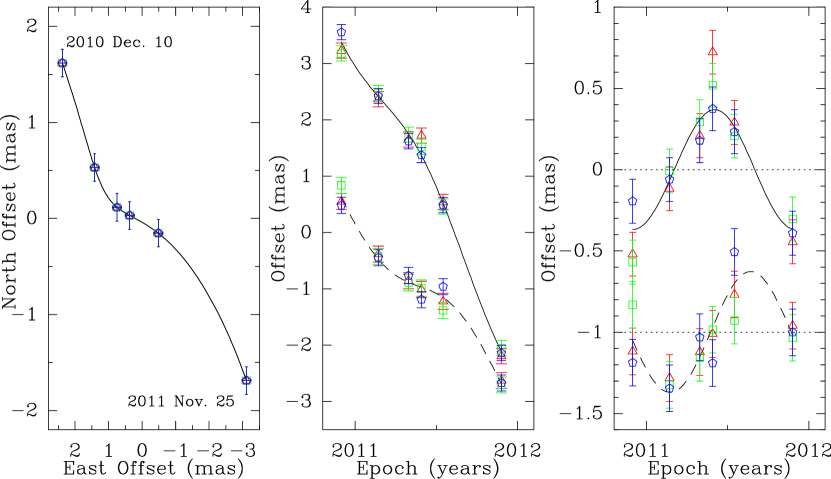
| BR145V | G108.59+0.49 | 2010 Dec 10 | 2011 Feb 21 | 2011 Apr 30 | 2011 May 29 | 2011 Jul 17 | 2011 Nov 25 |
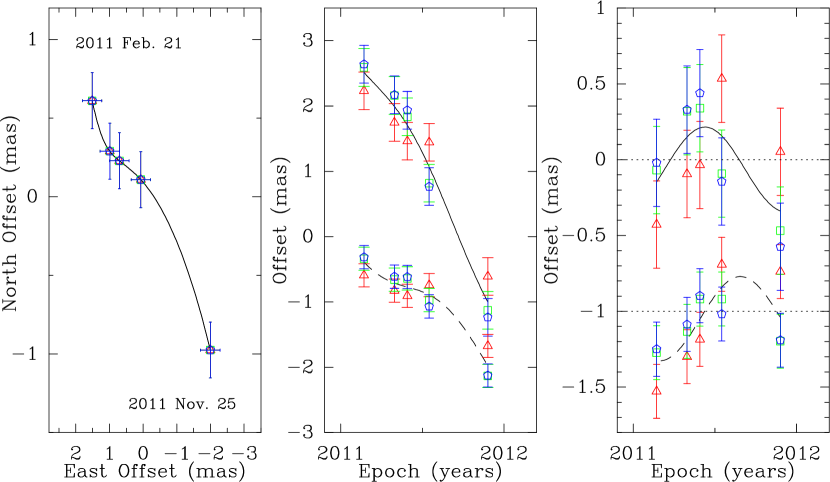
| G111.23–1.23 | (2010 Dec 10) | 2011 Feb 21 | 2011 Apr 30 | 2011 May 29 | 2011 Jul 17 | 2011 Nov 25 |
Note. — Column 1 lists the project code. Each project has three target sources, but Column 2 only lists the massive star forming regions reported in this paper. Each project was observed at 6 epochs, and the dates are shown in Columns 3 – 8. The dates in parentheses are observed, but not used for the parallax/proper motion fitting.
We performed multi-epoch observations with the VLBA under program BR145. We observed the 616–523 masing transition of H2O at a rest frequency of 22.23508 GHz toward 12 star forming regions in outer Galaxy. Three maser sources projected close to each other on the sky were observed in one group, each with 2 to 4 background quasars. We observed each group at 6 epochs spread over one year. The dates of the observations are listed in Table 1; they were optimized to allow an accurate parallax measurement for water masers lasting seven months or longer.
In order to measure trigonometric parallaxes, we used phase-referenced observations, switching (every 20–30 s) between the maser target and an extragalactic continuum source, selected from previously known calibrators from ICRF1 (Ma et al., 1998) and ICRF2333http://gemini.gsfc.nasa.gov/solutions/2010a/2010a.html lists or from our VLBA calibrator survey (Immer et al., 2011). The observed sources are listed in Table 2. Strong continuum sources were also observed to monitor delay and electronic phase differences among the recorded frequency bands. In order to calibrate atmospheric delays, we placed four 0.5-hr “geodetic blocks” (Reid et al., 2009a) spaced every two hours.
The data were correlated in two passes with the DiFX444This work made use of the Swinburne University of Technology software correlator, developed as part of the Australian Major National Research Facilities Programme and operated under license. software correlator (Deller et al., 2007) in Socorro, NM. Four dual-circularly polarized frequency bands of 8 MHz bandwidth were processed with 16 spectral channels for each frequency band. The one dual-polarized band that included the maser emission was re-processed with 256 channels, giving a velocity channel spacing of 0.42 km s-1. The data reduction was performed with the NRAO Astronomical Image Processing System (AIPS) package and ParselTongue scripts (Kettenis et al., 2006) following the procedure described in Reid et al. (2009a).
| Source | R.A. (J2000) | Decl. (J2000) | P.A. | |
|---|---|---|---|---|
| (h m s) | (∘ ’ ”) | (∘) | (∘) | |
| G094.60–1.79 | 21:39:58.2701 | +50:14:20.994 | – | – |
| J2137+5101 | 21:37:00.9862 | +51:01:36.129 | 0.9 | –31 |
| J2150+5103 | 21:50:14.2662 | +51:03:32.264 | 1.8 | +63 |
| J2145+5147 | 21:45:07.6666 | +51:47:02.243 | 1.7 | +28 |
| G095.29–0.93 | 21:39:40.5089 | +51:20:32.808 | – | – |
| J2137+5101 | 21:37:00.9862 | +51:01:36.129 | 0.5 | –127 |
| J2150+5103 | 21:50:14.2662 | +51:03:32.264 | 1.7 | +100 |
| J2145+5147 | 21:45:07.6666 | +51:47:02.243 | 1.0 | +62 |
| J2139+5300 | 21:39:53.6244 | +53:00:16.599 | 1.7 | +1 |
| G100.37-3.57 | 22:16:10.3651 | +52:21:34.113 | – | – |
| J2217+5202 | 22:17:54.4607 | +52:02:51.370 | 0.4 | +140 |
| J2209+5158 | 22:09:21.4869 | +51:58:01.833 | 1.1 | –111 |
| G108.20+0.58 | 22:49:31.4775 | +59:55:42.006 | – | – |
| J2243+6055 | 22:43:00.8093 | +60:55:44.199 | 1.3 | –39 |
| J2254+6209 | 22:54:25.2930 | +62:09:38.725 | 2.3 | +15 |
| J2257+5720 | 22:57:22.0461 | +57:20:30.197 | 2.8 | +158 |
| G108.47–2.81 | 23:02:32.0813 | +56:57:51.356 | – | – |
| J2301+5706 | 23:01:26.6266 | +57:06:25.508 | 0.2 | –46 |
| J2258+5719 | 22:58:57.9412 | +57:19:06.463 | 0.6 | –54 |
| J2257+5720 | 22:57:22.0461 | +57:20:30.197 | 0.8 | –62 |
| G108.59+0.49 | 22:52:38.3150 | +60:00:51.888 | – | – |
| J2243+6055 | 22:43:00.8130 | +60:55:44.212 | 1.5 | –52 |
| J2254+6209 | 22:54:25.2930 | +62:09:38.725 | 2.2 | +6 |
| J2301+5706 | 23:01:26.6266 | +57:06:25.508 | 3.1 | +158 |
| J2258+5719 | 22:58:57.9412 | +57:19:06.463 | 2.8 | +163 |
| G111.23-1.23 | 23:17:20.7888 | +59:28:46.970 | – | – |
| J2339+6010 | 23:39:21.1252 | +60:10:11.850 | 2.9 | +76 |
| J2258+5719 | 22:58:57.9412 | +57:19:06.463 | 3.2 | –132 |
| J2257+5720 | 22:57:22.0460 | +57:20:30.196 | 3.4 | –129 |
| J2254+6209 | 22:54:25.2926 | +62:09:38.724 | 3.9 | –46 |
| G111.25–0.77 | 23:16:10.3555 | +59:55:28.527 | – | – |
| J2339+6010 | 23:39:21.1251 | +60:10:11.850 | 2.9 | +85 |
| J2254+6209 | 22:54:25.2930 | +62:09:38.725 | 3.5 | –50 |
| J2258+5719 | 22:58:57.9412 | +57:19:06.463 | 3.4 | –139 |
| G183.72-3.66 | 05:40:24.2276 | +23:50:54.728 | – | – |
| J0540+2507 | 05:40:14.3428 | +25:07:55.349 | 1.3 | –2 |
| J0550+2326 | 05:50:47.3909 | +23:26:48.177 | 2.4 | +100 |
| G229.57+0.15 | 07:23:01.7718 | –14:41:34.339 | – | – |
| J0721–1530 | 07:21:13.4914 | –15:30:41.009 | 0.9 | –152 |
| J0724–1545 | 07:24:59.0063 | –15:45:29.370 | 1.2 | +156 |
| J0729–1320 | 07:29:17.8177 | –13:20:02.272 | 2.0 | +48 |
| J0721–1630 | 07:21:49.1377 | –16:30:19.746 | 1.8 | –171 |
| G236.81+1.98 | 07:44:28.2367 | –20:08:30.606 | – | – |
| J0741–1937 | 07:41:52.7874 | –19:37:34.828 | 0.8 | –50 |
| J0745–1828 | 07:45:19.3291 | –18:28:24.799 | 1.7 | +7 |
| J0735–1735 | 07:35:45.8125 | –17:35:48.501 | 3.3 | –39 |
| J0739–2301 | 07:39:24.9981 | –23:01:31.885 | 3.1 | –158 |
| G240.31+0.07 | 07:44:51.9676 | –24:07:42.372 | – | – |
| J0745–2451 | 07:45:10.2645 | –24:51:43.770 | 0.7 | +175 |
| J0749–2344 | 07:49:51.7793 | –23:44:48.788 | 1.2 | +72 |
| J0740–2444 | 07:40:14.7167 | –24:44:36.684 | 1.2 | –120 |
Note. — Column 1 gives the names of the maser and background sources. Columns 2 and 3 list the absolute positions of the reference maser spot and background sources. Columns 4 and 5 give the angular separations () and position angles (P.A.) east of north of the background sources relative to maser sources.
3 RESULTS
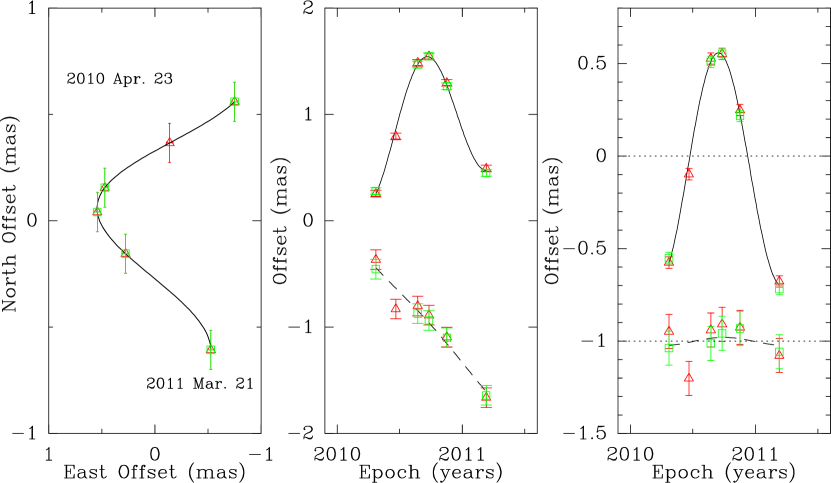
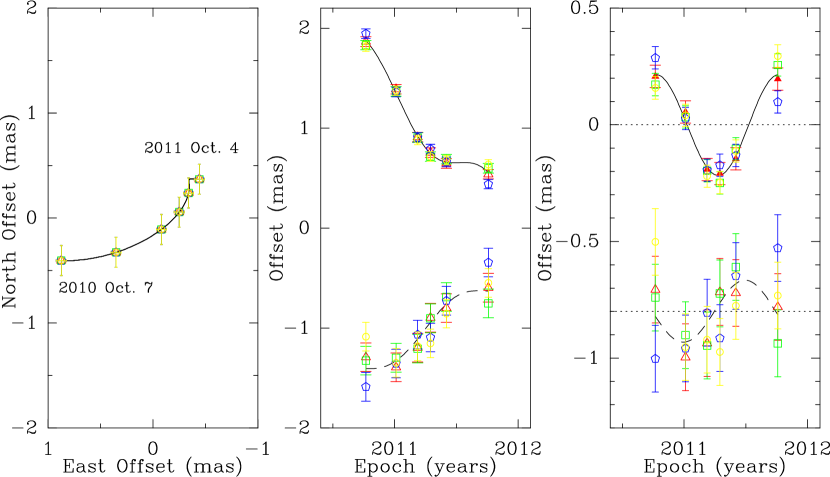
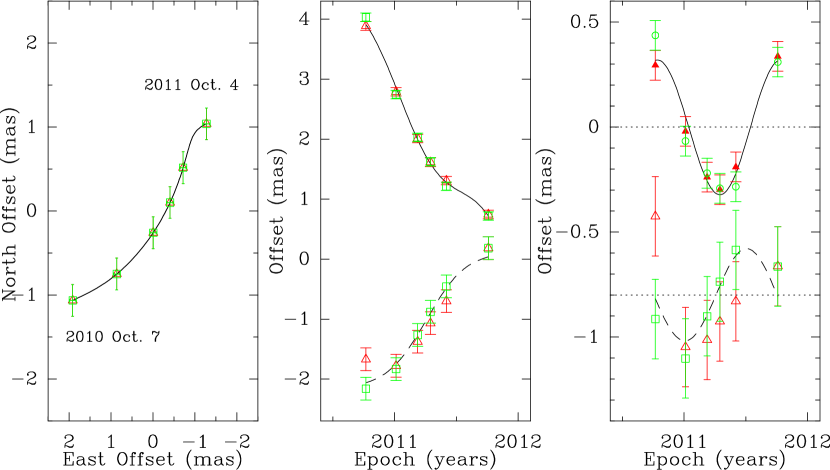
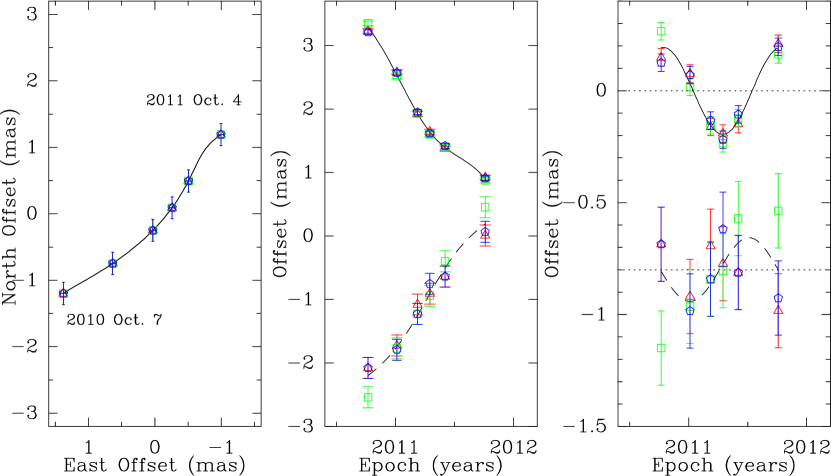
In this section we present parallaxes and proper motions of 22 GHz H2O masers for 12 massive star forming regions. The change in position of a maser spot relative to a background source is modeled with a sinusoidal parallax signature and a linear proper motion in right ascension and declination. Since systematic errors, associated with uncompensated atmospheric delays, generally exceed those of random noise, we added “error-floors” in quadrature to the formal position uncertainties in both coordinates. The error-floor values were determined by requiring the reduced of the post-fit residuals to be near unity in each coordinate (Reid et al., 2009a).
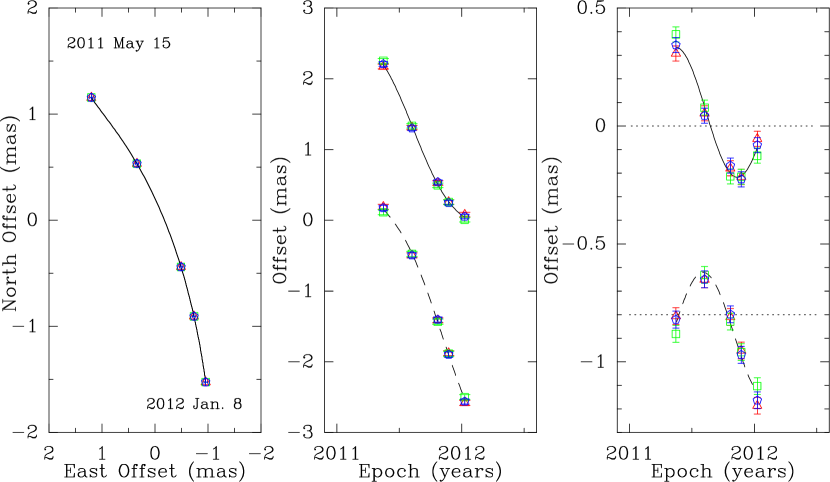
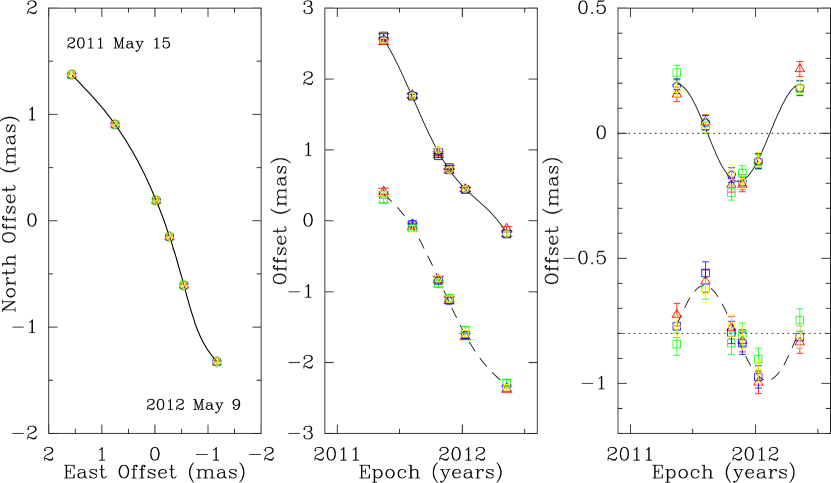
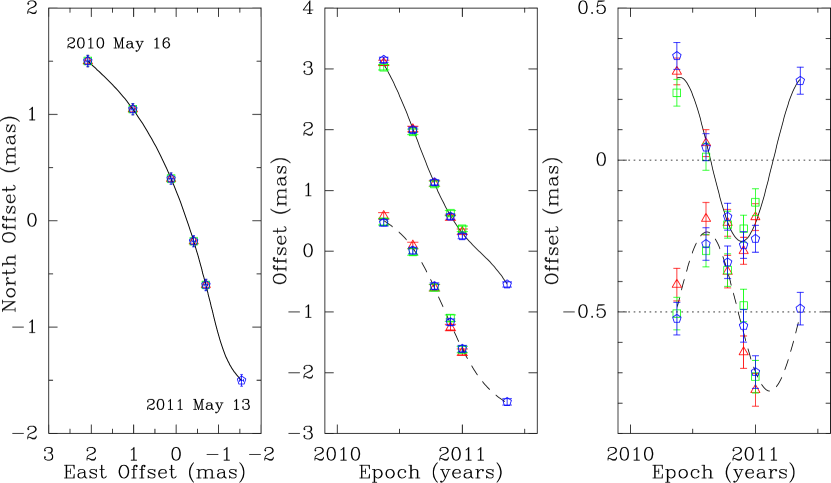
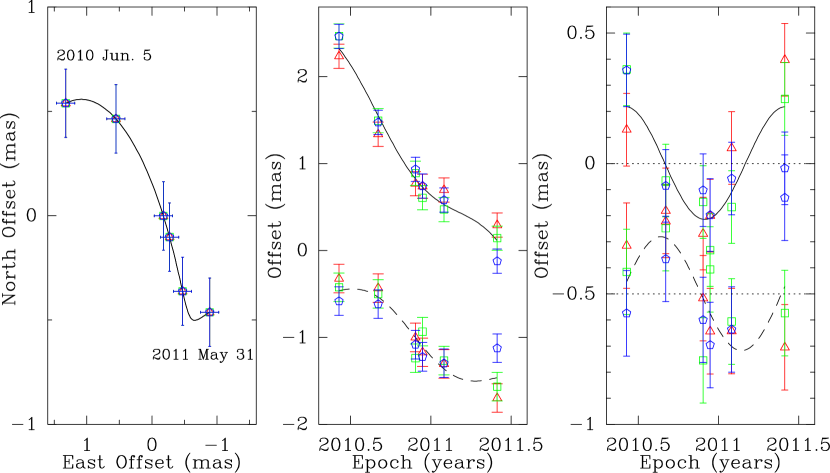
A bright H2O maser spot was used as the phase reference in order to calibrate the continuum source data and then measure position offsets used for parallax and proper motion fitting. When we estimated a parallax using several maser spots in one source, the quoted parallax uncertainty is the formal fitting uncertainty multiplied by (where is the number of maser spots) in order to account for possible correlations among the position measurements for the maser spots. Figures 1–12 show positions for the maser spots relative to the background sources as a function of time and the parallax and proper motions fits. The fitting results are summarized in Table 3. Detailed information for each source is presented in the Appendix.
| Source | Parallax | Distance | |||
|---|---|---|---|---|---|
| (mas) | (kpc) | (mas yr-1) | (mas yr-1) | (km s-1) | |
| G094.60–1.79 | 0.253 0.024 | 3.95 | –2.59 0.24 | –4.02 0.34 | –49 5 |
| G095.29–0.93 | 0.206 0.007 | 4.85 | –2.75 0.20 | –2.76 0.20 | –38 5 |
| G100.37–3.57 | 0.289 0.016 | 3.46 | –3.66 0.60 | –3.02 0.60 | –37 10 |
| G108.20+0.58 | 0.227 0.037 | 4.41 | –2.25 0.50 | –1.00 0.50 | –49 5 |
| G108.47–2.81 | 0.309 0.010 | 3.24 | –3.13 0.49 | –2.79 0.46 | –54 5 |
| G108.59+0.49 | 0.405 0.033 | 2.47 | –5.56 0.40 | –3.40 0.40 | –52 5 |
| G111.23–1.23 | 0.300 0.081 | 3.33 | –4.37 0.60 | –2.38 0.60 | –53 10 |
| G111.25–0.77 | 0.299 0.022 | 3.34 | –2.02 0.52 | –2.31 0.52 | –43 5 |
| G183.72–3.66 | 0.629 0.012 | 1.59 | +0.38 1.30 | –1.32 1.30 | +3 5 |
| G229.57+0.15 | 0.218 0.012 | 4.59 | –1.33 0.70 | +0.77 0.70 | +47 10 |
| G236.81+1.98 | 0.326 0.026 | 3.07 | –2.49 0.43 | +2.67 0.41 | +43 7 |
| G240.31+0.07 | 0.188 0.016 | 5.32 | –2.43 0.20 | +2.49 0.20 | +67 5 |
Note. — Column 1 lists source names. Columns 2 and 3 give the measured parallax and the distance converted from the parallax. Columns 4 and 5 are proper motions in the eastward (=) and northward (=) directions. Column 6 lists of the star forming region.
When there were numerous maser spots, we attempted to fit an expanding model to the internal (relative) motions (as in G108.47–2.81, G111.25–0.77, and G236.81+1.98) in order to estimate the motion of the central, exciting star directly. Details of this model fitting procedure are in Sato et al. (2010).
For sources with few maser spots, the proper motion for the central star was estimated from an unweighted average of all the measured absolute proper motions. For these cases, since water maser motions relative to the central star typically are tens of km s-1, we adopted a 5 to 15 km s-1 uncertainty for each velocity component, converted to an angular motion with the measured distance. Several criteria were used to estimate the uncertainties in the motion components of the central star, depending on the complexity and width of the maser spectrum (as an indication of the likely outflow speed) and the difference between the water maser values and the thermal CO value (also an indication of the magnitude and likelihood of un-modeled outflow issues). While km s-1 was used as the additional uncertainty for the components of motion for G095.29–0.93, G108.59+0.49, and G240.31+0.07, km s-1 was used for G094.60–1.79, G100.37–3.57, G108.20+0.58, G111.23–1.23, and G183.72–3.66, and km s-1 was used for G229.57+0.15.
4 The Perseus Arm
4.1 Location and Pitch Angle
The maser sources were assigned to the Perseus arm based on matching their longitudes and velocities to a prominent “track” in the longitude–velocity () space of CO emission that is generally associated with this arm. Note, that we did not use our parallax measurements to assign sources to the arm. This removes a potential selection bias for defining the arm and its properties. We plot these sources on a CO diagram from Dame et al. (2001) in Figure 13.
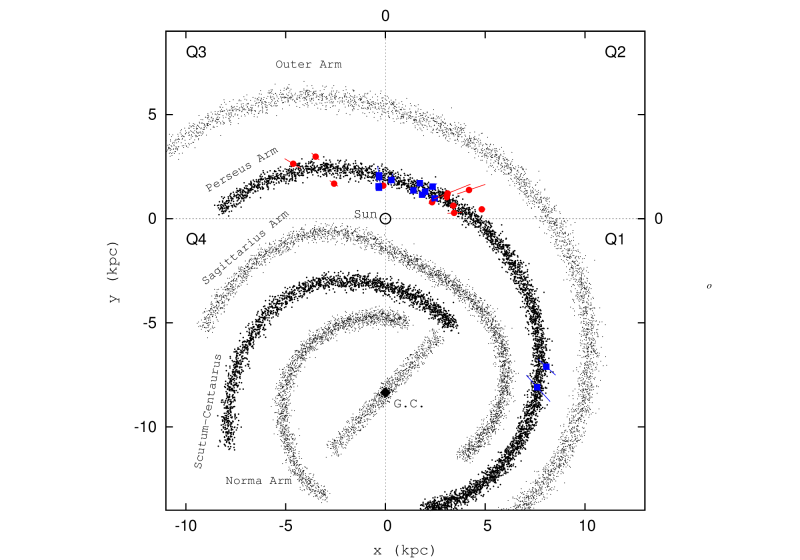
With trigonometric parallax measurements, we can accurately locate the massive star forming regions of the Perseus arm of the Milky Way. Assuming the distance to the Galactic center to be 8.34 kpc (Reid et al., 2014), Figure 14 shows the locations of our sources in the Milky Way as red circles, together with previous results from the literature as blue squares.
For simplicity, we assume that a section of a spiral arm follows a log-periodic function:
where and are Galactocentric radius and azimuth, respectively, is the radius at a reference azimuth , and is the spiral pitch angle (i.e., the angle between a spiral arm and a tangent to a Galactocentric circle). Galactocentric azimuth is defined as the angle between the Sun and the source as viewed from the center, with azimuth increasing with Galactic longitude in the first quadrant. We estimated two parameters, and using a Bayesian approach, which minimized the “distance” from the straight line described by Equation (1), variance weighted by the uncertainty in this direction, and described in detail in Reid et al. (2014).
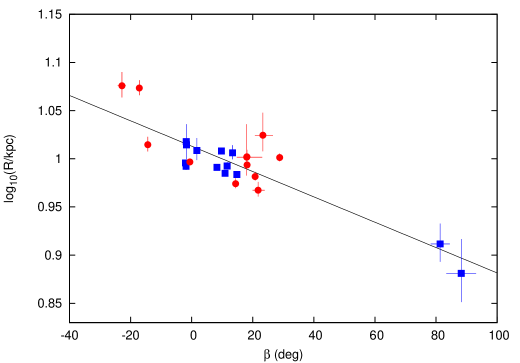
Using the 25 sources with parallax measurement that are assigned to the Perseus arm (based on matching to CO tracks), we estimate the arm pitch angle to be 9∘.9 1∘.5, with an arm width of 0.38 kpc, where = 2.29 0.01 at = 13∘.6 (uncertainties give 68% confidence ranges). The arm width was estimated by adding an “astrophysical noise” term, reflecting a non-zero arm width, in quadrature with measurement uncertainty when fitting for the pitch angle. The magnitude of this noise term was adjusted to give a per degree of freedom of unity for the residuals. In Figure 15, we plot the data and fitted line whose slope is tan.
Pitch angles for the Perseus spiral arm have previously been estimated by Reid et al. (2009b) and Sakai et al. (2012). Reid et al. (2009b) reported a value of based on data from 4 sources and Sakai et al. (2012) reported from 8 sources. Both used a least-squares fitting approach that minimized the residuals in the “y-axis” () only. Since distance uncertainties affect both axes in Equation (1), i.e., and , a better approach is to minimize the residuals perpendicular to the best fit line. As a test, we refit the data used by Reid et al. (2009b) with our improved Bayesian approach and obtained an estimated pitch angle of . This gives a similar pitch angle as the previous estimate, but with a larger and more realistic uncertainty. With this uncertainty, the old result is statistically consistent with the new result. Of course the new result benefits from using a much larger sample and should be preferred.
Based on the spiral pattern fit results, we obtain a distance between the Sun and the Perseus spiral arm of 2.0 0.2 kpc in the anticenter direction ( = 180∘, = 0∘). Since the Sagittarius arm is located at 1.4 0.2 kpc from the Sun (Wu et al., 2014), the Perseus arm is more distant from the Sun than the Sagittarius arm.
4.2 Peculiar Motions
Using the parallax distances to convert proper motions to linear speeds and combining with Doppler radial velocities, we can calculate the three-dimensional space motions for the massive star forming regions in the Perseus spiral arm. Assuming = 8.33 0.16 kpc, = 243 6 km s-1, dT/dR = –0.2 0.4 km s-1 kpc-1 and Solar Motion components of = 10.7 1.8 km s-1, = 12.2 2.0 km s-1 and = 8.7 0.9 km s-1 from B1 model in Reid et al. (2014) which used as a strong prior the Schnrich et al. (2010) Solar Motion, we calculate the peculiar motion components (Us, Vs, Ws) of the sources. Us is toward the Galactic center, Vs is in direction of Galactic rotation, and Ws is toward the north Galactic pole. The estimated peculiar motions for the sources are listed in Table 4.
The variance-weighted average of the peculiar motion components for 25 sources in the Perseus arm are km s-1 toward the Galactic center, km s-1 in the direction of Galactic rotation, and km s-1 toward the north Galactic pole. For the comparison, when we assume = 8.34 0.16 kpc, = 240 8 km s-1, dT/dR = –0.2 0.4 km s-1 kpc-1 and Solar Motion components of = 10.7 1.8 km s-1, = 15.6 6.8 km s-1 and = 8.9 0.9 km s-1 from A5 model in Reid et al. (2014), we obtained km s-1, km s-1, and km s-1. The average peculiar motion in the direction of Galactic rotation is affected by the component of solar motion.
These peculiar motion values indicate that on average sources in the Perseus arm are moving toward the Galactic center and move slower than for circular Galactic orbits. Compared with the average peculiar motions of the 100 sources with parallaxes in many arms, ( km s-1 and km s-1 from B1 model, Reid et al. (2014)), the Perseus arm sources have higher average peculiar motions and it seems to be a characteristic of the arm at least in the second and third quadrants.
The general claim of the spiral density wave theory in literature from 1960s is that peculiar motions should be toward the Galactic center and counter to the Galactic rotation. Our result is consistent with that claim.
As for kinematic distances, indeed, the peculiar motions affect them. As shown in Table 5, the standard kinematic distance, which do not consider the average peculiar motions of sources (i.e., = = = 0 km s-1), are biased higher than the true (parallax) values in the second quadrant. The “revised kinematic distances” (Reid et al., 2009b) using the average peculiar motion of the Perseus arm ( = 9.2 km s-1, = –8.0 km s-1, and = –2.3 km s-1) have better agreement with the distance from the parallax than the standard kinematic distance in the second quadrant. In the third quadrants, revised kinematic distances may be somewhat biased toward larger distances compared to parallax values. This portion of the Perseus arm may have a smaller peculiar motion than the average for all sources. Therefore, when calculating (revised) kinematic distances, for Perseus arm sources in the third quadrant, one should probably use 2 km s-1. Clearly, more parallax/proper motion measurements are needed to better understand average peculiar motions along the Perseus arm.
| Source | Alias | Us | Vs | Ws | Ref. |
|---|---|---|---|---|---|
| (km s-1) | (km s-1) | (km s-1) | |||
| G043.16+0.01 | W49(N) | –7.6 11.6 | –17.1 15.2 | 11.7 10.4 | 14 |
| G048.60+0.02 | –8.0 9.9 | 9.1 12.5 | 7.1 6.7 | 14 | |
| G094.60–1.79 | AFGL 2789 | 4.4 9.7 | –25.6 7.5 | –11.2 10.3 | 1, 7 |
| G095.29–0.93 | –10.3 6.2 | –7.0 5.6 | 3.7 4.7 | 1 | |
| G100.37–3.57 | 11.7 10.3 | –3.1 10.5 | 4.3 9.9 | 1 | |
| G108.20+0.58 | –12.7 11.0 | –15.2 10.3 | 10.7 11.0 | 1 | |
| G108.47–2.81 | 19.1 7.2 | –13.1 6.5 | –7.6 7.2 | 1 | |
| G108.59+0.49 | 45.1 5.6 | –4.6 7.0 | 1.1 4.9 | 1 | |
| G111.23–1.23 | 31.7 10.7 | 3.4 25.8 | –0.6 11.6 | 1 | |
| G111.25–0.77 | –1.7 8.0 | –11.0 7.2 | –13.3 8.5 | 1 | |
| G111.54–0.77 | NGC 7538 | 17.1 4.7 | –23.9 5.1 | –9.4 3.3 | 5 |
| G122.01–7.08 | IRAS 00420+5530 | 29.5 5.7 | –6.1 5.7 | 3.9 5.2 | 4 |
| G123.06–6.30 | NGC 281 | 5.4 7.5 | 8.0 7.7 | –15.9 9.9 | 11 |
| G123.06–6.30 | NGC 281 (W) | 6.8 4.1 | 4.1 4.0 | –7.3 3.5 | 9 |
| G133.94+1.06 | W3(OH) | 20.2 3.7 | –12.0 3.7 | 2.5 3.1 | 3, 13 |
| G134.62–2.19 | S Per | 2.6 5.3 | –13.9 4.8 | –4.4 4.0 | 2 |
| G170.66–0.24 | IRAS 05168+3634 | 11.1 5.6 | –12.7 8.9 | –5.6 9.9 | 10 |
| G183.72–3.66 | –0.6 5.4 | 1.7 9.3 | 5.0 9.1 | 1 | |
| G188.79+1.03 | IRAS 06061+2151 | 14.7 5.8 | –20.8 10.1 | –10.1 7.3 | 6 |
| G188.94+0.88 | S 252 | 0.5 5.3 | –8.0 3.7 | –0.6 3.1 | 8 |
| G192.16–3.81 | 3.2 5.3 | –4.8 6.4 | 5.4 5.8 | 12 | |
| G192.60–0.04 | S 255 | 1.6 5.7 | 3.5 12.4 | 4.7 8.1 | 9 |
| G229.57+0.15 | 15.1 12.2 | –12.7 14.3 | –8.7 15.3 | 1 | |
| G236.81+1.98 | –9.2 7.1 | 1.2 7.6 | –4.4 7.1 | 1 | |
| G240.31+0.07 | –10.5 6.1 | 4.3 8.6 | –12.9 5.5 | 1 | |
| Average | 9.2 1.2 | –8.0 1.3 | –2.3 1.1 |
Note. — We assumed = 8.33 0.16 kpc, = 243 6 km s-1, dT/dR = –0.2 0.4 km s-1 kpc-1 and Solar Motion components of = 10.7 1.8 km s-1, = 12.2 2.0 km s-1 and = 8.7 0.9 km s-1 from B1 model in Reid et al. (2014) to determine the peculiar motions (Us, Vs, Ws) in Columns 3–5. Us is the motion toward the Galactic center, Vs is in direction of Galactic motion, and Ws is toward the North Galactic Pole (NGP). Column 5 indicates references. (1) This paper; (2) Asaki et al. (2010); (3) Hachisuka et al. (2009); (4) Moellenbrock et al. (2009); (5) Moscadelli et al. (2009); (6) Niinuma et al. (2011); (7) Oh et al. (2010); (8) Reid et al. (2009a); (9) Rygl et al. (2010); (10) Sakai et al. (2012); (11) Sato et al. (2008); (12) Shiozaki et al. (2011); (13) Xu et al. (2006); (14) Zhang et al. (2013)
| Source | Dπ | D | D |
|---|---|---|---|
| (kpc) | (kpc) | (kpc) | |
| W49(N) | 11.11 | 11.61 | 10.85 |
| G048.60+0.02 | 10.75 | 9.95 | 9.17 |
| G094.60–1.79 | 3.95 | 5.65 | 4.62 |
| G095.29–0.93 | 4.85 | 4.86 | 3.84 |
| G100.37–3.57 | 3.46 | 4.23 | 3.23 |
| G108.20+0.58 | 4.41 | 4.65 | 3.62 |
| G108.47–2.81 | 3.24 | 5.08 | 4.04 |
| G108.59+0.49 | 2.47 | 4.90 | 3.85 |
| G111.23–1.23 | 3.33 | 4.84 | 3.79 |
| G111.25–0.77 | 3.34 | 3.96 | 2.96 |
| NGC 7538 | 2.65 | 5.19 | 4.10 |
| IRAS 00420+5530 | 2.17 | 4.22 | 3.18 |
| NGC 281 | 2.82 | 2.49 | 1.57 |
| NGC 281(W) | 2.38 | 2.41 | 1.50 |
| W3(OH) | 1.95 | 4.13 | 2.93 |
| S Per | 2.42 | 3.34 | 2.24 |
| IRAS 05168+3634 | 1.88 | 8.45 | 2.77 |
| G183.72–3.66 | 1.59 | 1.72 | 22.48 |
| IRAS 06061+2151 | 2.02 | 0.00 | 0.76 |
| S 252 | 2.10 | 2.27 | 6.47 |
| G192.60–0.04 | 1.52 | 0.95 | 2.80 |
| S 255 | 1.59 | 1.13 | 3.03 |
| G229.57+0.15 | 4.59 | 3.97 | 4.30 |
| G236.81+1.98 | 3.07 | 3.56 | 3.74 |
| G240.31+0.07 | 5.32 | 5.92 | 6.24 |
Note. — Column 1 lists source names. Dπ is the distance converted from the measured parallax. D is the kinematic distance without considering the average peculiar motions. D is the revised kinematic distance using = 9.2 km s-1, = –8.0 km s-1, and = –2.3 km s-1. The kinematic distances are calculated for = 8.33 kpc, = 243 km s-1, dT/dR = –0.2 km s-1 kpc-1 and Solar Motion components of = 10.7 km s-1, = 12.2 km s-1 and = 8.7 km s-1 from B1 model in Reid et al. (2014). When we determine the uncertainties in the kinematic distances, we considered a 7 km s-1 uncertainty in . Kinematic distances for sources near the Galactic anticenter intrinsically have large uncertainties and, thus, kinematic distances should be avoided for these sources.
5 CONCLUSION
We measured parallaxes and proper motions of 12 massive star forming regions in the outer portion of the Perseus arm in the second and third Galactic quadrants. Combined with 14 results from the literature, we estimated the pitch angle of this section of the Perseus arm to be 9∘.9 1∘.5. We also calculated the three-dimensional Galactic motions and find that on average the sources in the Perseus arm are moving toward the Galactic center and slower than the circular Galactic rotation.
Appendix A APPENDIX
We present details of parallax and proper motion fits for each source. Tables 6–17 summarize the results. The uncertainties of parallaxes and proper motions in the tables are the formal fitting uncertainties.
G094.60–1.79 is also known as AFGL 2789, and its parallax was measured to be 0.326 0.031 mas, corresponding to a distance of 3.07 0.30 kpc, with VERA (Oh et al., 2010). The proper motions were also obtained to be –2.1 0.2 mas yr-1 and –3.6 0.5 mas yr-1 in right ascension and declination, respectively (Oh et al., 2010). Since the H2O masers were not detected at our last (sixth) epoch in our observations, we used only 5 epochs with 7 maser spots and 3 background sources for the fitting. When we calculated the peculiar motion in Table 4, we used an unweighted average of our measurements and Oh et al. (2010) for the parallax and proper motion, yielding a parallax of 0.29 0.03 and a proper motion of –2.3 0.6 mas yr-1 in right ascension and –3.8 0.6 mas yr-1 in declination. The LSR velocity measured from CO emission is –43 km s-1 and –49 km s-1 from water maser emission. We adopted –46.0 5.0 km s-1 for the .
| Maser | Background | Parallax | |||
|---|---|---|---|---|---|
| Source | (km s-1) | (mas) | (mas yr-1) | (mas yr-1) | |
| G094.60–1.79 | J2137+5101 | –43.78 | 0.293 0.055 | –2.86 0.18 | –4.04 0.17 |
| J2150+5103 | –43.78 | 0.362 0.015 | –2.88 0.05 | –3.74 0.26 | |
| J2145+5147 | –43.78 | 0.281 0.058 | –2.97 0.20 | –4.02 0.18 | |
| J2137+5101 | –45.89 | 0.298 0.026 | –2.54 0.08 | –3.73 0.11 | |
| J2150+5103 | –45.89 | 0.298 0.004 | –2.75 0.04 | –3.55 0.01 | |
| J2145+5147 | –45.89 | 0.286 0.033 | –2.65 0.12 | –3.71 0.10 | |
| J2137+5101 | –46.31 | 0.291 0.037 | –2.49 0.12 | –3.84 0.12 | |
| J2150+5103 | –46.31 | 0.289 0.011 | –2.71 0.07 | –3.67 0.03 | |
| J2145+5147 | –46.31 | 0.279 0.034 | –2.60 0.14 | –3.83 0.09 | |
| J2137+5101 | –46.73 | 0.265 0.028 | –2.56 0.12 | –4.04 0.07 | |
| J2150+5103 | –46.73 | 0.276 0.022 | –2.75 0.10 | –3.85 0.06 | |
| J2145+5147 | –46.73 | 0.260 0.025 | –2.66 0.13 | –4.02 0.06 | |
| J2137+5101 | –52.21 | 0.230 0.021 | –2.19 0.06 | –4.22 0.20 | |
| J2150+5103 | –52.21 | 0.221 0.038 | –2.43 0.12 | –4.06 0.27 | |
| J2145+5147 | –52.21 | 0.218 0.008 | –2.30 0.03 | –4.21 0.19 | |
| J2137+5101 | –52.63 | 0.190 0.018 | –2.29 0.05 | –4.29 0.16 | |
| J2150+5103 | –52.63 | 0.184 0.045 | –2.52 0.14 | –4.12 0.24 | |
| J2145+5147 | –52.63 | 0.175 0.009 | –2.41 0.03 | –4.28 0.15 | |
| J2137+5101 | –53.05 | 0.217 0.021 | –2.24 0.06 | –4.31 0.19 | |
| J2150+5103 | –53.05 | 0.213 0.055 | –2.47 0.17 | –4.14 0.27 | |
| J2145+5147 | –53.05 | 0.204 0.028 | –2.36 0.09 | –4.30 0.18 | |
| Combined fit | 0.253 0.009 | ||||
| –48.66 | –2.59 0.05 | –4.02 0.04 |
G095.29–0.93 is associated with an infrared source, 2MASX J21394111+5120356, and its radial velocity is –42.4 km s-1 from CS(2–1) emission (Bronfman et al., 1996), –36.5 km s-1 from CO emission and –41 km s-1 from the water maser spectrum. We adopted –38.0 5.0 km s-1 for the . The parallax and proper motions are obtained from 3 maser spots and 4 background sources.
| Maser | Background | Parallax | |||
|---|---|---|---|---|---|
| Source | (km s-1) | (mas) | (mas yr-1) | (mas yr-1) | |
| G095.29–0.93 | J2137+5101 | –35.25 | 0.231 0.010 | –2.65 0.03 | –2.82 0.07 |
| J2150+5103 | –35.25 | 0.223 0.021 | –2.78 0.06 | –2.60 0.11 | |
| J2145+5147 | –35.25 | 0.209 0.005 | –2.75 0.01 | –2.78 0.07 | |
| J2139+5300 | –35.25 | 0.202 0.007 | –2.73 0.02 | –2.75 0.08 | |
| J2137+5101 | –35.67 | 0.216 0.013 | –2.70 0.04 | –2.81 0.04 | |
| J2150+5103 | –35.67 | 0.214 0.019 | –2.83 0.05 | –2.59 0.09 | |
| J2145+5147 | –35.67 | 0.200 0.008 | –2.80 0.02 | –2.77 0.05 | |
| J2139+5300 | –35.67 | 0.190 0.008 | –2.78 0.02 | –2.74 0.04 | |
| J2137+5101 | –36.10 | 0.211 0.020 | –2.67 0.05 | –2.89 0.09 | |
| J2150+5103 | –36.10 | 0.210 0.009 | –2.80 0.02 | –2.67 0.12 | |
| J2145+5147 | –36.10 | 0.191 0.018 | –2.77 0.05 | –2.85 0.08 | |
| J2139+5300 | –36.10 | 0.180 0.019 | –2.76 0.05 | –2.82 0.08 | |
| Combined fit | 0.206 0.004 | ||||
| –35.67 | –2.75 0.01 | –2.76 0.02 |
G100.37–3.57 is associated with the HII region CPM 37 (IRAS22142+5206). H2O maser emission was observed between –50 and –15 km s-1, and it is highly variable over the observation period. The radial velocity is –36.5 km s-1 from CO emission. We adopted –37.0 10.0 km s-1 for .
| Maser | Background | Parallax | |||
| Source | (km s-1) | (mas) | (mas yr-1) | (mas yr-1) | |
| G100.37–3.57 | J2217+5202 | –38.37 | 0.304 0.016 | –3.73 0.05 | –2.95 0.04 |
| J2209+5158 | –38.37 | 0.303 0.045 | –3.42 0.15 | –2.90 0.16 | |
| J2209+5158 | –38.37 | 0.310 0.015 | –3.63 0.07 | –3.24 0.04 | |
| Combined fit | 0.289 0.016 | ||||
| –38.37 | –3.66 0.05 | –3.02 0.05 |
G108.20+0.58 has a radial velocity of –49.2 km s-1 from CS(2–1) emission (Bronfman et al., 1996). The parallax is measured using 2 maser spots and 3 background sources. We used –49.0 5.0 km s-1 for .
| Maser | Background | Parallax | |||
|---|---|---|---|---|---|
| Source | (km s-1) | (mas) | (mas yr-1) | (mas yr-1) | |
| G108.20+0.58 | J2243+6055 | –53.74 | 0.222 0.046 | –1.87 0.15 | –1.36 0.11 |
| J2254+6209 | –53.74 | 0.285 0.049 | –2.33 0.13 | –1.05 0.27 | |
| J2257+5720 | –53.74 | 0.196 0.054 | –2.52 0.15 | –0.58 0.19 | |
| J2243+6055 | –54.16 | 0.218 0.038 | –1.88 0.12 | –1.35 0.11 | |
| J2254+6209 | –54.16 | 0.267 0.057 | –2.34 0.15 | –1.06 0.27 | |
| J2257+5720 | –54.16 | 0.175 0.050 | –2.54 0.14 | –0.58 0.20 | |
| Combined fit | 0.227 0.026 | ||||
| –53.95 | –2.25 0.07 | –1.00 0.09 |
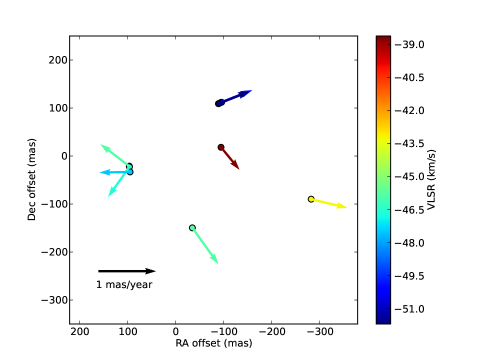
G108.47–2.81 is associated with IRAS 23004+5642. We used 6 maser spots and 3 background sources to fit parallax and proper motions. The radial velocity is –54 km s-1 from CO emission, and we used this value to obtain the peculiar motions. We fitted the data of the relative motions with respect to the reference maser spot ( = –65.48 km s-1) to expansion model (Sato et al., 2010). The expansion velocity is 3.4 7.4 km s-1 and the center of expansion is (0.00 0.28, 0.03 0.17) arcsec. The velocity components are (, , ) = (–14.1 7.6, 2.2 7.0, –59.3 3.5) km s-1. These values correspond to = –0.92 0.49 mas yr-1 and = 0.14 0.46 mas yr-1 at the distance of 3.24 kpc. Adding these motions to the absolute motion of the reference maser spot, we obtained an absolute proper motion of the central star to be = –3.13 0.49 mas yr-1 and = –2.79 0.46 mas yr-1. Figure 16 shows spatial distribution and relative motions with respect to the center of the expansion of water masers toward G108.47–2.81.
| Maser | Background | Parallax | |||
|---|---|---|---|---|---|
| Source | (km s-1) | (mas) | (mas yr-1) | (mas yr-1) | |
| G108.47–2.81 | J2301+5706 | –54.52 | 0.310 0.010 | –3.28 0.03 | –3.28 0.06 |
| J2258+5719 | –54.52 | 0.306 0.004 | –3.15 0.01 | –3.34 0.03 | |
| J2257+5720 | –54.52 | 0.328 0.010 | –3.23 0.03 | –3.30 0.05 | |
| J2301+5706 | –54.52 | 0.286 0.019 | –1.73 0.05 | –2.67 0.09 | |
| J2258+5719 | –54.52 | 0.283 0.022 | –1.60 0.06 | –2.72 0.11 | |
| J2257+5720 | –54.52 | 0.304 0.021 | –1.68 0.06 | –2.69 0.11 | |
| J2301+5706 | –54.94 | 0.300 0.016 | –3.24 0.04 | –3.33 0.06 | |
| J2258+5719 | –54.94 | 0.296 0.010 | –3.10 0.03 | –3.39 0.03 | |
| J2257+5720 | –54.94 | 0.316 0.016 | –3.18 0.04 | –3.35 0.06 | |
| J2301+5706 | –54.94 | 0.292 0.015 | –1.77 0.04 | –2.66 0.09 | |
| J2258+5719 | –54.94 | 0.289 0.016 | –1.64 0.04 | –2.72 0.11 | |
| J2257+5720 | –54.94 | 0.310 0.018 | –1.72 0.05 | –2.68 0.10 | |
| J2301+5706 | –55.37 | 0.312 0.008 | –1.79 0.02 | –2.68 0.11 | |
| J2258+5719 | –55.37 | 0.308 0.010 | –1.66 0.02 | –2.74 0.14 | |
| J2257+5720 | –55.37 | 0.331 0.010 | –1.74 0.03 | –2.70 0.12 | |
| J2301+5706 | –55.79 | 0.335 0.006 | –1.80 0.02 | –2.73 0.14 | |
| J2258+5719 | –55.79 | 0.331 0.006 | –1.67 0.02 | –2.79 0.16 | |
| J2257+5720 | –55.79 | 0.354 0.007 | –1.75 0.02 | –2.75 0.15 | |
| Combined fit | 0.309 0.004 | ||||
| –55.01 | –2.21 0.08 | –2.93 0.04 |

G108.59+0.49 is associated with IRAS 22506+5944 and its radial velocity is measured to be –52 km s-1 from CO emission. We fitted parallax and proper motions using 2 maser spots and 4 background sources.
| Maser | Background | Parallax | |||
|---|---|---|---|---|---|
| Source | (km s-1) | (mas) | (mas yr-1) | (mas yr-1) | |
| G108.59+0.49 | J2243+6055 | –53.47 | 0.273 0.017 | –5.45 0.44 | –3.25 0.03 |
| J2254+6209 | –53.47 | 0.420 0.059 | –5.39 0.17 | –3.68 0.20 | |
| J2301+5706 | –53.47 | 0.336 0.039 | –5.73 0.10 | –3.19 0.26 | |
| J2258+5719 | –53.47 | 0.315 0.027 | –5.69 0.07 | –3.25 0.31 | |
| J2243+6055 | –53.89 | 0.494 0.090 | –5.44 0.25 | –3.42 0.32 | |
| J2254+6209 | –53.89 | 0.449 0.065 | –5.36 0.17 | –3.72 0.30 | |
| J2301+5706 | –53.89 | 0.354 0.031 | –5.69 0.08 | –3.23 0.33 | |
| J2258+5719 | –53.89 | 0.335 0.025 | –5.66 0.06 | –3.29 0.35 | |
| Combined fit | 0.405 0.023 | ||||
| –53.68 | –5.56 0.06 | –3.40 0.08 |
G111.23–1.23 is associated with IRAS 23151+5912 and its radial velocity is –54.4 km s-1 from CS(2–1) emission (Bronfman et al., 1996). We observed 4 background sources, but J2257+5720 was discarded from the parallax fitting since the structure of the quasar changed over time. We used 2 maser spots and 3 quasars to fit parallax and proper motions.
| Maser | Background | Parallax | |||
|---|---|---|---|---|---|
| Source | (km s-1) | (mas) | (mas yr-1) | (mas yr-1) | |
| G111.23–1.23 | J2339+6010 | –49.94 | 0.348 0.087 | –3.28 0.48 | –1.80 0.20 |
| J2258+5719 | –49.94 | 0.308 0.084 | –4.78 0.36 | –2.80 0.20 | |
| J2254+6209 | –49.94 | 0.262 0.115 | –5.06 0.46 | –2.80 0.29 | |
| J2339+6010 | –50.37 | 0.339 0.083 | –3.26 0.48 | –1.64 0.19 | |
| J2258+5719 | –50.37 | 0.301 0.086 | –4.76 0.36 | –2.63 0.21 | |
| J2254+6209 | –50.37 | 0.257 0.119 | –5.04 0.47 | –2.64 0.30 | |
| Combined fit | 0.300 0.057 | ||||
| –50.16 | –4.37 0.21 | –2.38 0.15 |
G111.25–0.77 is associated with IRAS 23139+5939 and its = –43 km s-1 from CO emission. We observed 3 background sources. However, we did not use J2254+6209 for the parallax fitting, since it was not detected at the first and sixth epoch. We obtained parallax and proper motions from 4 maser spots and 2 background sources. We fitted the data of the relative motions with respect to the reference maser spot ( = –51.26 km s-1) to expansion model (Sato et al., 2010). The expansion velocity is 2.6 8.1 km s-1 and the center of expansion is (0.09 0.50, –0.11 0.35) arcsec. The velocity components are (, , ) = (8.3 8.2, –3.3 8.2, –42.7 4.0) km s-1. These values correspond to = 0.52 0.52 mas yr-1 and = –0.21 0.52 mas yr-1 at the distance of 3.34 kpc. Adding these motions to the absolute motion of the reference maser spot, we obtained an absolute proper motion of the central star to be = –2.02 0.52 mas yr-1 and = –2.31 0.52 mas yr-1. Figure 17 shows spatial distribution and relative motions with respect to the center of the expansion of water masers toward G111.25–0.77.
| Maser | Background | Parallax | |||
|---|---|---|---|---|---|
| Source | (km s-1) | (mas) | (mas yr-1) | (mas yr-1) | |
| G111.25–0.77 | J2339+6010 | –39.05 | 0.303 0.018 | –3.09 0.04 | –1.96 0.13 |
| J2258+5719 | –39.05 | 0.326 0.024 | –2.81 0.07 | –2.44 0.06 | |
| J2339+6010 | –46.63 | 0.293 0.018 | –3.22 0.05 | –2.27 0.10 | |
| J2258+5719 | –46.63 | 0.310 0.024 | –2.94 0.06 | –2.76 0.11 | |
| J2339+6010 | –47.89 | 0.287 0.021 | –2.17 0.06 | –1.61 0.13 | |
| J2258+5719 | –47.89 | 0.309 0.022 | –1.89 0.07 | –2.09 0.06 | |
| J2339+6010 | –48.31 | 0.287 0.022 | –2.23 0.06 | –1.57 0.11 | |
| J2258+5719 | –48.31 | 0.309 0.020 | –1.94 0.06 | –2.06 0.08 | |
| Combined fit | 0.299 0.011 | ||||
| –45.47 | –2.54 0.08 | –2.10 0.07 |
G183.72–3.66 has a parallax of 0.629 0.012 mas based on measurements of two background sources. The from CO emission is 2.5 km s-1. The H2O masers are variable over our observations. Since most of maser spots disappeared at the 3rd epoch and only 2 spots survived for more than 2 epochs, we could not get internal motions.
| Maser | Background | Parallax | |||
| Source | (km s-1) | (mas) | (mas yr-1) | (mas yr-1) | |
| G183.72–3.66 | J0540+2507 | 4.58 | 0.632 0.020 | 0.43 0.05 | –1.32 0.20 |
| J0550+2326 | 4.58 | 0.627 0.004 | 0.32 0.01 | –1.32 0.08 | |
| Combined fit | 0.629 0.012 | ||||
| 4.58 | 0.38 0.03 | –1.32 0.10 |
G229.57+0.15 is associated with IRAS 07207–1435. The H2O maser emission ranges from 45 km s-1 to 60 km s-1 with a predominantly double-peak spectrum. The radial velocity is 43 km s-1 from CO emission. We adopted 47 10 km s-1 for . We measured parallax and proper motions from one maser spot detected at all epochs and 4 background sources. Because of the source’s low declination, the error in right ascension is much smaller than that in declination.
| Maser | Background | Parallax | |||
| Source | (km s-1) | (mas) | (mas yr-1) | (mas yr-1) | |
| G229.57+0.15 | J0721–1530 | 57.11 | 0.214 0.012 | –1.35 0.03 | 0.74 0.13 |
| J0724–1545 | 57.11 | 0.228 0.015 | –1.25 0.04 | 0.62 0.12 | |
| J0729–1320 | 57.11 | 0.193 0.017 | –1.49 0.05 | 1.19 0.15 | |
| J0721–1630 | 57.11 | 0.239 0.017 | –1.21 0.05 | 0.55 0.28 | |
| Combined fit | 0.218 0.012 | ||||
| 57.11 | –1.33 0.03 | 0.77 0.10 |
G236.81+1.98 is associated with IRAS 07422–2001 and its radial velocity is 43 km s-1 from CO emission. Four background sources were observed, but two of them (J0735–1735 and J0739–2301) were not used for the parallax fitting. J0735–1735 and J0739–2301 are separated by about 3 degrees from the maser source and mostly in the north-south direction. J0735–1735 has structure, which is likely caused by atmospheric distortion and J0739–2301 was not detected after the third epoch. Because of the source’s low declination, the error in right ascension is much smaller than that in declination.
We fitted the data of the relative motions with respect to the reference maser spot ( = 42.31 km s-1) to expansion model (Sato et al., 2010). The expansion velocity is 0.5 10.1 km s-1 and the center of expansion is ( 0.05 0.76, 0.03 0.85) arcsec. The velocity components are (, , ) = (10.5 6.3, 8.2 6.0, 48.5 5.9) km s-1. These values correspond to = 0.72 0.43 mas yr-1 and = 0.56 0.41 mas yr-1 at the distance of 3.07 kpc. Adding these motions to the absolute motion of the reference maser spot, we obtained an absolute proper motion of the central star to be = –2.49 0.43 mas yr-1 and = 2.67 0.41 mas yr-1. Fig. 18 shows spatial distribution and relative motions with respect to the center of the expansion of water masers toward G236.81+1.98.
| Maser | Background | Parallax | |||
| Source | (km s-1) | (mas) | (mas yr-1) | (mas yr-1) | |
| G236.81+1.98 | J0741–1937 | 42.31 | 0.310 0.018 | –3.14 0.05 | 1.87 0.36 |
| J0745–1828 | 42.31 | 0.335 0.024 | –3.29 0.13 | 2.35 0.03 | |
| Combined fit | 0.326 0.026 | ||||
| 42.31 | –3.21 0.07 | 2.11 0.18 |

G240.31+0.07 is associated with 2MASS J07445196–2407399 and its is 67.0 km s-1 obtained from CO emission. The parallax was measured using 3 maser spots and 3 background sources. Because of the source’s low declination, the error in right ascension is much smaller than that in declination.
| Maser | Background | Parallax | |||
|---|---|---|---|---|---|
| Source | (km s-1) | (mas) | (mas yr-1) | (mas yr-1) | |
| G240.31+0.07 | J0745–2451 | 67.95 | 0.194 0.019 | –2.38 0.05 | 2.47 0.24 |
| J0749–2344 | 67.95 | 0.152 0.018 | –2.65 0.05 | 3.13 0.14 | |
| J0740–2444 | 67.95 | 0.227 0.066 | –2.22 0.21 | 2.14 0.30 | |
| J0745–2451 | 67.53 | 0.195 0.018 | –2.36 0.05 | 2.08 0.14 | |
| J0749–2344 | 67.53 | 0.210 0.017 | –2.47 0.04 | 2.95 0.12 | |
| J0740–2444 | 67.53 | 0.183 0.021 | –2.35 0.06 | 2.19 0.16 | |
| J0745–2451 | 67.11 | 0.190 0.016 | –2.42 0.04 | 2.16 0.16 | |
| J0749–2344 | 67.11 | 0.180 0.017 | –2.58 0.05 | 3.15 0.13 | |
| J0740–2444 | 67.11 | 0.218 0.022 | –2.27 0.06 | 1.90 0.27 | |
| Combined fit | 0.188 0.009 | ||||
| 67.53 | –2.43 0.02 | 2.49 0.09 |
References
- Asaki et al. (2010) Asaki, Y., Deguchi, S., Imai, H., et al. 2010, ApJ, 721, 267
- Benjamin et al. (2005) Benjamin, R. A., Churchwell, E., Babler, B. L., et al. 2005, ApJ, 630, L149
- Bronfman et al. (1996) Bronfman, L., Nyman, L. -A., & May J. 1996, A&AS, 115, 81
- Churchwell et al. (2009) Churchwell, E., Babler, B. L., Meade, M. R., et al. 2009, PASP, 121, 213
- Dame et al. (2001) Dame, T. M., Hartmann, D., & Thaddeus, P. 2001, ApJ, 547, 792
- Deller et al. (2007) Deller, A. T., Tingay, S. J., Bailes, M., & West, C. 2007, PASP, 119, 318
- Hachisuka et al. (2009) Hachisuka, K., Brunthaler, A., Menten, K. M., et al. 2009, ApJ, 696, 1981
- Honma et al. (2012) Honma, M., Nagayama, T., Ando, K., et al. 2012, PASJ, 64, 136
- Immer et al. (2011) Immer, K., Brunthaler, A., Reid, M. J., et al. 2011, ApJS, 194, 25
- Kettenis et al. (2006) Kettenis, M., van Langevelde, H. J., Reynolds, C., & Cotton, B. 2006, in Astronomical Society of the Pacific Conference Series, Vol. 351, Astronomical Data Analysis Software and Systems XV, ed. C. Gabriel, C. Arviset, D. Ponz, & S. Enrique, 497
- Ma et al. (1998) Ma, C., Arias, E. F., Eubanks, T. M., et al. 1998, AJ, 116, 516
- Moellenbrock et al. (2009) Moellenbrock, G. A., Claussen, M. J., & Goss, W. M. 2009, ApJ, 694, 192
- Moscadelli et al. (2009) Moscadelli, L., Reid, M. J., Menten, K. M., et al. 2009, ApJ, 693, 406
- Niinuma et al. (2011) Niinuma, K., Nagayama, T., Hirota, T., et al. 2011, PASJ, 63, 9
- Oh et al. (2010) Oh, C. S., Kobayashi, H., Honma, M., et al. 2010, PASJ, 62, 101
- Reid et al. (2009a) Reid, M. J., Menten, K. M., Brunthaler, A., et al. 2009a, ApJ, 693, 397
- Reid et al. (2009b) Reid, M. J., Menten, K. M., Zheng, X. W., et al. 2009b, ApJ, 700, 137
- Reid et al. (2014) Reid, M. J., Menten, K. M., Brunthaler, A., et al. 2014, ApJ, 783, 130
- Rygl et al. (2010) Rygl, K. L. J., Brunthaler, A., Reid, M. J., et al. 2010, A&A, 511, 2
- Sakai et al. (2012) Sakai, N., Honma, M., Nakanishi, H., et al. 2012, PASJ, 64, 108
- Sato et al. (2008) Sato, M., Hirota, T., Honma, M., et al. 2008, PASJ, 60, 975
- Sato et al. (2010) Sato, M., Reid, M. J., Brunthaler, A., & Menten, K. M. 2010, ApJ, 720, 1055
- Schnrich et al. (2010) Schnrich, R., Binney, J., & Dehnen, W. 2010, MNRAS, 403, 1829
- Shiozaki et al. (2011) Shiozaki, S., Imai, H., Tafoya, D., et al. 2011, PASJ, 63, 1219
- Tayler & Cordes (1993) Taylor, J. H., & Cordes, J. M. 1993, ApJ, 411, 674
- Valle (2008) Valle, J. P. 2008, AJ, 135, 1301
- Wu et al. (2014) Wu, Y. W., Sato, M., Reid, M. J., et al. 2014, A&A, 566, A17
- Xu et al. (2006) Xu, Y., Reid, M. J., Zheng, X. W. & Menten, K. M. 2006, Science, 311, 54
- Zhang et al. (2013) Zhang, B., Reid, M. J., Menten, K. M., et al. 2013, ApJ, 775, 79