Accretion and Evolution of M⊕ Planets with Voluminous H/He Envelopes
Abstract
Formation of planets in the Neptune size range with low-mass, but voluminous, H2/He gaseous envelopes is modeled by detailed numerical simulations according to the core-nucleated accretion scenario. Formation locations ranging from 0.5 to 4 AU from a star of 1 M⊙ are considered. The final planets have heavy-element cores of 2.2– 2.5 M⊕ and envelopes in the range 0.037–0.16 M⊕. After the formation process, which lasts 2 Myr or less, the planets evolve at constant mass up to an age of several Gyr. For assumed equilibrium temperatures of 250, 500, and 1000 K, their calculated final radii are compared with those observed by the Kepler spacecraft. For the particular case of Kepler-11 f, we address the question whether it could have formed in situ or whether migration from a formation location farther out in the disk is required.
1 Introduction
The analysis of the first 22 months of Kepler data shows over 2700 planetary candidates detected through transit observations (Batalha et al., 2013; Burke et al., 2014), most of which orbit within 0.5 AU of their star. Many of these planets have radii of 2–6 R⊕, which is roughly the Neptune size range, but most seem to be sub-Neptune in terms of mass. A small fraction of the Kepler planets also have mass determinations. For example, transit timing variations in the Kepler-11 system yield masses between 1.9 and 8.0 M⊕ for radii between 1.8 and 4.2 R⊕ (Lissauer et al., 2013). A radial velocity survey (Marcy et al., 2014) provides additional masses. Wu & Lithwick (2013) analyzed about 30 planets, combining their statistical data from transit timing variations with radial velocity data from other sources to estimate a mass-radius relation in the mass range 2–25 M⊕. They find MR with considerable scatter, in constrast to the more standard relation often used to derive masses from transit radii: MR, based on planets in the solar system of Saturn mass or less (Lissauer et al., 2011b). Again, many of the Wu & Lithwick objects fall into the “sub-Neptune” class. Weiss & Marcy (2014) find a mass-radius fit for planets with radii between 1.5 and 4 R⊕, using data largely independent of those of Wu & Lithwick (2013): MR. Weiss et al. (2013) include the stellar flux at the planet () in the mass-radius relation and find a somewhat different relation, for planet masses less than 150 M⊕: , where is in units of erg s-1 cm-2 and radii and masses are in Earth units. A list of all explanets with measured masses and radii (as of early 2013) is found in Weiss et al. (2013); a list of such planets with radii less than 4 R⊕ (as of early 2014) is in Weiss & Marcy (2014), and one for planets of less than 100 M⊕ (as of late 2013) appears in Lopez & Fortney (2013).
Given the density, from the mass and radius measurements, planets with masses in the range 1–10 M⊕ can be separated into three groups. The higher-density group, with mean density g cm-3, must have a “rocky” composition almost entirely of heavy elements. The low-density planets ( g cm-3) also have a substantial fraction of their mass in a heavy-element core of rock and (possibly) ice, but must also have a significant fraction of their volumes occupied by light gasses. Intermediate-density planets can either have their volumes containing substantial amounts of rock and of H/He, or can be composed mostly of water and/or other astrophysical ices. This paper focusses on the low-density group.
Model calculations of the thermal evolution of sub-Neptune type planets, up to ages of 5 Gyr (Lopez & Fortney, 2013) show, however, very little dependence of radius on mass for a given H/He mass fraction and given incident stellar flux. The radius decreases slowly with age after 1 Gyr, and the radius at 5 Gyr is practically independent of mass in the range 1–20 M⊕. The radius at that time is very weakly dependent on stellar flux, but increases markedly with H/He mass fraction. These authors therefore interpret the observed trend of increased radius with mass as primarily a composition effect, that is, on the average the higher mass planets have higher H/He mass fraction and therefore larger radii.
This paper investigates the origin and evolution of such objects. The main issue is whether they formed in situ or whether they formed at much larger distances, say 4–6 AU, and then, or during the formation process, migrated inward to their present orbital positions. Regarding the Kepler-11 planets, Lissauer et al. (2011a) question whether migration was involved because it would be expected to result in mean-motion resonances in multiplanet systems, which are not observed in this particular system. However, later studies of dynamical and dissipative effects (Rein, 2012; Goldreich & Schlichting, 2014) show that in fact such planets can migrate though resonances, thereby alleviating the constraint. Also, thermal evolution calculations for such planets (Lopez et al., 2012), coupled with mass loss, indicate that in situ formation is not likely and that the planets probably formed beyond the snow line, with a substantial water component. This conclusion is based on models of Ikoma & Hori (2012) of the accretion of gas onto already-formed rocky cores in the inner disk. The mass loss calculations imply an inconsistency for the Kepler-11 planets if they formed in situ: the original mass of their H/He envelopes would have been larger than the amount they could have accreted according to Ikoma & Hori (2012).
Theoretical work by Hansen & Murray (2012) on the formation of sub-Neptunes and super-Earths assumes that they form in situ but that much of the required solid material arrives by migration of rock-sized objects from larger distance. This process was originally investigated, in the context of hot Jupiters, by Ward (1997) and applied to the case of 51 Peg b by Bodenheimer et al. (2000). Hansen & Murray (2012) find that gas accretion onto rocky cores is likely to occur if the accumulated disk mass in solids inside 1 AU is greater than about 25 M⊕, which is about 8 times that in the minimum-mass solar nebula (MMSN). Chiang & Laughlin (2013) consider the formation of super-Earths in situ with no migration, based on a disk model that is somewhat enhanced in solid material with respect to the minimum-mass solar nebula (see also Hansen & Murray (2013)). Their rough estimates indicate that rocky planets in close orbits can capture and retain gaseous envelopes of a few percent to tens of percent of the planet’s mass.
Ikoma & Hori (2012) do in situ calculations, from the full stellar structure equations, of the accretion of gas onto rocky cores in the inner disk during the dissipation phase of the gas disk. Parameters include the core mass , the disk temperature , and the characteristic disk dissipation time . Core masses range from 1 to 10 M⊕. Calculations end when the disk has completely dissipated. For example, for M⊕, K, and yr, the accumulated gas envelope mass is about M⊕ if core cooling is not considered, and is about M⊕ in the more realistic case when the cooling is included. The range of ratios of envelope mass to core mass is from 0.0002 to 0.1. Reasonably good agreement between these envelope masses and those deduced for the Kepler-11 planets (Lopez et al., 2012; Lissauer et al., 2013) can be obtained for Myr, but not for significantly shorter times.
In contrast, Rogers et al. (2011) calculate detailed core-accretion models for sub-Neptune objects forming at 4 AU and 5.2 AU, assuming that they later migrate to positions where the equilibrium temperature is 500 to 1000 K. After accretion ends, the planets, which have in the range 2.5–4 M⊕, are evolved up to ages of 4 Gyr. The full evolutionary calculations are supplemented with static core/envelope models that cover a wide range (1 to 20 M⊕) of planet masses and ratios . Theoretical radii at late times from these calculations agree, generally for , with those observed by Kepler. The present work extends these formation calculations to a range of distances from 0.5 AU to 4 AU and considers in further detail the question regarding how much gas can be accreted by heavy-element cores in the 2.2–2.5 M⊕ range, in the warm inner regions of the disk. The implications regarding formation in situ or formation accompanied by migration are then discussed.
2 Computational Method
The calculations for these low-mass planets, with final core masses of 2.2–2.5 M⊕, include two phases. The formation phase, starting with 1 M⊕, involves accretion of heavy-element “core” mass as well as gaseous envelope mass. The following evolutionary phase, starting at the end of accretion, involves contraction and cooling of the gaseous envelope, at constant mass and with the planet isolated from the disk, up to a final age of several Gyr. The computational method and physical assumptions are described in detail in previous publications (Pollack et al., 1996; Movshovitz et al., 2010; Rogers et al., 2011) and references therein. During the early part of the formation phase, the gaseous envelope has low mass, and the core fairly rapidly accretes to close to its final mass. The later parts of the formation phase are characterized by slow envelope accretion at practically constant . The core accretion rate is given by the standard equation (Safronov, 1969)
| (1) |
where is the effective geometrical capture radius for planetesimals, is the mass per unit area of solid material (planetesimals) in the disk, is the planet’s orbital frequency, and is the gravitational enhancement factor to the geometrical capture cross-section. The planetesimal radius is taken to be 100 km, and is taken from Greenzweig & Lissauer (1992). In fact, if a reasonable distribution of planetesimal sizes were taken into account, the formation time would be reduced. However, the large size partially compensates for the effect that the formation times based on Greenzweig & Lissauer (1992) are somewhat faster than those found in more detailed simulations, e. g., Inaba et al. (2003). In any case, the core grows rapidly in the inner region of a protoplanetary disk, and the precise value of the planetesimal size has little effect on the outcome. The surface density of planetesimals changes with time according to the prescription of Pollack et al. (1996), in which the accretion onto the protoplanet is taken into account, the feeding zone extends 4 Hill radii on either side of the planetary orbit, and is assumed to be uniform with radius within the feeding zone.
In general , the radius of the heavy-element core, unless the envelope mass is negligible. In our trajectory calculations, if the effects on a planetesimal of gas drag, ablation and fragmentation result in loss of over half of its mass before it hits the core or escapes, it is considered to have been captured by the envelope, and the amount of mass deposited in each layer is determined (Podolak et al., 1988). The effective determined in this way (see Pollack et al. (1996) for details) can be several times larger than . The dusty material deposited in the envelope enters into the opacity calculation (see below); it then is allowed to sink to the core. Thus the change in envelope composition caused by the deposition of solid material is not taken into account, although Hori & Ikoma (2011) show that an envelope enhanced in heavy elements can significantly increase the gas accretion rate at a given core mass and can reduce the critical core mass, that is, the mass required for rapid gas accretion to occur. However, Iaroslavitz & Podolak (2007) show that the organic and rock components of the planetesimals in fact do not dissolve in the envelope and do sink, thus our assumption is valid for most of our simulations, those inside the snow line (2 AU or less). Icy material however does dissolve, so that in our calculations at 4 AU the gas accretion rate may be affected, and the “core mass” is somewhat overestimated. What we call there actually is the mass of heavy elements in the planet, after subtraction of the heavy-element component of the nebular material accreted at the surface of the envelope.
The structure and evolution of the gaseous envelope is calculated according to the standard spherically symmetric equations of stellar structure (Kippenhahn & Weigert, 1990), augmented by the effects of the time-dependent , the accretion rate of the envelope, and the interactions of the incoming planetesimals with the envelope. The temperature gradient is assumed to be the adiabatic gradient in convection zones. The main energy sources are planetesimal accretion, and contraction and cooling of the gaseous envelope. In two cases, test runs were carried out including heating effects resulting from radioactive decay in the core and from cooling of the 2.2 M⊕ core (Nettelmann et al., 2011). The radioactive decay had practically no effect on the radius at 4 Gyr. The core heating is calculated, assuming an isothermal core, according to where is the luminosity delivered to the envelope by the cooling of the core, erg g-1 K-1 is the specific heat of the core, and is the temperature at the core/envelope interface. In agreement with Lopez & Fortney (2013), during the evolutionary (cooling) phase this luminosity can contribute 25% to 75% of the total internal luminosity, depending on the time, and it acts to lengthen the time to cool to a given radius. However, with or without this additional energy source, by the time the evolution reaches 4 Gyr, the radius is changing very slowly, so the inclusion of makes practically no difference on the final value. The test runs including the core heating resulted in increases in the final radius of less than 5%. On the other hand, during the accretion phase, first increases with time as core and envelope increase in mass, so the envelope actually delivers energy to the core. Later in the accretion phase decreases, and this energy is returned to the envelope. In any case, this luminosity is calculated to be only a few percent of the accretion luminosity and certainly has little effect on the radius or envelope mass at the end of accretion. Therefore, the results quoted here for final radii do not include these effects, as they fall below the overall level of uncertainty in the simulations. The full set of equations is solved by the Henyey method (Henyey et al., 1964).
The radius at the inner boundary of the envelope is set to , which is determined from its current mass. The core is composed either of iron and rock, with mass fractions 30% and 70%, respectively, or iron, rock, and ice, with mass fractions 10%, 23%, and 67%, respectively, depending on the formation location. Given , the radius is calculated from the equation of state of Seager et al. (2007), as summarized by Rogers et al. (2011). The equation of state in the H/He envelope is taken to be that given by Saumon, Chabrier, & van Horn (1995), which includes the partial degeneracy of the electrons as well as non-ideal effects in the gas. The chemical composition of the envelope is taken to be near-solar, with , and , where are, respectively, the mass fractions of H, He, and all remaining elements.
The main feature of the Rosseland mean opacity during the formation phase involves the use of dust grain opacities that take into account the settling and coagulation of the grains (Movshovitz et al., 2010). Dust grains enter the envelope through the ablation of planetesimals and are also carried in along with the accreting gas. The initial grain size is 0.1 m. Grains are assumed to be spherical and to lack void spaces. The grain growth and settling are calculated in detail as described in Movshovitz & Podolak (2008) and Movshovitz et al. (2010). Grain growth up to 2.58 mm in size is considered. The grain size distributions and the Rosseland mean opacities are recalculated in every layer at every time step. The grains are assumed to be composed of pure silicates, with a dust-to-gas ratio of 1:100 by mass within the gas that is accreted by the planet. At or interior to 2 AU, this approximation is reasonable; even at 4 AU the error introduced by this assumption is insignificant when one considers the uncertainties in grain shape, sticking probability in collisions, and radiative properties. The sticking probability is a parameter in the grain code, and it is set to unity in the present simulations. These opacities regulate the rate at which the envelope can contract, and therefore affect the gas accretion rate.
Above 3000 K, the opacities of Alexander & Ferguson (1994) are used. Between 3000 K and 1800 K, the Freedman et al. (2008) molecular opacities, which do not include dust grains, are used. Below 1800 K, the dust opacities of Movshovitz et al. (2010) are added to the molecular opacities. Once the planet has reached its final mass, as determined by the lifetime of the disk, the grains settle rapidly, evaporate in the interior, and are no longer a significant opacity source. For the final isolation phase at constant mass, the molecular/atomic opacities of Alexander & Ferguson (1994) and Freedman et al. (2008) are used, with solar composition.
The gas accretion rate is determined by the condition that the planet outer radius , where the effective accretion radius is given by (Lissauer et al., 2009)
| (2) |
Here is the sound speed in the disk, is the Hill sphere radius, and is the total mass of the planet. The constant is determined by three-dimensional numerical simulations of disk flow in the vicinity of an embedded planet (Lissauer et al., 2009). These simulations show that the planet does not retain gas from the entire Hill-sphere volume; rather, it can occupy a region with radius . Thus, if is small compared with the Bondi accretion radius , .
The surface boundary conditions depend on whether the planet is still accreting (the formation phase) or whether it is isolated (the evolutionary phase). During the formation phase the temperature is set to a constant value appropriate for the protoplanetary disk, (see Table 1). These temperatures correspond approximately to a ratio of sound speed to orbital speed of 0.05, except at 0.5 AU, where a slightly smaller ratio is taken. The density at the surface, , is determined initially from , where is the gas surface density, the scale height , and at 4 AU and 200 at 2, 1, and 0.5 AU ( is the distance of the planet from the star). In three of the runs, the disk lifetime is arbitrarily set to 2 Myr. The density is assumed to decline linearly with time up to 1.9 Myr; then it is cut off more rapidly, to near zero, on the time scale of 105 years. Three other runs have the disk cutoff time set to match a pre-chosen envelope mass. Here also the density drops rapidly during the 105 years just before cutoff. Envelope masses remain low in all calculated cases, so that the phase of rapid gas accretion associated with the growth of Jupiter-mass planets never occurs.
The isolation mass for the heavy-element planetary core, which in these simulations turns out to be close to the final core mass, is given by
| (3) |
where is the mass of the central star, and , the number of Hill-sphere radii defining the region, on each side of the planetary orbit, from which the object is able to capture planetesimals (Lissauer, 1987). Once , the slows down drastically, but gas accretion continues. In these low-mass models the crossover mass (when ) is never reached. Note that the calculation method implicitly assumes that the core mass will reach ; formation of multiple embryos in the vicinity of is not considered.
When the disk becomes very tenuous near the end of its lifetime, the planet makes a transition to isolated boundary conditions that take into account the radiation effect of the central star. Gas and solid accretion stop, and Equation (2) no longer applies. Then
| (4) |
where is the Stefan-Boltzmann constant, is the surface temperature, is the total luminosity which includes the internal luminosity from the planet and the re-radiated stellar input, and , , and are, respectively, the photospheric values of Rosseland mean opacity, pressure, and acceleration of gravity. The surface temperature is calculated from
| (5) |
where is determined by the internal luminosity and the outer radius of the planet (a generally small contribution), and , the equilibrium temperature of the planet in the radiation field of the star, is taken to be a parameter.
3 Calculations and Results
The main parameters that are varied from run to run are the formation position of the planet in the disk, the value of the initial solid surface density at that position, and the time for cutoff of gas accretion. The planet’s core mass is determined through the calculation itself; in fact it is practically fixed by the choice of and , which determine (Equation 3). is taken to be just above 2 M⊕, in order to provide a comparison with Kepler-11 f and other planets with core mass in that range. The formation process is assumed to take place at a fixed orbital radius. The initial value of the core mass is about 1 M⊕, and the starting time is arbitrarily set to yr, representing the approximate time to build this core at 5.2 AU with g cm-2 (Lissauer et al., 2009). Closer to the star this time will be shorter, but in these calculations the total time to build the core is short compared with the overall evolutionary time. After formation, the planet is assumed to take on three different insolation temperatures: 250 K, 500 K, and 1000 K. In most cases this assumption implies a modest amount of migration. (Inward migration, were it to occur during gas accretion, would have the effect of reducing the final , because of the gradual reduction in in the disk.) The radii at the end of a 4 Gyr constant-mass evolution are determined for each of these temperatures.
| Run | 4H | 4 | 2H | 2 | 1 | 0.5 |
| Distance from star (AU) | 4 | 4 | 2 | 2 | 1 | 0.5 |
| Disk temperature (K) | 126 | 126 | 310 | 310 | 650 | 927 |
| H2O in solid core | Y | Y | N | N | N | N |
| Disk solid (g cm-2) | 6 | 6 | 22 | 22 | 90 | 360 |
| MMSN solid (g cm-2) | 3.8 | 3.8 | 2.5 | 2.5 | 7.0 | 20 |
| Disk gas (g cm-2) | 420 | 420 | 4500 | 4500 | 18000 | 72000 |
| Accretion cutoff (Myr) | 0.64 | 0.49 | 2.0 | 0.42 | 2.0 | 2.0 |
| Final (M⊕) | 2.50 | 2.44 | 2.20 | 2.15 | 2.20 | 2.20 |
| Final (R⊕) | 1.65 | 1.64 | 1.22 | 1.21 | 1.22 | 1.22 |
| Final (M⊕) | 0.16 | 0.054 | 0.16 | 0.054 | 0.054 | 0.037 |
| 0.060 | 0.022 | 0.068 | 0.024 | 0.024 | 0.017 | |
| Radius (4,250) (R⊕) | 2.72 | 2.19 | 2.41 | 1.81 | 1.82 | 1.69 |
| Radius (4,500) (R⊕) | 3.24 | 2.64 | 2.88 | 2.19 | 2.19 | 1.89 |
| Radius (4,1000) (R⊕) | 6.18 | 4.51 | 5.79 | 3.91 | 3.94 | 3.13 |
The parameters and basic results for the runs are given in Table 1. The column headings in the table give the run identifiers; the six runs are labelled 4H, 4, 2H, 2, 1, and 0.5. The numeral gives the distance from a 1 M⊙ star in AU. The symbols 4H and 2H indicate that the final envelope mass has the higher value of 0.16 M⊕, while in Runs 4 and 2 accretion was terminated when the final reached the lower value 0.054 M⊕. The first seven rows below the run identifiers in the table give assumed parameters: , , core composition (Y indicates the presence of ice; N indicates no ice), , the corresponding in the MMSN, the initial gas surface density , and the assumed gas accretion cutoff time. Note that our assumed final core masses in the range 2 M⊕ require very high values of in the inner disk, as determined by Equation (3). The bottom seven rows give results: the final values of , , , the final ratio of to the total mass, and three final values of the radius , where the 4 refers to the final time of about 4 Gyr, and gives the assumed value of . These radii span the 1.7–6 R⊕ range that encompasses most of the planets observed by Kepler.
The results presented in Table 1 show that while the envelopes accreted by 2.2–2.5 M⊕ cores are of low mass, they occupy the majority of the planetary volume even after cooling for 4 Gyr at distances from their star where is only 250 K. For a given run, that is, for a given mass and time, planetary size increases modestly with , as also found by Lopez & Fortney (2013). For planets with the same and the same accretion cutoff time (Runs 0.5, 1, and 2H), the final increases with distance from the star, mainly as a result of the decreasing disk temperature and increasing and with distance. This result is at least qualitatively consistent with that of Ikoma & Hori (2012). Also, as previously emphasized by Lopez & Fortney (2013), there is a noticeable increase in radius, given , for increasing . Other differences are more subtle.
Runs 4H and 2H have the same value of , but at a given the 4H planets are larger. This result occurs because the core of Run 4H, which includes ice, is of lower density and larger size. Thus, despite the core being slightly more massive in Run 4H, the pressure at the base of the envelope is lower, leading to a lower density. For the K case, the pressures are and dyne cm-2, respectively, for 4H and 2H, and the corresponding densities are 0.17 and 0.23 g cm-3. The differences between Runs 4 and 2 are explained similarly. The differences in the final radii between Runs 1 and 2, which have the same , , and , are small. Despite differences in initial conditions, one would expect these two cases to converge to the same radii after 4 Gyr, because Kelvin-Helmholtz times for the envelopes are relatively short ( yr). The small differences (%) are well within the uncertainties of the simulation, which are % in the radius at K, % at K, and a few percent at K (Rogers et al., 2011). The uncertainty arises because molecular opacities (Freedman et al., 2008) have not been tabulated for some of the pressures encountered in the interior; they have to be extrapolated. The opacities determine the location of the boundary between the outer radiative zone and the inner convective zone, which has an effect on the radius. The uncertainties are systematic; thus the differences are smaller than the uncertainties.

The buildup of the mass during the formation phase for Runs 2H, 1, and 0.5 is shown in Figure 1. Note that the core mass is very close to its final value (2.2 M⊕) less than yr after the starting time, with the time required to reach 90% of the final core mass decreasing with decreasing distance from the star. Envelope masses increase on a time scale of 1 Myr; after that time the rate of increase is very slow. At the later times the addition of mass to the envelope is driven by a very slow contraction, since the value of is practically constant. Just before 2 Myr the values of are , , and M⊕ yr-1, respectively, for Runs 2H, 1, and 0.5. If the runs were to be continued for an additional Myr, the increases in in all cases and in for Runs 1 and 0.5 would be negligible. In Run 2H the envelope would be expected to accrete an additional M⊕.
The final increases with increasing distance from the star, a result of the increase in and . The factors that determine these masses are complex. It turns out that for these three cases, in each case and 0.25 agree to within about 20%. The values of are , , and cm, for Runs 0.5, 1, and 2H, respectively. The envelope masses are found to scale roughly as , where is the photospheric density (where the inward-integrated optical depth approaches unity) as determined from the detailed models at the time when the envelope has obtained most of its mass. Note that , which depends on the details of the run of opacities in the model, and which is a modestly decreasing function of distance from the star, is the appropriate scaling factor, not . The outer regions of the model, which have negligible mass and which are optically thin, are not important. For Runs 2H, 1, and 0.5 the final envelope masses are respectively 7%, 2.4%, and 1.7% of the total mass. The actual values of scale as 1: 0.34: 0.23 while the corresponding values of scale as 1: 0.32: 0.27.
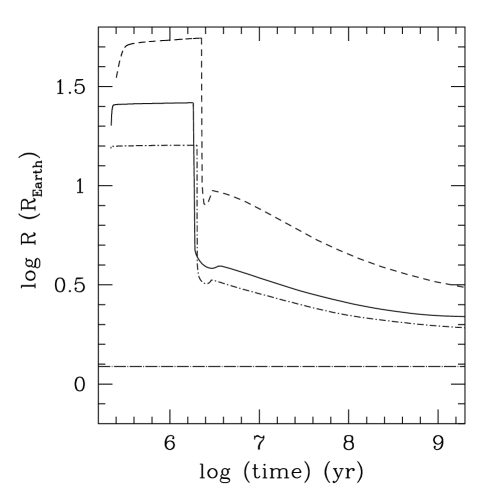
The radii as a function of time for the same three cases are shown in Figure 2. During the accretion phase, these radii fall just below , which is approximately constant once has approached its final value of 2.2 M⊕. At the age of 2 Myr, the disk dissipates and the radii fall rapidly as a result of the transition to isolated (irradiated photospheric) boundary conditions. During the evolution phase up to 4 Gyr, the radii decrease gradually to final values in the range 2–3 R⊕ for K. Run 2H ends up with a larger radius than in the other two cases because of its higher envelope mass.


The end of the formation phase and the entire constant-mass evolutionary phase of Runs 2H, 1, and 0.5 are illustrated in Figure 3, which gives the total luminosity as a function of time. The luminosity at the end of the formation phase is the intrinsic radiation from the planetary interior. After the time of 2 Myr the accretion ends and the objects make a transition to photospheric boundary conditions with insolation at K. The luminosity is then dominated by insolation effects. The higher luminosity in Run 2H as compared with the other cases is a result of its larger radius. Figure 4 shows a similar plot for the case of Run 1, with three different values of during the evolution phase. The separation of over an order of magnitude in luminosity between the curves represents the effect of as well as the increased radius as a function of .

Figure 5 compares Runs 1 and 2, which have the same final core masses and envelope masses, but were formed under different initial conditions. The accretion for Run 2 is cut off (bifurcated from Run 2H) at 0.42 Myr, because at that time its envelope mass matches that of Run 1. The figure shows the evolution of density and temperature , both evaluated at the base of the envelope. Initially, Run 1, at 1 AU, accretes core mass faster than does Run 2, at 2 AU. Therefore increases more rapidly in Run 1. Run 1 reaches a maximum K at yr, at which time the envelope mass is 0.016 M⊕. The slight secondary maximum in , where log , occurs when gas accretion cuts off at about 2 Myr. Beyond that point, the interior cools continuously. In Run 2, once the core mass has levelled off close to its final value, the central temperature catches up to that in Run 1 and reaches a slightly higher maximum of K, at a time of yr, just before the time of envelope accretion cutoff. The main reason for the more rapid temperature increase is that the envelope accretion rate in Run 2 is considerably faster than that in Run 1 because of the larger Bondi radius, leading to faster compression. After cutoff, the evolutionary track joins that for Run 1, and the two curves are practically identical after yr. These two curves were calculated with K, and both reached final radii of about 2.2 R⊕.
Runs 4H and 4 incorporate the effect of forming the planet beyond the snow line at 4 AU at a disk temperature of 126 K. The isolation mass is 2.42 M⊕ under these conditions, with a value of g cm-2, less than twice that in the MMSN. The core accretes to close to at an age just under 0.5 Myr. In Run 4H the gas accretion is cut off arbitrarily at 0.64 Myr with an M⊕ and a total mass of 2.66 M⊕. Had gas accretion been allowed to continue up to 2 Myr, as in Run 2H, the would have been 0.54 M⊕, as found by Rogers et al. (2011), not sufficient to reach rapid gas accretion. This value of is found again to scale as , where cm. In the case of Run 4, the gas accretion is cut off at 0.49 Myr, with M⊕ and a total mass of 2.494 M⊕. This envelope mass matches those in Runs 1 and 2. Run 4 has a slightly larger core mass than does Run 2, and this pair of runs have similar cutoff times and exactly the same envelope mass. The main difference between the two cases is that the core in Run 4 is 30% larger in radius, because it contains an ice component.
Figure 6 shows radii as a function of time for Runs 4H, 4, and 2, all with K. The initial increase in in Runs 4H and 4 corresponds to the growth of the core from 1 to 2.5 M⊕. At cutoff time the radii decrease rapidly during the transition to isolated boundary conditions. A small secondary maximum occurs just after 1 Myr as increases to 500 K. The difference in the final radii at 4 Gyr occurs because of the difference of a factor of 3 in . Run 2 has a smaller maximum value of than in the other cases because of the smaller values of and at its smaller distance. The noticeable difference in final radii between Runs 2 and 4 is a result of the differences in core radii, which influence the pressure and thus the density in the lower envelope, even though the core masses are about the same.

4 Comparison with Kepler-11 f
The transiting planet Kepler-11 f has a radius of 2.48 (+0.02,-0.03) R⊕, K, and the planet orbits at 0.25 AU from its solar-type star. The mass measured through transit timing variations is 2.0 (+0.8,-0.9) M⊕ (Lissauer et al., 2013), which allows it to be compared with our theoretical models. The age of Kepler-11 is estimated to be 8.5 (+1.1,–1.4) Gyr (Lissauer et al., 2013). Although the final radii from our models (Table 1) are given at 4 Gyr, the evolution to longer times shows a negligible decrease in radius between 4 and 8 Gyr, certainly within the overall uncertainty in the simulations.
Our results indicate that if the planet had formed at 1 AU its present radius would have been 2.19 R⊕; if it had formed at 0.5 AU, the radius would have been 1.89 R⊕. Thus, if it had formed in situ at 0.25 AU, the radius would have been even smaller. At that distance, it would not have been able to accrete enough gas to account for its present radius. Thus formation in situ is not likely unless, possibly, its mass came out to be close to the one-standard-deviation upper limit from the observations. It is true that the actual disk lifetime could be longer than the 2 Myr we have assumed. However, the envelope accretion rate at the end of the accretion phase for Run 0.5 was only M⊕ yr-1; thus even after an additional 5 Myr of disk lifetime the added envelope mass would have been at most 0.002 M⊕, implying a negligible increase in radius. The effect would be even smaller at 0.25 AU. Furthermore, formation at 0.25 AU would imply a nebular temperature of over 1000 K, where the value of is smaller than at 0.5 AU, and the required would have to be g cm-2, 25 times that in the MMSN, assuming that . We consider it more likely that the planet formed at a larger distance and then (or during formation) migrated inward. The actual formation location could be either inside or outside the ice line, depending on the specific parameters of the situation and the amount of mass loss sustained by the envelope after formation.
Arguments in favor of in situ formation of super-Earth type planets inside 0.5 AU are given by Chiang & Laughlin (2013). Their estimate of the required for the Kepler-11 system is of the same order as ours. Their estimate of the envelope mass that can be accreted by Kepler-11 f in situ, for M⊕, is , slightly higher than the value indicated by our more detailed simulations but still not quite sufficient to account for the observed radius. At M⊕, however, their estimate would be consistent with the observations.
Ikoma & Hori (2012) considered gas accretion onto the Kepler-11 planets in situ, although the rocky cores were assumed to have migrated inwards from their actual formation locations. For parameters similar to ours—namely M⊕, K, and enhanced by a factor of 10 relative to the minimum-mass disk—they find , assuming a characteristic disk dissipation time of yr. If is increased to 1 Myr, the value of goes up to about 0.003. Their results for the mass ratio are about 1 order of magnitude below ours. As a result of the low envelope masses, their models do not provide a satisfactory fit to Kepler-11 f. There are several differences in the assumptions in their calculations in comparison with ours. First, they assume that disk dissipation and envelope accretion are occurring simultaneously, while in our case most of the envelope accretion occurs prior to significant disk dissipation. Second, they include heat loss from the rocky core in the envelope calculation, which we do not consider. As mentioned above, their final envelope mass depends on whether or not core heating is included, and it depends on the details of disk dissipation, while in our case, because envelope accretion occurs much earlier, the core luminosity has little effect. Third, they do not include planetesimal accretion as an energy source in the envelope, an effect which we do include. Fourth, differences in the details of the assumed disk dissipation procedure could account for some of the differences in the results for the envelope mass. Fifth, except in one case they do not include dust grains in the calculation of the envelope opacity during the accretion phase.
Mass loss may have played a modest role in the post-formation evolution of Kepler-11 f. Estimates in the literature of mass loss rates are based on energy-limited hydrodynamic escape driven by stellar EUV and X-ray radiation (Murray-Clay et al., 2009). Deduced histories of stellar EUV and X-ray fluxes indicate that most of the mass loss occurs at ages Gyr (Ribas et al., 2005). Ikoma & Hori (2012) calculate a loss of 0.1 M⊕ for Kepler-11 f at its present orbit over its lifetime. However, they assume a value , where is the fraction of incident radiation that goes into driving mass loss. A more usual value of 0.1 (Lopez et al., 2012) would result in a loss of about 0.025 M⊕ from the envelope. In either case, the planet should have lost its entire envelope according to their in situ calculation. In the case of our estimated envelope mass at 0.25 AU, most or all of the envelope would have been lost.
Lopez et al. (2012) couple the mass loss calculation with post-formation thermal evolution for the Kepler-11 planets at their current stellar input flux levels. For Kepler-11 f, with an assumed rock/iron core and gaseous H/He envelope, and with the preliminary mass estimate of 2.3(+2.2, –1.2) M⊕, they conclude that the planet originally had roughly 30% of its mass in the H/He envelope, implying a mass loss of about 1 M⊕. A roughly similar result was obtained under the assumption that the planet’s core contained water along with the rock and iron. This amount of mass is clearly inconsistent with the envelope mass the planet could have accreted by formation at its current orbit. According to our models, in fact, a high envelope mass, for M⊕, is inconsistent with formation inside the snow line, out to 2 AU (Run 2H).
To estimate whether the formation of a planet with M⊕ and M⊕ is possible outside the snow line, we extend the Run IIa published by Rogers et al. (2011). This run places the forming planet at 4 AU with a solid surface density of 6 g cm-2 and a corresponding M⊕ (these parameters are the same as in the current Runs 4 and 4H). The physics included in the calculation is essentially the same as for the runs shown in Table 1. The Run IIa was cut off at 2 Myr with M⊕ and M⊕. The continuation to 3 Myr shows that remains at a fairly constant value of M⊕ yr-1. At 3 Myr the core and envelope masses are, respectively 2.8 and 0.91 M⊕. Further evolution for another Myr would result in an estimated M⊕. Thus it is reasonable to be able to form a planet with the pre-mass-loss characteristics of Kepler-11 f within a standard disk lifetime. The relatively small core mass results in a slow envelope accretion rate, so the object is unlikely to reach the stage of rapid gas accretion. Although Lopez et al. (2012) did not calculate the formation phase, this result is consistent with their suggestion that formation of the Kepler-11 system occurred outside the snow line and that the cores contain a substantial ice component.
A rather different result on mass loss is obtained by Chiang & Laughlin (2013). Using essentially the same energy-limited mass loss formula as in the previously-cited papers, but without a full calculation of the thermal evolution, they find that the amount of mass lost over the lifetime is given by (their equation 31)
| (6) |
where is the radius during the time before 0.1 Myr and is the total planet mass. Taking M⊕, , AU, and estimating R⊕ from Figure 2 with M⊕, we obtain M⊕. Note that all of these mass loss estimates involve considerable uncertainty.
In summary, the mass loss estimates from Ikoma & Hori (2012) and Chiang & Laughlin (2013) imply that Kepler-11 f initially had M⊕ and could easily have formed within 2 AU as an object with a rock/iron core and a low-mass H/He envelope; note that our calculation at 2 AU gives an envelope mass just after formation of 0.16 M⊕. On the other hand, with the mass loss estimate from Lopez et al. (2012), or in any case with mass loss substantially greater than 0.1 M⊕, the object is much more likely to have formed exterior to the snow line with an ice-rich core. In both cases, migration to the present orbital location is indicated. In situ formation is possible only under a very limited set of assumptions, including (1) the planet’s mass is near the one-standard-deviation observational upper limit (2.8 M⊕), (2) mass loss after formation is negligible, and (3) either a) the solid surface density in the disk at the formation location is about 1700 g cm-2, which is required to build a 2.8 M⊕ core at 0.25 AU (Eq. 3), or b) an equivalent mass in solids was delivered to the planet via gas drag.
5 Summary and Conclusions
We investigate the formation and evolution, up to 4 Gyr, of planets with core masses of 2.2–2.5 M⊕ and with core compositions of either iron and rock or iron and rock and ice. Gas accretion onto the cores is calculated with a detailed envelope model that includes the effects of dust settling and coagulation in the opacity calculation. The accretion is carried out at distances of 4, 2, 1, and 0.5 AU from the central star. At a fixed cutoff time for the protoplanetary disk (2 Myr), the amount of accreted gas ranges from 0.037 M⊕ at 0.5 AU to 0.16 M⊕ at 2 AU. Previous results (Rogers et al., 2011) at 4 AU give an envelope mass of 0.54 M⊕ at the same time with a slightly higher core mass. For in the range 0.037 to 0.16 M⊕, final radii, after 4 Gyr, fall in the range 2–6 R⊕, depending on envelope mass and core composition, as well as on the assumed value of the equilibrium surface temperature during the constant-mass evolution phase. These radii are in general in agreement with those observed by Kepler for sub-Neptune-type planets.
The values of mass that we calculate fall within the range of observed values for Kepler-11 f, with mass 2.0 (+0.8, –0.9) M⊕, radius 2.48 (+0.02, –0.03) R⊕. This planet orbits at 0.25 AU with an equilibrium temperature of 525 K. The envelope mass is estimated to be about 0.08 M⊕ (Lopez et al., 2012). Our models indicate that if the planet had formed in situ, it could not have accreted enough envelope mass to account for its present radius, even if XUV-driven mass loss were not important. If the actual planet mass were near the one-standard-deviation upper limit (2.8 M⊕) then in situ formation (without mass loss) could have occurred. On the other hand, some models indicate that substantial mass loss ( M⊕) from the envelope would have occurred at its present orbital position. In that case, in situ formation is not possible, and the planet probably formed beyond the snow line at AU with a rock/iron/ice core, and, during formation, migrated inward. If the mass loss at the current orbit were only moderate ( M⊕), then the planet could have formed between 1 and 2 AU with a rock/iron core, coupled with migration inward. Furthermore, if the planet formed at 4 AU according to the core-nucleated accretion model, the required solid surface density would have been about twice that in the minimum-mass solar nebula. If it had formed in situ, that density would have to be times that in the MMSN, corresponding to 4 times that in the minimum-mass extrasolar nebula of Chiang & Laughlin (2013). Thus the results of this paper support a migration history for the planet Kepler-11 f.
References
- Alexander & Ferguson (1994) Alexander, D. R., & Ferguson, J. W. 1994, ApJ, 437, 879
- Batalha et al. (2013) Batalha, N. M., Rowe, J. F., Bryson, S. T. et al. 2013, ApJS, 204, 24
- Bodenheimer et al. (2000) Bodenheimer, P., Hubickyj, O., & Lissauer, J. J. 2000, Icarus, 143, 2
- Burke et al. (2014) Burke, C. J., Bryson, S., Mullally, F. et al. 2014, ApJS, 210, 19
- Chiang & Laughlin (2013) Chiang, E., & Laughlin, G. 2013, MNRAS, 431, 3444
- Freedman et al. (2008) Freedman, R. S., Marley, M., & Lodders, K. 2008, ApJS, 174, 504
- Goldreich & Schlichting (2014) Goldreich, P., & Schlichting, H. 2014, AJ, 147, 32
- Greenzweig & Lissauer (1992) Greenzweig, Y., & Lissauer, J. J. 1992, Icarus, 100, 440
- Hansen & Murray (2012) Hansen, B., & Murray, N. 2012, ApJ, 751, 158.
- Hansen & Murray (2013) Hansen, B., & Murray, N. 2013, ApJ, 775, 53.
- Henyey et al. (1964) Henyey, L., Forbes, J., & Gould, N. 1964, ApJ, 139, 306
- Hori & Ikoma (2011) Hori, Y., & Ikoma, M. 2011, MNRAS, 416, 1419
- Iaroslavitz & Podolak (2007) Iaroslavitz, E., & Podolak, M. 2007, Icarus, 187, 600
- Ikoma & Hori (2012) Ikoma, M., & Hori, Y. 2012, ApJ, 753, 66
- Inaba et al. (2003) Inaba, S., Wetherill, G. W., & Ikoma, M. 2003, Icarus, 166, 46
- Kippenhahn & Weigert (1990) Kippenhahn, R., & Weigert, A. 1990, Stellar Structure and Evolution (Berlin: Springer-Verlag)
- Lissauer (1987) Lissauer, J. J. 1987, Icarus, 69, 249
- Lissauer et al. (2011a) Lissauer, J. J., Fabrycky, D., Ford, E. et al. 2011a, Nature, 470, 53
- Lissauer et al. (2009) Lissauer, J. J., Hubickyj, O., D’Angelo, G., & Bodenheimer, P. 2009, Icarus, 199, 338
- Lissauer et al. (2013) Lissauer, J. J., Jontof-Hutter, D., Rowe, J. F. et al. 2013, ApJ, 770, 131
- Lissauer et al. (2011b) Lissauer, J. J., Ragozzine, D., Fabrycky, D. et al. 2011b, ApJS, 197, 8
- Lopez & Fortney (2013) Lopez, E., & Fortney. J. J. 2013, arXiv:1311.0329
- Lopez et al. (2012) Lopez, E., Fortney. J. J., & Miller, N. 2012, ApJ, 761, 59
- Marcy et al. (2014) Marcy, G., Isaacson, H., Howard, A. W. et al. 2014, ApJS, 210, 20
- Movshovitz et al. (2010) Movshovitz, N., Bodenheimer, P., Podolak, M., & Lissauer, J. J. 2010, Icarus, 209, 616
- Movshovitz & Podolak (2008) Movshovitz, N., & Podolak, M. 2008, Icarus, 194, 368
- Murray-Clay et al. (2009) Murray-Clay, R. A., Chiang, E. I., & Murray, N. 2009, ApJ, 693, 23
- Nettelmann et al. (2011) Nettelmann, N., Fortney, J. J., Kramm, U., & Redmer, R. 2011, ApJ, 733, 2
- Podolak et al. (1988) Podolak, M., Pollack, J. B., & Reynolds, R. T. 1988, Icarus, 73, 163
- Pollack et al. (1996) Pollack, J. B., Hubickyj, O., Bodenheimer, P. et al. 1996, Icarus, 124, 62
- Rein (2012) Rein, H. 2012, MNRAS, 427, L21
- Ribas et al. (2005) Ribas, I., Guinan, E. F., Güdel, M., & Audard, M. 2005, ApJ, 622, 680
- Rogers et al. (2011) Rogers, L. A., Bodenheimer, P., Lissauer, J. J., & Seager, S. 2011, ApJ, 738, 59
- Safronov (1969) Safronov, V. S. 1969, Evolution of the Protoplanetary Cloud and Formation of the Earth and Planets (Moscow: Nauka)
- Saumon, Chabrier, & van Horn (1995) Saumon, D., Chabrier, G., & van Horn, H. M. 1995, ApJS, 99, 713
- Seager et al. (2007) Seager, S., Kuchner, M., Hier-Majumder, C. A., & Militzer, B. 2007, ApJ, 669, 1279
- Ward (1997) Ward, W. R. 1997, ApJ, 482, L211
- Weiss & Marcy (2014) Weiss, L. M., & Marcy, G. W. 2014, ApJ, 783, L6
- Weiss et al. (2013) Weiss, L. M., Marcy, G. W., Rowe, J. F. et al. 2013, ApJ, 768, 14
- Wu & Lithwick (2013) Wu, Y., & Lithwick, Y. 2013, ApJ, 772, 74