Observations of Subarcsecond Bright Dots in the Transition Region above Sunspots with the Interface Region Imaging Spectrograph
Abstract
Observations with the Interface Region Imaging Spectrograph (IRIS) have revealed numerous sub-arcsecond bright dots in the transition region above sunspots. These bright dots are seen in the 1400Å and 1330Å slit-jaw images. They are clearly present in all sunspots we investigated, mostly in the penumbrae, but also occasionally in some umbrae and light bridges. The bright dots in the penumbrae typically appear slightly elongated, with the two dimensions being 300–600 km and 250–450 km, respectively. The long sides of these dots are often nearly parallel to the bright filamentary structures in the penumbrae but sometimes clearly deviate from the radial direction. Their lifetimes are mostly less than one minute, although some dots last for a few minutes or even longer. Their intensities are often a few times stronger than the intensities of the surrounding environment in the slit-jaw images. About half of the bright dots show apparent movement with speeds of 10–40 km s-1 in the radial direction. Spectra of a few bright dots were obtained and the Si iv 1402.77Å line profiles in these dots are significantly broadened. The line intensity can be enhanced by one to two orders of magnitude. Some relatively bright and long-lasting dots are also observed in several passbands of the Atmospheric Imaging Assembly onboard the Solar Dynamics Observatory, and they appear to be located at the bases of loop-like structures. Many of these bright dots are likely associated with small-scale energy release events at the transition region footpoints of magnetic loops.
1 Introduction
Sunspots are regions with the strongest magnetic field in the solar atmosphere. In the layers of photosphere and chromosphere, a sunspot usually has a dark umbra and a less dark penumbra enclosing the umbra. The penumbra consists of filamentary structures which often have dark cores (Scharmer et al., 2002). In photospheric images, grain-like features at the head of penumbral filaments are often found to move with speeds of a few hundred meters per second (Muller, 1973). For reviews of sunspots, we refer to Solanki (2003), Borrero & Ichimoto (2011), and Rempel & Schlichenmaier (2011).
The solar transition region (TR) is the interface between the chromosphere and corona, where the temperature and density change dramatically. Although sunspots have been extensively studied for centuries, the TR above sunspots is still poorly understood due to the lack of high-resolution observations. Most existing investigations of the sunspot’s TR are focused on oscillations (e.g., Brynildsen et al., 1999a, b; O′Shea et al., 2002; Tian et al., 2014), supersonic downflows (Brynildsen et al., 2001), and sunspot plumes (e.g., Foukal et al., 1974; Doyle & Madjarska, 2003; Brosius & Landi, 2005; Tian et al., 2009).
The recently launched Interface Region Imaging Spectrograph (IRIS, De Pontieu et al., 2014) mission is now providing high-resolution (0.33′′) observations of the TR and chromosphere. With IRIS observations, here we report a new feature in the sunspot’s interface region: subarcsecond bright dots. We measure their physical properties, investigate their spectroscopic signatures and relate them to coronal structures seen in images taken by the Atmospheric Imaging Assembly (AIA, Lemen et al., 2012) onboard the Solar Dynamics Observatory (SDO, Pesnell et al., 2012).
2 Data analysis
We mainly analyze the sit-and-stare observation made from 14:39 to 15:29 on 2014 January 9. The pointing was (351′′, -127′′), targeting the smaller sunspot of AR 11944. One thousand slit-jaw images (SJI) in the 1400Å filter were obtained. Several spectral windows covering a few strong emission lines (e.g., Si iv 1402.77Å, C ii 1334.53Å and Mg ii K 2796.35Å) were recorded. The cadence, exposure time and spatial pixel size are 3 seconds, 2 seconds and 0.167′′, respectively. Dark current subtraction, flat field and geometrical corrections have been applied in the level 2 data used here.
This dataset was taken during the eclipse season. To remove the significant jitter and drift we have aligned the slit-jaw images to the first frame of every 150 images through cross correlation.
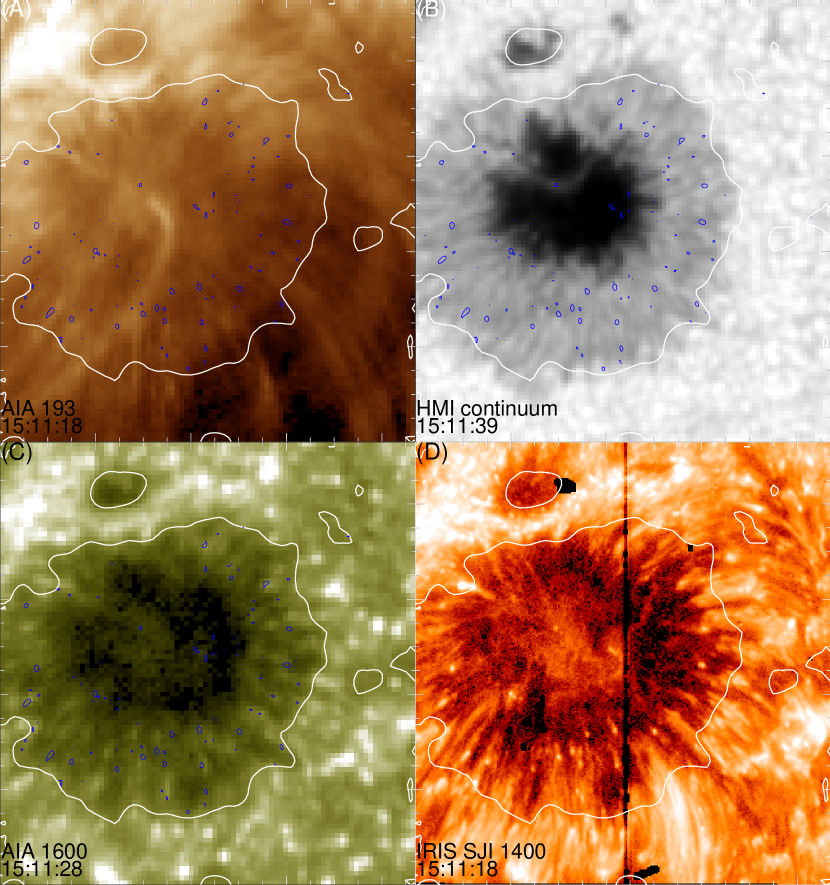
Figure 1(A)-(C) shows the 193Å and 1600Å images taken by AIA and the continuum image taken by the Helioseismic and Magnetic Imager (HMI, Scherrer et al., 2012) onboard SDO. Cross-correlation between the AIA 1600Å and IRIS 1400Å images are used for the coalignment, with an uncertainty of about one AIA pixel (0.6′′). Some filamentary structures in the IRIS 1400Å image (Figure 1(D)) seem to be emission of the UV continuum (formed slightly above temperature minimum) and associated with the penumbral filaments in the HMI continuum image. Others are likely Si iv emission (104.9K) from legs of corona loops seen in AIA 193Å.
We find many transient grain-like bright dots in the 1400Å images (Figure 1(D), movie m1.mpg). They are mostly present in the penumbra, but also occasionally appear in the umbra and light bridge. Some of them are clearly moving either inward or outward in the radial direction of the sunspot. We smooth each image over an area of 88 pixels and subtract this smoothed image from the original image. The small-scale bright dots in the sunspot can be outlined using contours of the resulting image (blue contours in Figure 1). We do not find obvious signatures of these dots in the HMI continuum image. A comparison between the IRIS and AIA images (movie m2.mpg) suggests that some bright dots are associated with faint loops in AIA 193Å.
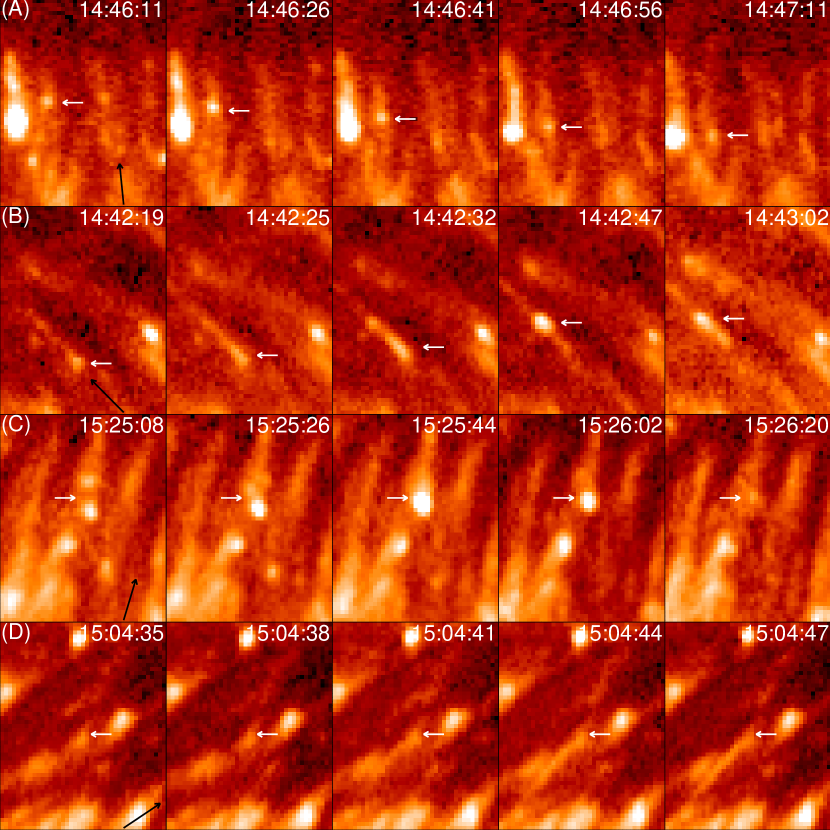
Figure 2 shows the temporal evolution of some bright dots in four different regions. The dots seem to be located in or at the edge of the bright filamentary structures. They are often more extended in one direction. For some dots this direction is parallel to the bright filamentary structures roughly in the sunspot radial direction. However, for other dots this direction deviates from the radial direction. Some dots can move towards each other and eventually merge into one dot (e.g., Figure 2(C)). We often see an obvious increase of the intensity when two dots merge. A few jet-like features with apparent speeds of 400 km s-1 are initiated in close proximity to some bright dots (e.g., Figure 2(D)). However, the associated bright dots seem to be present even before the jets and their intensities show no dramatic increase as the jets appear.
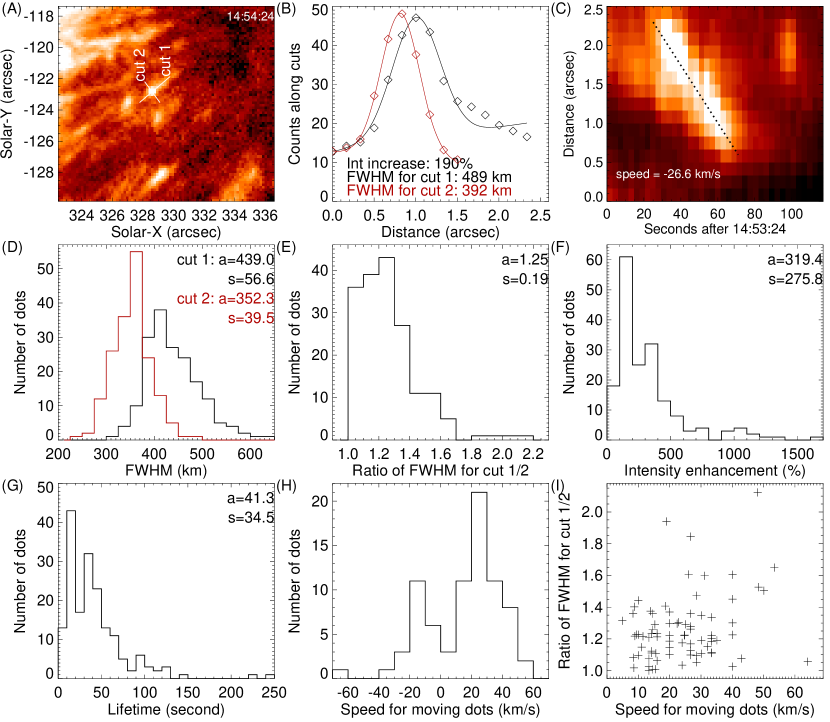
We have selected 176 penumbral bright dots that are well-isolated and have no obvious interaction with other dots from the 1400Å images. We first find the time when each dot shows the maximum brightness and plot the image at that time. We then plot the intensities along two cuts across each dot: cut 1 along the long side (often radial direction) and cut 2 along the short side (often perpendicular to the radial direction). If the dot is round, then cuts 1 and 2 are along and perpendicular to the radial direction respectively. Each intensity profile is approximated with a Gaussian function plus a linear background. The full width at half maximum (FWHM) is regarded as the size (length from cut 1 and width from cut 2) of the dot. We have also calculated the ratio of the peak intensity and average background for each cut, and the smaller one of the two values is taken as the intensity enhancement. We find that 44.3% of the dots show obvious movement, generally in (or slightly deviated from) the radial direction. Using the space-time technique, their apparent speeds are estimated from the slopes of the inclined strips in space-time maps. An example of this calculation is presented in Figure 3(A)-(C).
Figure 3(D)-(H) presents the distributions of these parameters. We find that these penumbral dots are usually 300–600 km long and 250–450 km wide. The distribution of the ratio between length and width peaks at 1.25. Their lifetimes are mostly less than one minute, although some dots last for a few minutes. Their intensities are usually a few times and sometime more than 10 times stronger than the intensities of the surrounding filamentary structures in the slit-jaw images. Among the 78 dots which show obvious movement, 56 of them are moving inward to the umbra and the rest 22 are moving outward. The moving dots usually have speeds of 10–40 km s-1. We find a weak positive correlation between the speed and the length/width ratio (Figure 3(I)).
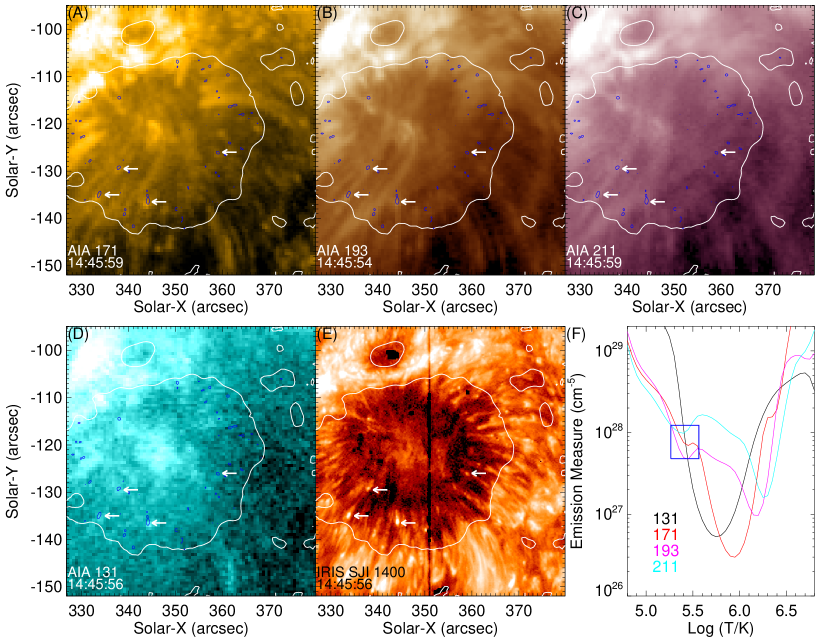
Some very bright and relatively large dots also show up in AIA images, identified mainly in 304Å, 171Å, 193Å, 211Å, and 131Å passbands (e.g., the four dots pointed by the arrows in Figure 4). A few such dots last even longer than 10 min (not counted in Figure 3). They seem to be located at the footpoints of loop-like structures. Given the significant response around 105.5 K (Martínez-Sykora et al., 2011) for all these AIA passbands, it is possible that they are cool TR structures. Determination of the temperature from differential emission measure analysis is difficult since there is little temperature discrimination at TR temperatures in the AIA channels (e.g., Del Zanna et al., 2011; Testa et al., 2012). Instead, we divide the AIA intensities by the temperature responses to calculate the EM-loci (EM: emission measure) curves (e.g., Del Zanna et al., 2002) to determine the possible temperature. The curves in Figure 4(F) appear somewhat consistent with an isothermal plasma of 105.4K and an EM of 81027 cm-5, as there are many crossings of the AIA curves in a relatively narrow box spanning 105.25–105.55K and (5 – 12)1027 cm-5. However, a quantitative investigation reveals that there is no isothermal solution in the vicinity of 105.4K that completely fits the AIA observations. A single temperature EM model was manually fitted to AIA data for the six Fe-dominated EUV channels, varying both the temperature and EM with sufficient resolution to smoothly resolve the minimum chi-square location. The best fit reduced chi-square value is 9.3 for an isothermal model at T = 105.3K with EM = 1.051028 cm-5, which indicates a very poor fit. Thus, we do not believe that the dot plasma is isothermal — there must be plasma at multiple temperatures. The EM-loci curves should just be considered as an upper boundary to the true emission measure distribution.
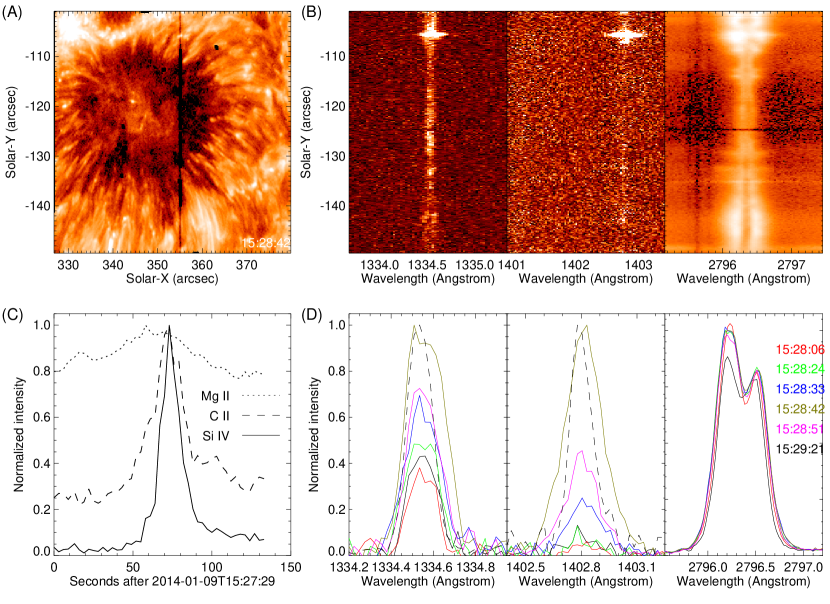
The IRIS slit crossed a few bright dots. An example is shown in Figure 5. The TR line profiles, especially the Si iv line profiles of these bright dots, are significantly enhanced and broadened with respect to the average penumbral profiles. For the eight bright dots we analyzed, six of them show no detectable time lag between the maximum intensities of the C ii and Si iv lines (e.g., Figure 5(C)). For the other two dots the Si iv intensity peak lags that of C ii by 6 seconds. Such a result seems to favor a heating process rather than a cooling process as the formation temperatures of Si iv and C ii are 104.9K and 104.4K respectively. The Si iv line intensity is often enhanced by one to two orders of magnitude during the crossing of these bright dots, whereas the C ii intensity is only enhanced by a factor of 3. The Mg ii K line often shows a much weaker intensity enhancement, suggesting that some dots do not have significant chromospheric emission. Figure 5(D) shows that the Si iv line is significantly broadened, with obvious enhancement at the wings. A small red shift (15 km s-1) is found for this dot.
We can estimate the density for the bright dot shown in Figure 5. By assuming a filling factor of one, the Si iv line intensity can be approximated as (Tian et al., 2009)
| (1) |
The radiance of the Si iv 1402.77Å line can be calculated using the observed counts and the effective area of IRIS (De Pontieu et al., 2014). Using the coronal abundances of Schmelz et al. (2012) and the standard CHIANTI v7 ionization equilibrium (Landi et al., 2012), we can calculate the contribution function ) at its peak temperature (=104.9K) at different densities (). We find a number density of 21010 cm-3 if we reasonably assume an emission depth of 400 km, the typical size of the dots.
The total thermal energy of the bright dot plasma can be calculated as
| (2) |
where is the Boltzmann constant. The emission volume can be estimated as , with being half of the typical dot size 400 km. Using a temperature () of 104.9K, the energy is estimated to be of the order of 1022–1023 erg. This is close to the typical nanoflare energy, 1024 erg (Parker, 1988).
Another characteristic of the spectra of many bright dots is the absence of the O iv 1401.16Å line emission (Figure 5(B)). In principle the dominance of collisional de-excitation from the meta-stable level over radiative decay could lead to the absence of emission from this forbidden line. However, the derived density does not seem extremely high. The absence of O iv 1401.16Å may also be caused by non-equilibrium ionization. The ionization and recombination times of Si iv are found to be of the order of 100 s at a much lower density (Peter et al., 2006). These time scales will be reduced and likely comparable to or smaller than the typical lifetimes of bright dots at a density of 21010 cm-3. Thus, ionization equilibrium can be reached for Si iv and non-equilibrium ionization effects may not explain the disappeared/weak O iv emission. A recent investigation suggests that the O iv 1401.16Å line will be suppressed in the case of non-Maxwellian distribution (Dudik et al., 2014). If this is true, the absence of the O iv 1401.16Å emission may suggest that the dot plasma is far from thermal equilibrium.
In this observation only the 1400Å filter was used to achieve a very high cadence. We have examined several other short-exposure and high-cadence observations starting at 16:09 on 2013 September 1, 11:14 on 2013 December 3, 13:00 on 2014 January 9, 08:43 on 2014 February 22, 00:26 on 2014 March 16, and 01:37 on 2014 March 16. Similar bright dots are clearly present in (even beyond) the penumbrae of all sunspots. Some observations also include the 1330Å channel, albeit at a lower cadence, show that the bright dots are also seen in 1330Å images. Both the 1400Å and 1330Å filters have significant contribution from TR emission (De Pontieu et al., 2014). Signatures of these dots are mostly not very prominent in the chromospheric 2796Å SJI images. Bright dot-like features are also observed in light bridges and apparent oscillatory motion of them has been found in the 2013 September 1 observation.
These bright dots seem to be different from the well-known penumbral grains in photospheric images (Muller, 1973). Although inward and outward moving as well as static penumbral grains are all observed to exist, their moving speeds are mostly less than 1 km s-1. Moreover, the average lifetime of the penumbral grains is 10 minutes (Zhang & Ichimoto, 2013). It is possible that some long-lasting and moveless dots we identified are related to the penumbral grains since the 1400Å and 1330Å passbands also have contribution from the UV continuum. However, we usually do not see visible enhancement in the continuum level from the spectra. Among tens of dot spectra we examined, only a few show obvious enhancement of the Mg ii wing (formed in the photosphere) and no visible enhancement of Si iv. The association of these bright dots with moving magnetic features (e.g., Zhang et al., 2007; Sainz Dalda & Bellot Rubio, 2008) is not obvious from the HMI magnetograms. However, more detailed analysis should be performed using higher-resolution magnetograms before excluding this possibility. Small-scale jets and brightenings with similar lifetimes have been found in the chromosphere above sunspots (Katsukawa et al., 2007; Reardon et al., 2013). The weak enhancement of the chromospheric Mg ii K line emission suggests that some bright dots could be related to these chromospheric transients.
The three-dimensional configuration of penumbral magnetic structures includes an almost horizontal field associated with penumbral filaments and a more vertical background field (e.g., Solanki & Montavon, 1993). We find that some bright dots are located at the edge of filamentary structures and that the extension of some dots deviates from the radial direction. Also some dots are clearly located at the bases of loop-like structures, which may be considered as the background field. Perhaps some dots are generated as a result of interaction, e.g., reconnection, between the two field components. In that case the bright dots may be explained as the plasma heated to TR temperatures during reconnection. The enhanced line width might be related to reconnection outflows (Innes et al., 1997). The movement of some dots may be explained as the spreading of the heated plasma along field lines. By assuming the same velocity for all dots, both the length/width ratio and the speed projected onto the plane of sky will be larger if the field lines are more inclined. This scenario might explain the positive correlation shown in Figure 3(I). However, other probabilities such as successive reconnection in a group of crowded loops cannot be ruled out as the correlation is not very strong.
Recently, Régnier et al. (2014) reported subarcsec bright dots from observations of the High-resolution Coronal (Hi-C) imager. These EUV dots were interpreted as signatures of impulsive energy release at the bases of trans-equatorial loops. Although not observed in sunspots, their lifetimes and sizes are similar to those of some dots we report here. We can not exclude the possibility that a similar mechanism applies for our sunspot bright dots. Highly variable brightenings in moss regions were also identified from the Hi-C data (Testa et al., 2013). However, they are located at the footpoints of bright hot loops seen in AIA 94Å, which is not the case for our sunspot bright dots. So their scenario, coronal nanoflare in the overlying hot loops, may not explain our observation. Also using the Hi-C data, Winebarger et al. (2013) reported faint, cool (105K), and dense (1010 cm-3) loops in an inter-moss region. These short-lived loops were interpreted as a natural consequence of impulsive energy release by reconnection of braided magnetic fields in the TR. It would be interesting to examine whether this scenario can produce dot-like TR features.
Using IRIS observations, Kleint et al. (2014) reported bursts of high Doppler shifts implying downflows of up to 200 km s-1 in chromospheric and TR lines that are correlated with brightenings in slit-jaw images. These brightenings appear as dots or ribbons in mainly the umbrae of some sunspots. The bright dots we report here are a different type of brightenings: found in mainly the penumbrae of all sunspots, usually isolated, and often moving inward or outward with speeds less than 40 km s-1. Despite that, it is still possible that a few of our dots are associated with falling plasma as proposed by Kleint et al. (2014).
3 Conclusion
We have found many small-scale bright dots in the IRIS 1400Å and 1330Å slit-jaw images of sunspots. These bright dots are observed in the penumbrae of all sunspots we inspected, and are occasionally present in the umbrae and light bridges of some sunspots.
We have statistically quantified the bright dots in the penumbra of one sunspot. In 1400Å slit-jaw images they are found to be generally 300–600 km long and 250–450 km wide, last mostly less than one minute, often show an intensity enhancement by a few factors, and sometimes move inward (32%) or outward (13%) with speeds of 10–40 km s-1.
We have obtained spectra of several bright dots. Based on the greatly enhanced Si iv 1402.77Å emission, we have roughly estimated the energy, which appears to fall in the energy range of nanoflares. The broadened line profiles of Si iv 1402.77Å, together with the absence of the O iv 1401.16Å line, suggests the involvement of a possible heating process.
We have discussed possible generation mechanisms for these sunspot bright dots. Many of them are likely generated by impulsive reconnection in the TR and chromosphere. Some are probably associated with falling plasma.
References
- Borrero & Ichimoto (2011) Borrero, J. M., Ichimoto, K., 2011, Living Reviews in Solar Physics, 8, 4
- Brynildsen et al. (1999a) Brynildsen, N., Leifsen, T., Kjeldseth-Moe, O., Maltby, P., 1999a, ApJ, 511, L121
- Brynildsen et al. (1999b) Brynildsen, N., Kjeldseth-Moe, O., Maltby, P., & Wilhelm, K. 1999b, ApJ, 517, L159
- Brynildsen et al. (2001) Brynildsen, N., Maltby, P., Kjeldseth-Moe, O., Wilhelm, K. 2001, A&A, 552, L77
- Brosius & Landi (2005) Brosius, J. W., & Landi, E. 2005, ApJ, 632, 1196
- Del Zanna et al. (2002) Del Zanna, G., Landini, M., Mason, H. E. 2002, A&A, 385, 968
- Del Zanna et al. (2011) Del Zanna, G., O′Dwyer, B., Mason, H. E. 2011, A&A, 535, A46
- De Pontieu et al. (2014) De Pontieu, B., et al. 2014, Sol. Phys., 289, 2733
- Doyle & Madjarska (2003) Doyle, J. G., & Madjarska, M. S. 2003, A&A, 407, L29
- Dudik et al. (2014) Dudik, J., et al. 2014, 780, L12
- Foukal et al. (1974) Foukal, P. V., Huber, M. C. E., Noyes, R. W., et al. 1974, ApJ, 193, L143
- Innes et al. (1997) Innes, D. E., Inhester, B., Axford, W. I., Wilhelm, K., Nature, 1997, 386, 811
- Katsukawa et al. (2007) Katsukawa, Y., Berger, T. E., Ichimoto, K., et al. 2007, Science, 318, 1594
- Kleint et al. (2014) Kleint, L., Antolin, P., Tian, H., et al. 2014, submitted to ApJL
- Landi et al. (2012) Landi, E., Del Zanna, G., Young, P. R., Dere, K. P., Mason, H. E. 2012, ApJ, 744, 99
- Lemen et al. (2012) Lemen, J. R., et al. 2012, Solar Phys., 275, 17
- Martínez-Sykora et al. (2011) Martínez-Sykora, J., De Pontieu, B., Testa, P., Hansteen, V. 2011, ApJ, 743, 23
- Muller (1973) Muller, R. 1973, Sol. Phys., 32, 409
- O′Shea et al. (2002) O′Shea, E., Muglach, K., & Fleck, B. 2002, A&A, 387, 642
- Pesnell et al. (2012) Pesnell, W. D., Thompson, B. J., Chamberlin, P. C. 2012, Sol. Phys., 275, 3
- Parker (1988) Parker, E. N. 1988, ApJ, 330, 474
- Peter et al. (2006) Peter, H., Gudiksen, B. V., Nordlund, Å, ApJ, 638, 1086
- Reardon et al. (2013) Reardon, K., Tritschler, A., Katsukawa, Y., ApJ, 779, 143
- Rempel & Schlichenmaier (2011) Rempel, M., Schlichenmaier, R., 2011, Living Reviews in Solar Physics, 8, 3
- Régnier et al. (2014) Régnier, S., Alexander, C. E., Walsh, R. W., et al. 2014, ApJ, 784, 134
- Sainz Dalda & Bellot Rubio (2008) Sainz Dalda, A., & Bellot Rubio, L. R. 2008, A&A, 481, L21
- Solanki & Montavon (1993) Solanki, S. K., & Montavon, C. A. P. 1993, A&A, 275, 283
- Solanki (2003) Solanki, S. K. 2003, Astron Astrophys Rev, 11, 153
- Scharmer et al. (2002) Scharmer, G. B., et al. 2002, Nature, 420, 151
- Scherrer et al. (2012) Scherrer, P. H., Schou, J., Bush, R. I. 2012, Sol. Phys., 275, 207
- Schmelz et al. (2012) Schmelz, J. T., et al. 2012, ApJ, 755, 33
- Testa et al. (2012) Testa, P., De Pontieu, B., Martínez-Sykora, J., et al. 2012, ApJ, 758, 54
- Testa et al. (2013) Testa, P., De Pontieu, B., Martínez-Sykora, J., et al. 2013, ApJ, 770, L1
- Tian et al. (2009) Tian, H., Curdt, W., Teriaca, L., Landi, E., & Marsch, E. 2009, A&A, 505, 307
- Tian et al. (2014) Tian, H., et al. 2014, ApJ, 786, 137
- Winebarger et al. (2013) Winebarger, A. R., Walsh, R. W., Moore, R., et al. 2013, ApJ, 771, 21
- Zhang & Ichimoto (2013) Zhang, Y., Ichimoto, K. 2013, A&A, 560, A77
- Zhang et al. (2007) Zhang, J., Solanki, S. K., Woch, J. 2007, A&A, 475, 695