Dynamic Scaling of Polymer Gels Comprising Nanoparticles
Abstract
We present dynamic light scattering (DLS) measurements of soft polymethyl-methacrylate (PMMA) and polyacrylamide(PA) polymer gels prepared with trapped bodies (latex spheres or maghemite nanoparticles). We show that the anomalous diffusivity of the trapped particles can be analyzed in terms of a fractal Gaussian network gel model for the entire time range probed by DLS technique. This model is a generalization of the Rouse model for linear chains extended for structures with power law network connectivity scaling, which includes both percolating and uniform bulk gel limits. For a dilute dispersion of strongly scattering particles trapped in a gel, the scattered electric field correlation function at small wavevector ideally probes self-diffusion of gel portions imprisoning the particles. Our results show that the time-dependent diffusion coefficients calculated from the correlation functions change from a free diffusion regime at short times to an anomalous sub-diffusive regime at long times (increasingly arrested displacement). The characteristic time of transition between these regimes depends on scattering vector as while the time decay power exponent tends to the value expected for a bulk network at small . The diffusion curves for all scattering vectors and all samples were scaled to a single master curve.
I Introduction
Dynamics of polymer and colloidal network systems has attracted great interest in the last two decades adam:1988 ; martin:1991 ; ren:1992 ; maity:1998 ; segre:1996 ; krall:1998 ; cipelletti:2000 . Analysis of experimental results are almost exclusively empirical, since theoretical analysis of these complex systems is hindered by non-trivial intrinsic long range correlations and non-ergodicity of the real networks. Complexity arises from the visco-elastic and many-body structure of interactions which extend over the whole system in gel networks introducing memory effects. The topological constraints may eventually lead to a localization of self-diffusion within a small finite volume.
Dynamic light scattering (DLS) has served as a useful tool to probe the molecular diffusion of this kind of system since the relaxation of the density fluctuations is reflected in the dynamic scattered electric field correlation function . Several works have shown that on approaching the gel point the correlation function is described as a simple exponential for short times and a stretched exponential for longer times , indicating an increasingly broad spectrum of relaxation times adam:1988 ; martin:1991 ; ren:1992 . At the gel point the system exhibits a critical slowing down while the correlation function decays as a power law martin:1991 . All regimes present power law dependence of the parameters and with the scattering vector . One of the interpretations of these results is based upon mechanisms of anomalous diffusion, where the mean-square displacement of scattering units is empirically given as either a power law or a logarithmic regime ren:1992 ; maity:1998 . The relation between the two functions is where is the scattering vector. In all analysis the temporal correlation function of polymer systems is treated in separate parts and a model that explains the dynamic behavior over the full time range has not yet been presented. Similar results were observed in colloidal gels krall:1998 ; cipelletti:2000 .
Beyond the gel point the correlation function tends, for large times, to a non-zero plateau indicating a freezing of the density fluctuations. The analysis of experimental correlation curves in this case is given in terms of empirical expressions martin:1991 ; maity:1998 ; vibrational modes of the network krall:1998 ; and also by the model of anomalous diffusion of segments licinio:1997 ; maity:1998 . Krall and Weitz krall:1998 also observed a plateau in the correlation function for polystyrene colloidal gels. They analyzed the correlation function in terms of overdamped normal modes of fractal clusters where the mean square displacement is given by the sum of exponential relaxations reflecting the relaxation of separate localized elastic modes of the gel. This sum leads to a stretched exponential type dependence:
| (1) |
This expression describes the entire temporal domain seen by dynamic light scattering. However the model does not fit the experimental data well for long times in concentrated samples. It was also observed that the parameters , and depend on both the scattering angle and the gel concentration.
In this letter we use dynamic light scattering to measure the internal dynamics of chemically cross-linked polymer gels. We use a Gaussian network model that differs from the Krall-Weitz model in considering the relaxation scaling. This model allows for a good fit of the experimental curves in all the observable time range while giving an interpretation for the fitting parameters.
II Experimental section
II.1 Materials and methods
We prepared a sample of aqueous poly(methyl methacrylate) gels by co-polymerization of methyl methacrylate (MMA, Aldrich) with ethylene glycol dimethacrylate (EGDM, Aldrich). The ratio MMA/EGDM was fixed at 50/1. To initiate the polymerization reaction, a small quantity of azobisisobutyronitrile was added. The gels were prepared with 10% wt. of solute (MMA + EGDM). Before adding the initiator, a small portion of standard latex spheres (Duke Scientific) of diameter 0.198 m was incorporated. The final solution was homogenized by vigorous shaking. We will refer to this sample as Latex.
We also prepared three ferrogel samples, also known as magnetic gels or magnetic elastomers, with aqueous poly(acrylamide) and industrial ferrofluids. The gels were made by co-polymerization of acrylamide with ,’ methylene bisacrylamide (Acros) in the presence of ammonium persulfate and ,,’,’-tetramethylenediamine morris . The ratio acrylamide / bisacrylamide was fixed at 30/1 and the total monomer concentration (acrylamide + bisacrylamide) was fixed at 2.5% wt. To these gels a small portion of aqueous magnetite ferrofluid was added. In the first sample, defined as M300, we used a M300 ferrofluid obtained from Sigma Hi-Chemical in such a way as to have a final concentration of % wt. of solids. The second and third samples, defined as EMG408 and EMG308, correspond to gels with the ferrofluids EMG408 and EMG308, both obtained from Ferrotec, having a final solid concentration of % wt. and % wt., respectively. The M300 ferrofluid was stabilized with the surfactant SDSB (sodium dodecyl-benzene sulfate). The type of surfactant employed in the Ferrotec ferrofluid was not disclosed by the supplier.
All samples were prepared in sealed 20 mL cylindrical glass vials (Wheaton) and were kept at C for nearly 12 hours to ensure that all monomers had reacted.
Dynamic light scattering measurements were made using a 20 mW He-Ne laser ( Å) and a photomultiplier as a detector. The detector was placed in a goniometer and the angle of scattering was controlled by a computer. The correlation functions were calculated by a BI9000-AT correlator board by Brookhaven Inst. Co. with 522 channels. During the measurements the samples were maintained in a thermal bath at 25.0∘C with a precision of 0.1∘C.
To minimize non-ergodic sampling effects inherent in polymer gels, we adopted the strategy of sampling a large gel volume and used a relatively large detection area in the photomultiplier (pin-hole diameter 400 m, corresponding to nearly 15 coherence areas). Signal to noise ratios close to could be obtained in measurements of 1 to 3 hours each.
II.2 Data analysis
DLS experiments yield the normalized intensity correlation function , which is related to the electric field correlation function . For stationary fluctuations with a Gaussian distribution, in the so-called homodyne mode, the two correlation functions are related by berne
| (2) |
where is an experimental constant given essentially by the number of coherence areas.
In the heterodyne mode, only part of the total intensity fluctuates, while an independent static coherent source (local oscillator), is also considered. In this case one has
| (3) |
Here and are the mean value of the fluctuating and static part of the scattered light, respectively, and is the total intensity.
In polymers and gels, the self-diffusivity of molecular chains is progressively slowed, since to perform any movement they have to drag surrounding polymer segments. This effect is more pronounced as the number of connections or complexity of the structure increases. For highly connected networks the diffusivity may reach a state of bounded diffusion, in which each segment diffuses only in a limited region of space. In previous works we have shown that the diffusion regime is determined by the topological connectivity in the network given by its spectral dimension . avteixeira:1999 ; licinio:2001 . Accordingly, a critical value divides the non-bounded from the bounded self-diffusion regime. The consequence of a bounded regime in DLS experiments is that the localization of gel segment excursions leads to a mean frozen structure. This also corresponds to the non-ergodic nature of gels leading to persistent speckle patterns in the scattered intensity. Above the gel point, as the structure progressively freezes, it becomes less correlated, the fluctuations being localized within independent volumes given by mesh sizes typically less than 1 micron. Dynamics of density or structure fluctuations around the mean can be understood as the source of a dynamic signal superimposed on the mean speckles. The scattering becomes intrinsically heterodyne.
To obtain the information about the dynamics of the polymer gels one considers both the fluctuating and static parts in the normalized first order correlation function. This is achieved by defining the gel correlation function as
| (4) |
while contains only the fluctuating part of the scattered field as in Eq.3. measures the intensity fluctuation strength and is defined as . The definition above implicitly decouples the static field from the fluctuating field at the detector. Hence the static field is defined as the average of the scattered electric field complex amplitude, which corresponds to the mean position of the confined scatterers.
Replacing of Eq.4 in Eq.3 one obtains the relation between the intensity (measured) and electric field correlation function:
| (5) |
The electric field correlation functions are calculated from Eq.5, in which the parameter was found for each scattering angle in the limit measured in a dilute solution of the same standard latex used in the gel, whose value changes slightly with the detector angle and lies around 0.5. The small value of is due to the large detection area. The fluctuation strength was obtained for each scattering angle by extrapolation to in Eq.5, noting that . So .
III Results and discussion
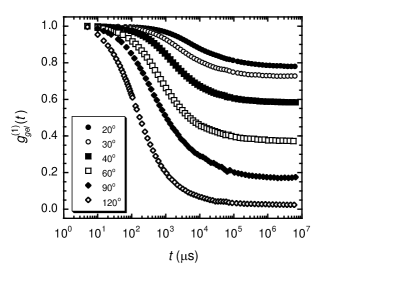
A set of typical correlation functions are shown in Fig.1. In all samples the correlation curves show an exponential decay at short times () and an asymptotic behavior at very long times. As discussed by Krall and Weitz krall:1998 this behavior can be explained as the result of the restricted movement of scattering particles. Since the particles are allowed to visit only a limited volume, their positions as well as the scattered intensity in different times are always correlated. The asymptotic correlation value depends on the ratio of the length through which the particles can diffuse to the scattering length . The scatterers must change their relative position by about to make an appreciable variation in the scattered intensity. So in the condition of large (small angles) the restricted particle movements have little effect in changing the value of the scattered intensity and and small fluctuations result. In the opposite small limit, the intensity fluctuations become quasi homodyne and the correlation function decays fully. Since the system is non-ergodic, we calculated the average from approximatively 20 different positions of one of the samples to obtain realistic ensemble averages. However we verify that observation of different positions of the same sample changes only the asymptotic plateau, but not the shape of the correlation curves. In all the other samples the data was collected in just one position.
Since the light scattered by the particles-containing gels is at least 20 times greater than that from neat gels, it can be assumed that the signal is due essentially to the trapped particles. In dilute conditions the correlation function is related to the mean square displacement of each scattering particle by and we can calculate the self-diffusion coefficient from the correlation function by
| (6) |
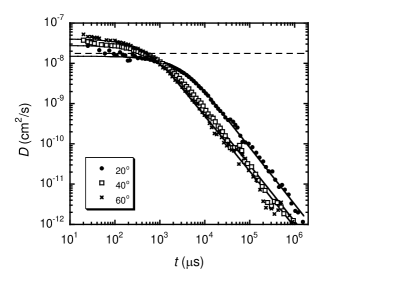
In Fig.2 it is shown that the diffusion coefficient has two distinct regimes: free diffusivity for short times where is nearly constant; and an anomalous regime characterized by a temporal power law over almost three decades.
To describe the full-time behavior of we use a mass-spring Rouse-like or Gaussian network model doi ; grosberg . In previous works we generalized the Rouse model to describe the dynamics either of regular networks with arbitrary dimensionality licinio:1997 ; licinio:1998 or that of fractal networks avteixeira:1999 ; avteixeira:tese . For regular networks, it was shown that the mean square displacement for a network of dimensionality with bond units is given by
| (7) | |||||
where is the single elastic-link relaxation time and is the free bond-particle diffusion constant.
The expression for the mean square displacement predicts three distinct regimes: for short times () the last term tends to a linear dependence on time, which corresponds to the free diffusion regime of the isolated units with ; for long times the first term is dominant and the mean square displacement is given by the diffusion of the entire structure with mass proportional to or . This regime is not achieved experimentally for ordinary gels, but it could be verified for isolated clusters or microgels.
| (8) |
where is the sum of the relaxations of the vibration modes
| (9) |
Evaluating the terms in Eq.7 and Eq.8 we verified that the last sum is dominant for infinitely large networks (), and hence
| (10) |
As for the mean square displacement, at short times () the diffusion coefficient approaches the free diffusion coefficient . For very long times the sum in Eq.9 can be replaced by an integral and, for large networks
| (11) |
which leads to the anomalous regime with
| (12) |
corresponding to
| (13) |
where is the asymptotic value of the mean square displacement and is a constant.
The same equations are valid for fractal networks, replacing in Eq.10, Eq.12 and Eq.13 with the spectral dimension , which describes the network topology. The data presentation using instead of is preferable since the anomalous regime is easily recognized as a straight line in a log-log plot. In Fig.2 we can see the least squares fit to the experimental data using Eq.10 (continuous lines), with , which is a very good approximation to the limit . The model gives a fair description of the diffusion dynamics over the whole time range of the measurements. In the same plot is shown the expected value for the free diffusion coefficient for the latex beads in pure solvent (dashed line). We observe that the diffusion coefficient of the gels in the thermodynamic limit using latex beads corresponds approximately to the expected value for the free diffusion coefficient. In the ferrogels the measured limiting diffusion coefficient is approximately one order of magnitude smaller than the free diffusion value. It was observed that some ferrofluids form aggregates when dispersed in a gel matrix avteixeira:2003pre thereby decreasing the apparent diffusion coefficient. However the size of the aggregates is not large enough to explain the measured limiting values ( cm2/s for the EMG308; cm2/s for the EMG408 and cm2/s for the M300). It is still plausible to account for network distortions around the magnetic particle aggregates that increase their effective viscous drag and decrease their effective initial diffusivity.
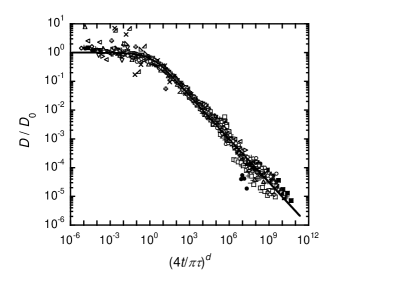
The curves for all the samples can be scaled into a single master curve (Fig.3) consistent with the predicted behavior of fractal Rouse networks.
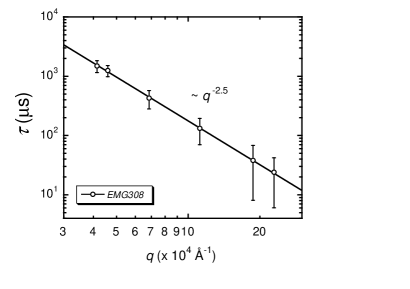
Although the form of the diffusion coefficient remains the same for all scattering angles, the fitted parameters display a dependence. The relaxation time, reflecting the network coarsening at different scattering wavelengths, follows a power law with close to 2 in three samples and in one sample, as shown in Fig.4. From Eq.6 it is easy to show that the anomalous regime (Eq.12) corresponds to a stretched exponential behavior normally observed in gel systems, which is given by
| (14) |
with . In the case of the characteristic time has has the same power regime for all . It has been found in other works that the power exponent for varies between 2 and 3, taking the values and for gelatin, depending on the sample temperature ren:1992 ; for gelatin above the gel point and beyond the gel point maity:1998 ; while for silica gels it was found to be martin:1991 .

One can argue that the transition time from free diffusion to the anomalous diffusion depends on the length scale defined by the inverse of the scattering vector. For a viscoelastic medium of size the relaxation time is given by the ratio of the friction factor and the elastic constant . For regular 3-D networks in the free draining limit we expect the friction factor to be proportional to the number of units, i.e., to the volume, and the elastic constant to be linear in the length scale. Thus
| (15) |
which leads to , corresponding to results found in our experiments.
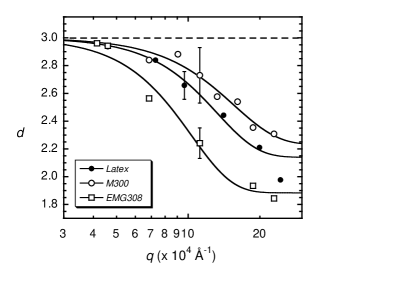
It can be seen, however, that these networks are far removed from the regular homogeneous model. Gel structure is reflected in the power exponent of the diffusion coefficient in the anomalous regime, or the spectral dimension. It is shown in Fig.5 that the spectral dimension for three samples lies between 1.8 and 3 and at small wavenumbers it tends to the value expected for regular 3-D networks, . This apparent discrepancy indicates some cancelation in fractal scaling corrections to visco-elastic effects, giving a weak fractal dimension dependence on the relaxation-size scaling of the networks, thus remaining the typical 3-D dependence.
IV Conclusions
In this paper we have reported dynamic light scattering measurements of polymer gels in which monodisperse 0.2 m latex particles and ferromagnetic particles are used as probes. In this way the correlation function gives information about the probe dynamics. Since the particles are confined by the surrounding network, their movements also reflect the local dynamics of gel segments. Experimental correlation function analysis is performed by normalizing the electric field correlation function to include the intrinsic static contribution of the gel. The temporal behavior can be better understood by displaying the time-dependent diffusion coefficient. Two regimes are observed - free diffusion and anomalous diffusion - for all samples at all scattering angles. These regimes are modeled in a consistent way by the simple mass-spring or Gaussian network model over the entire time range. Analyzing the characteristic time that separates the two regimes as a function of scattering wavenumber, we find a power law regime for most of the samples with an exponent close to -2. Similar dependence has already been reported for different systems exhibiting long-range organization. Our results also show that the dynamics of the gels approaches the behavior expected for regular 3-D networks at large length scales.
V Acknowledgements
This work was supported by the Brazilian agencies CNPq, FAPEMIG and CAPES.
References
- (1) M. Adam, M. Delsanti, and J. P. Munch. Dynamical studies of polymeric cluster solutions obtained near the gelation threshold: Glasslike behavior. Phys. Rev. Lett., 61(6):706–709, 1988.
- (2) J. E. Martin, J. Wilcoxon, and J. Odinek. Decay of density fluctuations in gels. Phys. Rev. A, 43(2):858–872, 1991.
- (3) S. Z. Ren, W. F. Shi, W. B. Zhang, and C. M. Sorensen. Anomalous diffusion in aqueous solutions of gelatin. Phys. Rev. A, 45(4):2416–2422, 1992.
- (4) S. Maity and H. B. Bohidar. Anomalous diffusion in gelatin-surfactant solutions and gels. Phys. Rev. E, 58(1):729–737, 1998.
- (5) P. N. Segrè and P. N. Pusey. Scaling of the dynamic scattering function of concentrated colloidal suspensions. Phys. Rev. Lett., 77(4):771–774, 1996.
- (6) A. H. Krall and D. A. Weitz. Internal dynamics and elasticity of fractal colloidal gels. Phys. Rev. Lett., 80(4):778–781, 1998.
- (7) L. Cipelletti, S. Manley, R. C. Ball, and D. A. Weitz. Universal aging features in the restructuring of fractal colloidal gels. Phys. Rev. Lett., 84(10):2275–2278, 2000.
- (8) P. Licinio and A. V. Teixeira. Anomalous diffusion of ideal polymer networks. Phys. Rev. E, 56(1):631–634, 1997.
- (9) C. J. O. R. Morris and P. Morris. Separation Methods in Biochemistry. Pitman, London, 1976.
- (10) B. J. Berne and R. Pecora. Dynamic Light Scattering: With Applications to Chemistry, Biology, and Physics. Dover Publications, 2000.
- (11) A. V. Teixeira and P. Licinio. Dynamics of swollen fractal networks. Europhys. Lett., 45(2):162–168, 1999.
- (12) P. Licinio. Dynamic scaling of dissipative networks. Physica A, 294:51–56, 2001.
- (13) M. Doi and S. F. Edwards. The Theory of Polymer Dynamics. Oxford, 1986.
- (14) A. Y. Grosberg and A. R. Khokhlov. Statistical Physics of Macromolecules. AIP, New York, 1994.
- (15) P. Licinio and A. V. Teixeira. Relaxation of ideal polymer networks. Phil. Mag. B, 78(2):171–175, 1998.
- (16) A. V. Teixeira. PhD Thesis. Universidade Federal de Minas Gerais, 2002.
- (17) A. V. Teixeira, I. Morfin, F. Ehrburger-Dolle, C. Rochas, E. Geissler, P. Licinio, and P. Panine. Scattering from dilute ferrofluid suspensions in soft polymer gels. Phys. Rev. E, 67(021504):1–7, 2003.