Pathways Towards Ferroelectricity in Hafnia
Abstract
The question of whether one can systematically identify (previously unknown) ferroelectric phases of a given material is addressed, taking hafnia (HfO2) as an example. Low free energy phases at various pressures and temperatures are identified using a first-principles based structure search algorithm. Ferroelectric phases are then recognized by exploiting group theoretical principles for the symmetry-allowed displacive transitions between non-polar and polar phases. Two orthorhombic polar phases occurring in space groups and are singled out as the most viable ferroelectric phases of hafnia, as they display low free energies (relative to known non-polar phases), and substantial switchable spontaneous electric polarization. These results provide an explanation for the recently observed surprising ferroelectric behavior of hafnia, and reveal pathways for stabilizing ferroelectric phases of hafnia as well as other compounds.
pacs:
XXXXCommonly known structural phases of hafnia (HfO2) are centrosymmetric, and thus, non-polar. Hence, recent observations of ferroelectric behavior of hafnia thin films (when doped with Si, Zr, Y, Al or Gd) BosckeHfO2_APL2011 ; BosckeSiHfO2_APL2011 ; MuellerHfO2:12 ; Muller:HfO2:nanolett ; Mueller12 ; BosckeProc11 ; Lomenzo:14 are rather surprising as ferroelectricity requires the presence of switchable spontaneous electrical polarization. The emergence of non-polar hafnia—as a linear high dielectric constant (or high-) successor to SiO2—for use in modern electronic devices (e.g., field-effect transistors) is now well-established WilkHfO2 ; Zhu:HfO2 . If the origins of its unexpected ferroelectricity can be understood and appropriately harnessed, hafnia-based materials may find applications in nonvolatile memories and ferroelectric field effect transistors as well.
A broader question that arises within this context, and also the one that will be addressed directly in this contribution, is whether one can systematically identify ferroelectric phases of a given material system. We show that this can indeed be accomplished and ascertained, for the example of hafnia, in two steps. First, a computation-based structure search method, e.g., the minima-hopping method Goedecker:MHM ; Amsler:MHM ; MHM:OrganovBookChapter , is used to identify low-energy phases at various pressures and temperatures. Then, ferroelectric phases are singled out by applying the group theoretical symmetry reduction principles, established by Shuvalov for ferroelectricity Shuvalov . These principles allow for the systematic identification of all possible lower symmetry proper ferroelectric phases that can result from higher-symmetry non-polar prototype (parent) phases.
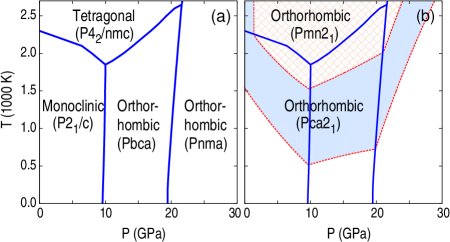
Using this approach, we find two ferroelectric phases of hafnia, belonging to the and orthorhombic space groups, which are close in free energy with the known non-polar equilibrium phases of hafnia over a wide temperature and pressure range. Figure 1(a) displays the computed equilibrium phase diagram of hafnia indicating the regimes at which the known non-polar phases are stable. This includes the low-temperature low-pressure monoclinic phase, high-pressure and orthorhombic phases, and the high-temperature tetragonal phase (the high-temperature cubic aristotype is not shown). These results are consistent with available experimental data WilkHfO2 ; Zhu:HfO2 ; Ruh:HfO2 ; Liu:HfO2 ; Leger93 ; Ohtaka91 ; Ohtaka:hafnia ; Tang:HfO2 . Figure 1(b) shows the temperature and pressure regimes (overlaid on the phase diagram of Figure 1(a)) when the identified ferroelectric and orthorhombic phases are extremely close in free energy ( where is the Boltzmann constant) to the equilibrium non-polar phases. The computed spontaneous polarizations of these ferroelectric phases are substantial, and switchable (at low temperatures) with small energy barriers ( meV/atom) via the parent non-polar tetragonal phase. Thus, and are viable ferroelectric phases and may be stabilized under appropriate experimental conditions (e.g., via strain due to epitaxy or dopants).
Our density functional theory (DFT) DFT1 ; DFT2 calculations were performed with the abinit package Gonze_Abinit_1 ; Gonze_Abinit_2 , employing the norm-conserving Hartwigsen-Goedecker-Hutter pseudopotentials HGH_Pseudo and the Perdew-Burke-Ernzerhof exchange-correlation energies functional PBE . Highly accurate DFT energies were ensured by dense Monkhorst-Pack -point meshes monkhorst , and a basis set of plane waves with kinetic energy up to 1100 eV. Convergence is assumed when the residual forces and stresses are smaller than eV/Å and eV/Å3, respectively. As given in the Supplemental Material supplement , the lattice parameters obtained by optimizing for the previously-known phases of hafnia agree very well with experimental data, implying that our computational scheme is reasonable.
Given that the ferroelectricity was observed BosckeHfO2_APL2011 ; BosckeSiHfO2_APL2011 ; MuellerHfO2:12 ; Muller:HfO2:nanolett ; Mueller12 ; BosckeProc11 ; Lomenzo:14 in doped hafnia thin films, and that pressure is theoretically predicted Clima_PEhafnia to play an important role in stabilizing the polar phase, we systematically searched for low-energy structures at pressures up to 30 GPa. In the minima-hopping method Goedecker:MHM ; Amsler:MHM ; MHM:OrganovBookChapter , used for our search, the DFT energy landscape of hafnia is explored by performing consecutive short molecular-dynamics steps, travelling across local minima, progressing towards the global minimum. The initial velocities of the molecular-dynamics trajectories were chosen to lay approximately along soft mode directions, improving the efficiency of the method. Local geometry optimizations were then used to obtain the equilibrium structure. This method has been successfully applied in the past for various classes of crystalline materials, including inorganic amsler12 ; Huan:Alanates ; Huan:Mixed and organometallic Baldwin:SnEster1 compounds.
The structure search procedure leads to a large number of possible hafnia phases. The eleven lowest-energy cases included six non-polar and five polar phases. The six non-polar phases were the previously known monoclinic, tetragonal, and orthorhombic, and cubic phases, as well as the recently predicted monoclinic phase Zeng:HfO2 ; the five polar phases were the and orthorhombic, and monoclinic, and the triclinic phases. Phonon band structure calculations, performed at zero temperature and various finite pressures up to 30 GPa using the linear response method Abinit_phonon_1 ; Abinit_phonon_2 , reveal that with the two exceptions of and , the remaining structures are dynamically stable across the entire pressure range. The high-temperature cubic structure is dynamically unstable within the whole pressure range examined, and the structure is dynamically stable only below 15 GPa. Above this pressure, the structure collapses to the tetragonal structure (as ascertained by following the unstable phonon modes). More detailed crystallographic information, simulated XRD patterns, and phonon frequency spectra of the examined structures are given in the Supplemental Material supplement .
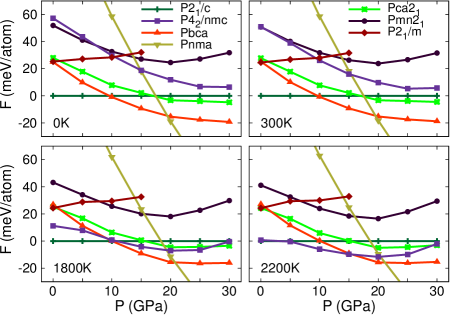
From the calculated phonon band structures, free energies were computed within the harmonic approximation for the dynamically stable structures. These are shown in Fig. 2 for four different temperatures across the entire pressure range considered. As established previously Liu:HfO2 ; Leger93 ; Ohtaka:hafnia ; Tang:HfO2 , we found that the , , and phases are thermodynamically stable below GPa, between GPa and GPa, and above GPa, respectively. Consistent with a recent experimental report Al-Khatatbeh:HfO2 , our additional calculations reveal that up to GPa, the structure remains the most stable phase of hafnia. The stabilization of the tetragonal phase is also confirmed in our work. Starting from K and GPa, this phase is stable relative to the monoclinic and the orthorhombic phases. At ambient pressures, we predict that hafnia transforms from the phase to the phase at K, consistent with experiments Ohtaka:hafnia ; wang_review . The phase diagram 1(a), which was constructed from the calculated , summarizes these findings.
Next, we consider the predicted polar (or non-centrosymmetric) hafnia phases, i.e., phases whose point groups do not contain an inversion operation. We note that of the five cases identified, the two orthorhombic phases and are energetically competing with the equilibrium phases while the , and phases are unfavorable by roughly 250 meV/atom compared to the other phases. Figure 1(b) identifies the temperature and pressure regimes at which the and phases are extremely close in free energy () to the corresponding equilibrium phases. These results provide a rationale for the observed ferroelectricity in hafnia under some conditions. Indeed, the orthorhombic phase has been observed in zirconia doped with Mg, Ca, and Y Heuer:zirconia ; Marshall:ZrO2 ; kisi ; Howard:zirconia and recently suggested Rabe:zirconia ; Clima_PEhafnia to be a low-energy polar phase of both hafnia and zirconia. The other four phases, i.e., , , , and , are identified for the first time in this work.
According to Shuvalov Shuvalov , the point symmetry displayed by and phases, the point symmetry displayed by and phases, and the point symmetry displayed by phase, are three ferroelectric subgroups of the tetragonal point group. In fact, the symmetry requirements placed on ferroelectric phases that can result from a parent non-polar phase through distortions are quite definitive. For instance, starting from a tetragonal prototype phase with point symmetry , ferroelectric orthorhombic phases of only two types with point symmetry (each of them accompanied by a definite polar axis) are possible. These principles suggest that the tetragonal phase of hafnia is the parent non-polar phase for all identified polar phases. Indeed, we found that all five non-centrosymmetric structures considered herein can be obtained by distorting the tetragonal structure appropriately. Two most interesting cases, the and orthorhombic structures can be obtained by distorting the tetragonal structure along its [110] and [100] directions, respectively.
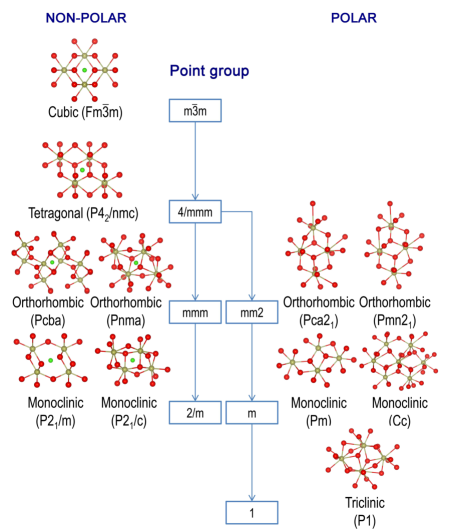
In order to better appreciate our findings within the context of Shuvalov’s symmetry-reduction principles, we show in Figure 3 all the predicted low-energy phases of hafnia identified by our structure-search scheme, classified in terms of their symmetry. The right branch of Fig. 3 shows the five identified polar phases (grouped in terms of their point symmetries) emerging from the prototype tetragonal phase. For completeness, we also display the non-polar phases on the left branch of Fig. 3. The highest symmetry phase at the top of the figure is the cubic phase. Successive symmetry reduction leads to the tetragonal phase, the high-pressure and orthorhombic phases, and finally, the ground-state monoclinic phase and the recently-predicted monoclinic phase Zeng:HfO2 .
We now consider just the polar and orthorhombic phases, and investigate the magnitude and switchability of the polarization. Taking the tetragonal phase as the reference, the spontaneous polarization was computed (through the evaluation of the Berry phase at King-Smith:polar ; Resta:pol ) to be: and pointing along the [001] and [100] directions, respectively (the [001] direction of the phase corresponds to the [110] direction of the prototype phase). Our calculated spontaneous polarization is in good agreement with experimentally measured values of remanent and saturation polarization (which fall within BosckeHfO2_APL2011 ; BosckeSiHfO2_APL2011 ; MuellerHfO2:12 ; Muller:HfO2:nanolett ; Mueller12 ; BosckeProc11 ; Lomenzo:14 ) as well as with recent computations for the phase of hafnia Rabe:zirconia ; Clima_PEhafnia .
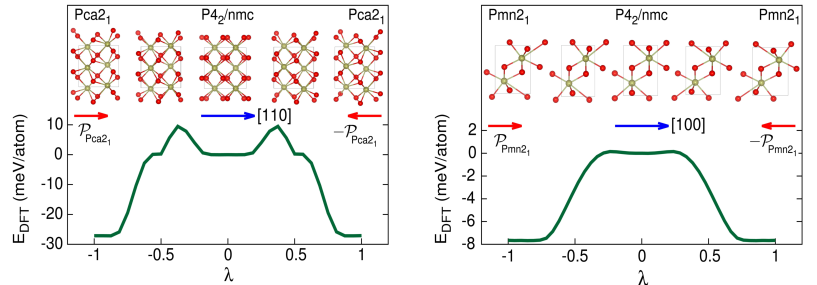
The spontaneous polarization of the and phases are switchable with small energy barriers for degree switching. For each of these phases, there are two topologically equivalent variants with opposite polarization, referred to as “up” and “down” states. These variants can be obtained by deforming the prototype structure along two opposite directions (see Fig. 4 for an illustration). We parameterized the continuous deformation from the up to the down states by , a parameter scaled to range from to . The minimum (DFT) energy pathways describing the deformation leading to the and phases, calculated using the generalized solid-state nudged elastic band method SSNEB , are shown in Fig. 4. As expected, these pathways go through the tetragonal phase at their centers () before reaching the opposite polarization state. The curvatures of the calculated pathways at are very small, indicating that although the tetragonal phase is dynamically stable, it corresponds to a very shallow minimum of the energy landscape (the corresponding phonon soft modes can be observed in the Supplemental Material supplement ). Experimentally, the transition from to , hypothesized to be a polar phase of hafnia, was conjectured in Ref. BosckeProc11, .
Moreover, the transitions from the phase to the and phases are also allowed by thermodynamic considerations. In particular, the energy barriers separating the up and the down states of the and phases at GPa are estimated to be 40 meV/atom and 8 meV/atom, respectively. Between the phase and these two ferroelectric phases, the energy barriers are smaller, i.e., 6 meV/atom for the phase and less than 1 meV/atom for the phase. For zirconia, the structural phase transition from to under hydrostatic pressures has experimentally been observed kisi .
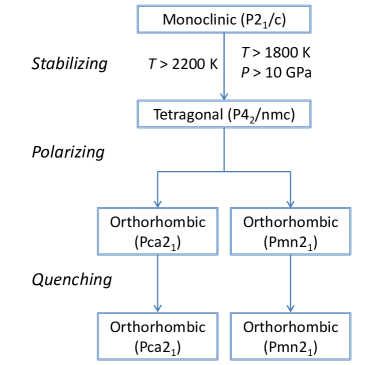
Fig. 4 suggests that while en route to the polar phases ( and ) of hafnia, the tetragonal phase has to be stabilized. We note in particular that the phase may be stabilized by some suitable combination of stress and/or internal/external electric field, e.g., by chemical doping or by fabrication of strain-engineered thin film structures Zhu:HfO2 ; WangHafnia . In Fig. 5 we tentatively sketch possible pathways which may enable the formation of polar phases even in pure hafnia. These pathways include several processes. First, the tetragonal phase may be stabilized at a suitable condition, e.g., K at ambient pressure or K at GPa. Next, perturbations, e.g., via an electric field, could drive the phase to a ferroelectric phase, either or . Finally, samples may be quenched to lower temperatures and pressures, preserving the obtained polar phases.
In summary, we have systematically identified possible ferroelectric phases of hafnia from first principles by combining a low-energy structure prediction method and symmetry reduction principles established for ferroelectric phase transitions. Two of the identified orthorhombic polar phases, which belong to the and space groups, are found to be extremely close in free energy to the equilibrium non-polar phases over a wide temperature and pressure window. Both polar phases can be obtained by distorting the well-known prototype non-polar tetragonal structure of hafnia. The calculated spontaneous polarization is substantial and switchable (with low energy barriers), implying that the and phases may provide an explanation for the recent observation of the ferroelectricity in doped hafnia films. The scheme presented here can, in principle, be used to systematically identify pathways towards ferroelectricity in other compounds as well.
The authors thank Jacob Jones for drawing their attention to this problem and for subsequent stimulating discussions. The authors also thank S. Goedecker and M. Amsler for making the minima-hopping code available. The x-ray diffraction patterns of the examined phases were simulated by fullprof fullprof while their space groups were determined by findsym findsym . Some figures in this work were rendered with vesta vesta .
References
- (1) T. S. Böscke, J. Müller, D. Bräuhaus, U. Schröder, and U. Böttger, Appl. Phys. Lett. 99, 102903 (2011).
- (2) T. S. Böscke, S. Teichert, D. Bräuhaus, J. Müller, U. Schröder, U. Böttger, and T. Mikolajick, Appl. Phys. Lett. 99, 112904 (2011).
- (3) S. Mueller, J. Mueller, A. Singh, S. Riedel, J. Sundqvist, U. Schroeder, and T. Mikolajick, Adv. Funct. Mater. 22, 2412 (2012).
- (4) J. Müller, T. S. Böscke, U. Schröder, S. Mueller, D. Bräuhaus, U. Böttger, L. Frey, and T. Mikolajick, Nano Lett. 12, 4318 (2012).
- (5) S. Mueller, C. Adelmann, A. Singh, A. Van Elshocht, U. Schroeder, and T. Mikolajick, ECS J. Solid State Sci. Technol. 1, N123 (2012).
- (6) T. S. Böscke, J. Müller, D. Bräuhaus, U. Schröder, and U. Böttger, in Proceedings of the 2011 IEEE International Electron Devices Meeting (IEDM) (IEEE, Washington, D.C., 2011), pp. 24.5.1–24.5.4.
- (7) P. D. Lomenzo, P. Zhao, Q. Takmeel, S. Moghaddam, T. Nishida, M. Nelson, C. M. Fancher, E. D. Grimley, X. Sang, J. M. LeBeau, and J. L. Jones, J. Vac. Sci. Technol. B 32, 03D123 (2014).
- (8) G. D. Wilk, R. M. Wallace, and J. M. Anthony, J. Appl. Phys. 87, 484 (2000).
- (9) H. Zhu, C. Tang, L. Fonseca, and R. Ramprasad, J. Mater. Sci. 47, 7399 (2012).
- (10) S. Goedecker, J. Chem. Phys. 120, 9911 (2004).
- (11) M. Amsler and S. Goedecker, J. Chem. Phys. 133, 224104 (2010).
- (12) S. Goedecker, in Modern Methods of Crystal Structure Prediction, edited by A. R. Oganov (Wiley-VCH, Weinheim, 2011), Chap. 7, pp. 147–180.
- (13) L. A. Shuvalov, J. Phys. Soc. Jpn. 28, 38 (1970).
- (14) R. Ruh and P. W. R. Corfield, J. Am. Ceram. Soc. 53, 126 (1970).
- (15) L.-G. Liu, J. Phys. Chem. Solids 41, 331 (1980).
- (16) J. M. Leger, A. Atouf, P. E. Tomaszewski, and A. S. Pereira, Phys. Rev. B 48, 93 (1993).
- (17) O. Ohtaka, T. Yamanaka, and S. Kume, Nippon Seramikkusu Kyokai Gakujutsu Ronbunshi 99, 826 (1991), (J. Ceram. Soc. Jpn.).
- (18) O. Ohtaka, H. Fukui, T. Kunisada, T. Fujisawa, K. Funakoshi, W. Utsumi, T. Irifune, K. Kuroda, and T. Kikegawa, J. Am. Ceram. Soc. 84, 1369 (2001).
- (19) J. Tang, M. Kai, Y. Kobayashi, S. Endo, O. Shimomura, T. Kikegawa, and T. Ashida, in Properties of Earth and Planetary Materials at High Pressure and Temperature, edited by M. H. Manghnani and T. Yagi (American Geophysical Union, Washington, D. C., 2013), pp. 401–407.
- (20) P. Hohenberg and W. Kohn, Phys. Rev. 136, B864 (1964).
- (21) W. Kohn and L. Sham, Phys. Rev. 140, A1133 (1965).
- (22) X. Gonze, B. Amadon, P.-M. Anglade, J.-M. Beuken, F. Bottin, P. Boulanger, F. Bruneval, D. Caliste, R. Caracas, M. Côté, T. Deutsch, L. Genovese, P. Ghosez, M. Giantomassi, S. Goedecker, D. Hamann, P. Hermet, F. Jollet, G. Jomard, S. Leroux, M. Mancini, S. Mazevet, M. Oliveira, G. Onida, Y. Pouillon, T. Rangel, G.-M. Rignanese, D. Sangalli, R. Shaltaf, M. Torrent, M. Verstraete, G. Zerah, and J. Zwanziger, Comput. Phys. Commun. 180, 2582 (2009).
- (23) X. Gonze, G. M. Rignanese, M. Verstraete, J.-M. Beuken, Y. Pouillon, R. Caracas, F. Jollet, M. Torrent, G. Zerah, M. Mikami, P. Ghosez, M. Veithen, J.-Y. Raty, V. Olevano, F. Bruneval, L. Reining, R. Godby, G. Onida, D. R. Hamann, and D. C. Allan, Zeit. Kristallogr. 220, 558 (2005).
- (24) C. Hartwigsen, S. Goedecker, and J. Hutter, Phys. Rev. B 58, 3641 (1998).
- (25) J. P. Perdew, K. Burke, and M. Ernzerhof, Phys. Rev. Lett. 77, 3865 (1996).
- (26) H. J. Monkhorst and J. D. Pack, Phys. Rev. B 13, 5188 (1976).
- (27) See Supplemental Material for more information reported in this paper.
- (28) S. Clima, D. J. Wouters, C. Adelmann, T. Schenk, U. Schroeder, M. Jurczak, and G. Pourtois, Appl. Phys. Lett. 104, 092906 (2014).
- (29) M. Amsler, J. A. Flores-Livas, T. D. Huan, S. Botti, M. A. L. Marques, and S. Goedecker, Phys. Rev. Lett. 108, 205505 (2012).
- (30) T. D. Huan, M. Amsler, M. A. L. Marques, S. Botti, A. Willand, and S. Goedecker, Phys. Rev. Lett. 110, 135502 (2013).
- (31) T. D. Huan, M. Amsler, R. Sabatini, V. N. Tuoc, N. B. Le, L. M. Woods, N. Marzari, and S. Goedecker, Phys. Rev. B 88, 024108 (2013).
- (32) A. F. Baldwin, R. Ma, A. Kumar M.K., T. D. Huan, C. Wang, J. E. Marszalek, M. Cakmak, R. Ramprasad, and G. A. Sotzing (unpublished).
- (33) Q. Zeng, A. R. Oganov, A. O. Lyakhov, C. Xie, X. Zhang, J. Zhang, Q. Zhu, B. Wei, I. Grigorenko, L. Zhang, and L. Cheng, Acta Crystallogr. Sect. C 70, 76 (2014).
- (34) C. Lee and X. Gonze, Phys. Rev. B 51, 8610 (1995).
- (35) X. Gonze and C. Lee, Phys. Rev. B 55, 10355 (1997).
- (36) Y. Al-Khatatbeh, K. K. M. Lee, and B. Kiefer, Phys. Rev. B 82, 144106 (2010).
- (37) J. Wang, H. Li, and R. Stevens, J. Mater. Sci. 27, 5397 (1992).
- (38) A. Heuer, V. Lanteri, S. Farmer, R. Chaim, R. Lee, B. Kibbel, and R. Dickerson, J. Mater. Sci. 24, 124 (1989).
- (39) D. B. Marshall, M. R. Jarnes, and J. R. Porter, J. Am. Ceram. Soc. 72, 218 (1989).
- (40) E. H. Kisi, J. Am. Ceram. Soc. 81, 741 (1998).
- (41) C. J. Howard, E. H. Kisi, R. B. Roberts, and R. J. Hill, J. Am. Ceram. Soc. 73, 2828 (1990).
- (42) S. E. Reyes-Lillo, K. F. Garrity, and K. M. Rabe, arXiv:1403.3878 (unpublished).
- (43) R. D. King-Smith and D. Vanderbilt, Phys. Rev. B 47, 1651 (1993).
- (44) R. Resta, Rev. Mod. Phys. 66, 899 (1994).
- (45) D. Sheppard, P. Xiao, W. Chemelewski, D. D. Johnson, and G. Henkelman, J. Chem. Phys. 136, 074103 (2012).
- (46) L. G. Wang, Y. Xiong, W. Xiao, L. Cheng, J. Du, H. Tu, and A. van de Walle, Appl. Phys. Lett. 104, 201903, (2014).
- (47) J. Rodríguez-Carvajal, Physica B 192, 55 (1993).
- (48) FINDSYM, http://stokes.byu.edu/findsym.html.
- (49) K. Momma and F. Izumi, J. Appl. Crystallogr. 41, 653 (2008).