Chromatic patchy particles: effects of specific interactions on liquid structure
Abstract
We study the structural and thermodynamic properties of patchy particle liquids, with a special focus on the role of ”color”, i.e. specific interactions between individual patches. A possible experimental realization of such ”chromatic” interactions is by decorating the particle patches with single-stranded DNA linkers. The complementarity of the linkers can promote selective bond formation between predetermined pairs of patches. By using MD simulations, we compare the local connectivity, the bond orientation order, and other structural properties of the aggregates formed by the ”colored” and ”colorless” systems. The analysis is done for spherical particles with two different patch arrangements (tetrahedral and cubic). It is found that the aggregated (liquid) phase of the ”colorless” patchy particles is better connected, denser and typically has stronger local order than the corresponding ”colored” one. This, in turn, makes the colored liquid less stable thermodynamically. Specifically, we predict that in a typical case the chromatic interactions should increase the relative stability of the crystalline phase with respect to the disordered liquid, thus expanding its region in the phase diagram.
pacs:
82.70.Dd, 07.05.Tp, 61.43.BnI Introduction
In recent years, systems of patchy particles have emerged among the key platforms for advanced self-assembly patchy1 -VKT . These are typically micron-scale colloids featuring chemically distinct regions (patches) arranged in a pre-engineered pattern on the particle surface. In most cases, the patches preferentially bind each other, thus giving rise to strongly anisotropic interparticle interactions, reminiscent of covalent bonding in chemistry. Furthermore, by decorating the patches with single-stranded DNA molecules, one can introduce multiple types of patches as well as a selective type-dependent binding through DNA hybridizationPatchy DNA . This can be interpreted as ”coloring” of patchy particles. One can expect that adding ”color” to the directionality of the interactions would lead to a greater control over the resulting morphology.
While the current interest in patchy colloidal systems is motivated primarily by their potential for programmable self-assembly of ordered structures, the study of their disordered phases is of great conceptual importance as well Sciort_2013 -VKT . In particular, this provides valuable insights both into the equilibrium phase behavior and kinetics of self-assembly. For instance, Smallenburg and Sciortino Sciort_2013 have recently demonstrated that the ground state of a system of patchy particles need not be a crystal, even when the particles themselves are highly symmetric. Specifically, for the case of four-patch particles with tetrahedral symmetry, the Cubic Diamond (CD) crystal becomes the thermodynamically preferred state only in the limit of strong bond directionality, i.e. a very small patch size. Otherwise, the system can achieve its maximum connectivity without sacrificing all of its configurational entropy, and thus preserving the liquid-like order. A similar conclusion was reached independently in our recent study VKT . Rather than exploring the equilibrium phase behavior, we were interested in the structural properties of the random liquid-like aggregate formed from a low density gas of patchy particles. Remarkably, the four-patch system demonstrates a relatively high degree of local ordering upon aggregation, as opposed to the six-patch particles with cubic symmetry. We explained this difference by observing that the the coordination number is the maximum connectivity of a disordered aggregate under an assumption that the patches are point-like but the bond directionality is not extreme. Therefore, the four-patch particles may have all their patches connected without forming a crystalline state, in contrast to the six-patch system.
In this work, we expand the previous analysis to study the effects of ”chromatic” interactions between the patches on the structural and thermodynamic properties of the liquid phase. One might expect that the bond directionality when combined with the color-based selectivity (e.g., due to DNA functionalization of the patches) should lead to stronger ordering and better programmability of the self-assembled structures AT1 -AT2 . As in our previous study, we analyze both 4-patch particles with tetrahedral symmetry (4pch) and 6-patch particles with cubic symmetry (6pch). For each of these systems, we consider two extreme cases: when all the patches are equivalent (”colorless” system), and when all patches that belong to the same particle are of different colors, and their pairwise interactions are subject to a complementarity rule (”colored” system).
II Model and numerical algorithm
In our model, we describe a patchy particle as a solid sphere of diameter . Patches are located on the surface of this sphere and rotate with it.
The motion of a single particle is represented as a combination of a translational displacement of its center and a rotation of the particle around it. In order to take into account the rotational degrees of freedom, we describe the orientations of the particles with quaternions.
Interactions between the patches satisfy the following rules. In the colored case, only complementary pairs of patches , , , and attract each other. Interactions between other, non-complementary, pairs such as , , etc., are absent. In the case of colorless particles, every pair of patches are mutually attractive.
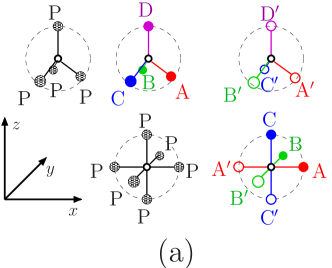
At the start of simulation, the position of the -th patch of the -th particle with respect to the particle center is given by vector . The system of colored 4pch particles is binary. A ”primary” 4pch particle has the following patch positions: (A type), (B type), (C type), and (D type). A ”complementary” particle is a mirror image of a ”primary” one, with patches located at the positions , respectively (see Fig. 1(a)). For the colored 6pch particle, the complementary patches are located opposite to each other: for and , for and , for and .
In our description, vector represents the position of the particle at time . The orientation of that particle is described by unit quaternion . This quaternion has a form , where unit vector defines the rotation axis passing through the center of the particle and is the angle of rotation around this axis (see, e.g., Ref. EQ, ).
The location of the -th patch of that particle is therefore given by . Here denotes the quaternion product, and is the corresponding conjugated quaternion.
This quaternion-based approach can be used for Molecular Dynamic (MD) simulations of rigid objects EM . There are two types of interactions in our model. Patchy particles repel each other with the following isotropic short-range potential:
| (1) |
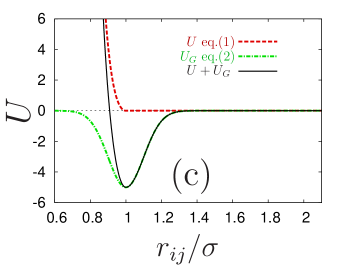
where is the standard Lennard-Jones potential, is its derivative, is the interaction distance (equivalent to the particle diameter) as well as cut-off distance, is the interaction strength, and is the vector connecting the centers of the -th and the -th particles (see Fig. 1(c), dashed line). The potential is expressed in units of , which is the fundamental energy scale in our problem. In addition to this isotropic interparticle repulsion, the patches that belong to different particles and satisfy complementarity rule (in the colored case) attract each other with a Gaussian potential:
| (2) |
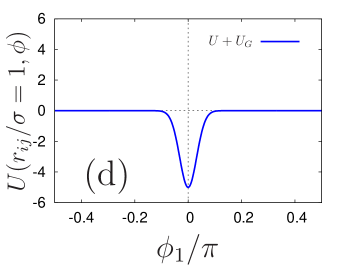
where is the vector connecting the patch of the particle and the patch of the particle , is the half-width of the interaction and is the strength of the interaction in units of . In Fig. 1(c) we plot both potentials (for ) as well as their sum (shown by the solid line). The potentials are shown as functions of the normalized distance between the two particle centers for the case when the centers and the attracting patches are located on the same line. The cut-off distance for the Gaussian potential is . In Fig. 1(d) the angular dependence of potential is plotted for a fixed interparticle distance, (Fig. 1(c) corresponds to ).
From a known set of displacements and orientations of all particles one can compute a set of total forces and torques acting on them:
| (3) |
Here is the moment of inertia, and are linear and angular accelerations, respectively. All lengths are measured in units of particle radius . The mass of a particle is , the moment of inertia of a solid sphere is .
We use the Verlet numerical algorithm with the time step for the numerical integration of Eq. (3). The coupling to a thermal bath is represented by the Langevin noise added to the forces and torques in Eq. (3): and . Here is the friction coefficient for the solvent viscosity . The strengths of delta-correlated noise terms and are set by the Fluctuation-Dissipative theorem: , . In our units (, , ), the friction coefficient has a meaning of the diffusion time of a particle over the distance equal to its radius. On the other hand, the time constant corresponds to the crossover from the ballistic to the diffusion regime of motion. We set , so that the dynamics of a particle is Brownian on times .
In our simulations, the control parameter is the interaction strength . For small values of , the system is in a gas phase; for large values of , it exhibits an aggregation into an amorphous ”liquid” phase. We simulate a set of particles in a cubic box of size with periodic boundary conditions. The volume fraction for this system is . To verify the robustness of our results, we have performed additional simulations of the ”colored” 4pch system for volume fractions twice as large, , and half the reference value, . This did not result in any significant variation, aside from the logarithmic shift of the value of at which aggregation is observed, in a good agreement with theoretical expectations. Indeed, in a simple example of the reaction “monomer+monomer dimer”, the density renormalization can be offset by a logarithmic shift of the interaction potential . A similar logarithmic shift is expected for the case of coexistence of an extended aggregate with a gas of monomers. The simulation time is set to t=10000, which is sufficient for most observables to reach their saturation values. Note that the inter-patch binding remains reversible at this time scale, except for very high interaction strength, .
III Results and Analysis
III.1 Topological Characterization
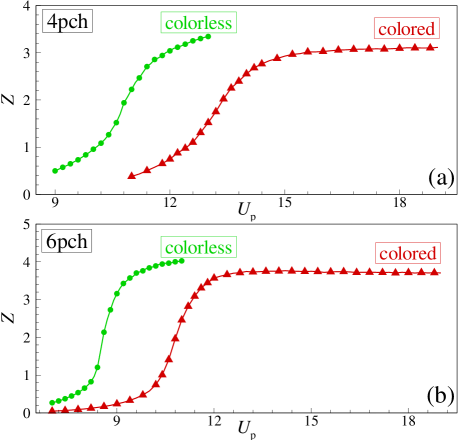
Two patches are considered to be bound if the distance between their centers is less than the half-width . We define a pair of particles to be topological nearest neighbors (NNs) if there is such a bond formed between their patches. This definition is robust with respect to the choice of the threshold length since the interacting patches are strongly localized relative to each other. The computed values of the mean coordination number (i.e. the number of NNs) are plotted in Fig. 2 vs. interaction strength , for 4pch (a) and 6pch (b) systems. As increases, all the systems undergo transitions from a gas to an amorphous aggregate.
From the thermodynamic point of view, the instability of the uniform gas of particles towards the formation of a dense aggregate corresponds to its spinodal decomposition. When this occurs, the aggregate is essentially an early liquid phase. The reversibility of the interparticle bonding (at ) implies that the local structure of the aggregate is similar to the bulk liquid. It should be noted, however, that the relaxation of clusters to spherical droplet shapes is a much slower process not captured in our study. In view of this, and due to the finite system size, there is always an interfacial correction to any of the thermodynamic observables reported below. Partially because of this limitation, we do not use our data to directly compare the thermodynamics of the liquid and crystalline phases. Instead, we are focused on a specific aspect of the problem: the effect of chromatic interactions on structural and thermodynamic properties of the liquid.
The aggregation is reflected by a gradual change of the coordination number from (unbound particles), to a certain saturation value . The latter is the characteristic of the liquid phase and its value depends on the system. In particular, both colored and colorless 6pch particles form aggregates with close to 4 (4.2 and 3.8, respectively). 4pch systems exhibit a somewhat lower connectivity: for the colored and for the colorless one.
The intermediate values of the mean NN number correspond to the coexistence of the condensed liquid phase with a gas of single particles and smaller clusters. All these cases support our earlier argument that the coordination number plays a special role for a patchy liquid in d-dimensional space VKT . This value emerges from the comparison of the number of mechanical constraints with the number of translational degrees of freedom. The rotational degrees of freedom are not taken into account in this counting since a much stronger patch-patch localization is required in order for them to be frozen. The fact that is somewhat below 4 for 4pch system is also natural as is the maximum possible number of bonds for these particles, and some of the patches remain unbound, especially for the colored system. One could expect to be reached in the limit of very strong attraction, but that regime is not accessible partially because of the finite size effects, and also since the binding becomes nearly irreversible on the timescale of the simulations when the interactions are stronger than the threshold value, .
III.2 Chromatic Effect on Thermodynamics
The colored patchy particles exhibit aggregation at a significantly higher interaction strength than the corresponding colorless ones. Co-existence of the liquid-like aggregate with the gas of particles implies that the chemical potential is the same in both phases. Therefore, onset of the condensation approximately corresponds to the point at which the chemical potential of the free particle gas, is equal to that of the liquid phase. The shift of the aggregation curves, , between the colorless and the corresponding colored system shown in Fig. 2, can be related to the difference in the chemical potential between the two aggregates, taken at the same interaction potential. Indeed, should be offset by the difference in the interaction energy per bond:
| (4) |
Here, is the average number of bonds per particle in the aggregate.
This estimate gives for both 4pch and 6pch systems. More reliably the free energy of the aggregated phase can be found by the thermodynamic integration TI :
| (5) |
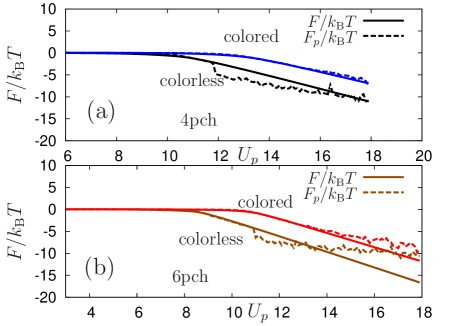
Here, is the ensemble averaged potential energy per particle, and is the Helmholtz free energy per particle. The uniform gas phase that corresponds to is chosen as a reference state, . In this calculation we took into account the fact that is expressed in units of . We ignore the kinetic energy contribution to since it is completely decoupled from any structural transformation in non-quantum systems.
The chemical potential can be calculated as the Gibbs free energy per particle. In the limit of a completely aggregated state (high value of ), the pressure coming from the dispersed particles can be neglected, and the Helmholtz and Gibbs free energies become identical; i.e. . According to the results of thermodynamic integration, presented in Fig. 3, the chemical potential of the colored aggregate is increased with respect to the colorless one by an amount well described by a linear function of :
| (6) |
Here, for 4pch and for 6pch. In both these cases, this ”chromatic” correction is close to near the aggregation point, in a good agreement with our earlier rough estimate. Furthermore, the result of integration can be independently related to the fraction of particles in the gas phase, . Namely, the chemical potential of a gas of unbound particle can be expressed in terms of their volume fraction, as . The Helmholtz free energy per particle differs from the chemical potential by the amount , where pressure is proportional to the number density of all the dispersed objects, including the individual particles and the bigger clusters. In the regime when this correction is relevant (i.e. of the order of ), the pressure is dominated by the contribution from the gas of single particles, . Therefore, . This leads to an alternative expression for :
| (7) |
Here, we have subtracted the Helmholtz free energy of the uniform gas phase, to keep the same reference state as in Eq. (5). While this method is significantly less accurate than the thermodynamic integration (as can be seen in Fig. 3), it provides an additional verification for our results.
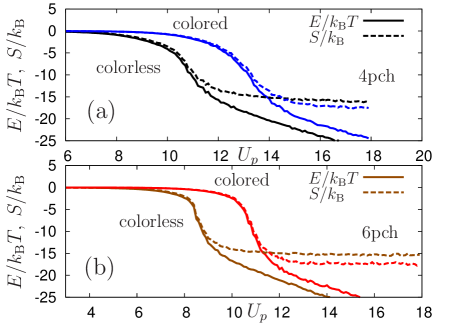
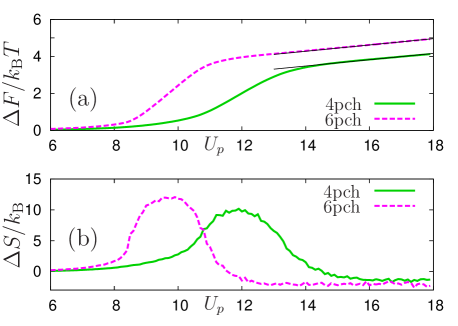
One can also separate the entropic and energetic contributions to the chromatic free energy correction, Eq. (6), by noting that . The corresponding data are presented in Fig. 4. For both 4pch and 6pch systems, the entropic correction reaches a constant value very close to the corresponding parameter in Eq. (6). Hence, the linear term represents the energy correction, due to the lower number of NNs in the colored case. Within this interpretation, the coefficient should be close to , implying that is the difference in the mean coordination number between the respective colored and colorless systems. The value of this parameter is indeed consistent with the data in Fig. 2. The free energy difference (in units) and the entropy difference (in units) for the colored and colorless systems are plotted in Fig. 5.
III.3 Comparison to Crystal Phase
The computed effect of the chromatic interactions on the thermodynamics of the liquid phase can be compared to the similar effect expected in the crystal phase. Note that the colored and colorless systems when arranged into an ideal crystalline configuration are locally indistinguishable: they have the same ground state energy and the same vibrational modes, unless the coloring is inconsistent with the given crystal lattice. Therefore, the only difference in their free energies is due to configurational entropy. Specifically, that the colorless particles have a larger number of equivalent orientational states that would preserve the bonds with their neighbors. There are 12 such orientations of a colorless 4pch particle and 24 for the case of 6pch system. The resulting difference in the chemical potential between the colorless and colored system is purely entropic, and , respectively.
On the one hand, this entropic correction is greater than that computed for the corresponding liquid phases ( and ). However, this entropic effect is easily offset by the energy difference. Indeed, according to Eq. (6), becomes greater that the corresponding correction for the crystal ( and respectively) once the interaction parameter exceeds . While the parameter itself is model specific, this interaction strength is definitely insufficient to condense the dispersed particle system even at the relatively high volume fraction used in our simulations.
We therefore expect that in a generic case where the patch-patch interaction is sufficient for the aggregation of a dilute colloidal suspension, the ordered phase will gain additional stability due to the chromatic interactions. In other words, if we start with the colorless system, and make the patches colored with the color-specific binding, this would lead to free energy penalty both to the crystal and liquid phases, but the latter penalty would be greater. The colored and colorless systems are certainly physically distinct, so these free energy differences are not directly measurable. However, we use the gas phase at the same concentration as a reference state for all the cases, which allows us to determine the effect of coloring on the relative stability of the liquid and crystal phases.
It should be emphasized that we do not perform a direct comparison of the liquid to the crystal, instead we only evaluate the strengths of the chromatic effects for each of the phases separately. While the one for the crystal is obtained based on an analytic argument, the effect on the bulk liquid is extracted from our MD simulations and therefore may have errors coming from interfacial effects. One can estimate the role of the interface by noting that the average coordination number of colorless 4pch aggregate, deviates from its maximum possible value 4 by approximately . This sets an upper bound on the strength the interfacial/finite size correction to the overall free energy when compared to the bulk liquid. We therefore expect that the presence of an extended interface should result a similar correction to the chromatic effect itself. Such a correction would not alter our main conclusions in any significant manner.
III.4 Local Connectivity and Correlations
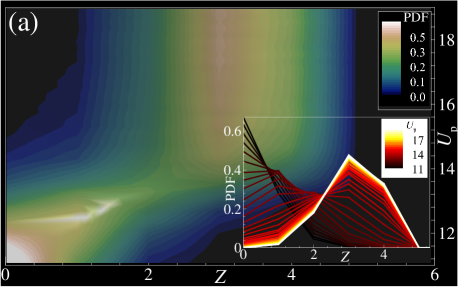
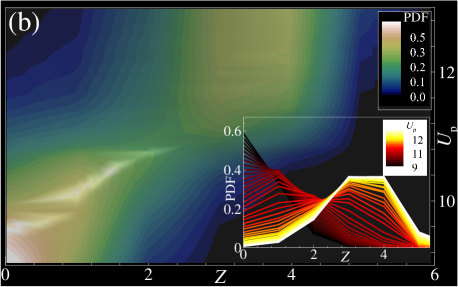
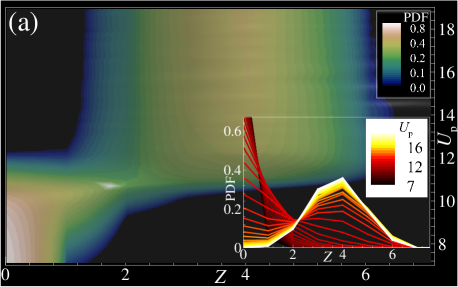
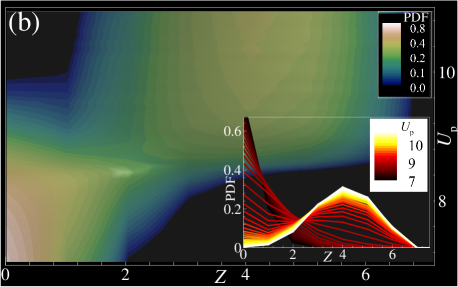
Fig. 2 indicates only a modest difference in the maximum values of the mean coordination number between the colored and colorless systems. However, the detailed analysis of its PDFs reveals a much greater qualitative contrast. Figs. 6-7 show the influence of the color of the patches on the distribution of the number of NNs for 4pch and 6pch systems, respectively. As interaction strength increases, the systems form amorphous aggregates VKT with nearly constant distributions of the topological NNs. This transition is clearly seen in Figs. 6-7 for all the four cases.
The colored 4pch system is dominated by particles with , while its colorless counterpart has a much larger fraction of particles with completely saturated bonds, i.e. . This must be a result of additional constraints imposed by the coloring of the patches. A similar trend, although not as pronounced, is also seen for the 6pch particles.
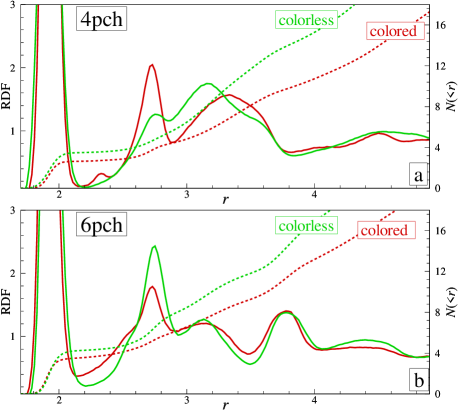
An alternative characterization of the local structure in the aggregated liquid phase is provided by the radial distribution function , shown in Fig. 8 for the 4pch and 6pch systems, both colored (red curves) and colorless (green curves). Additionally, the average number of particles inside of a sphere of radius , , are presented on the same plots. There is a clear correspondence between the topological NNs discussed above, and the geometrical NNs represented by the first peak in : their number is also close to , and it is slightly lower for the colored system than for the colorless one. The analysis of the cumulative curves reveals that aggregates of the colorless patchy particles are somewhat denser than those of colored ones, which is consistent with our observation that they are also more connected.
III.5 Orientational Order
To further characterize the local structural properties of the patchy system, we use the bond orientational order parameter method stein , which has been widely used in the context of condensed matter physics stein , hard sphere hs1 ; hs2 ; hs3 and Lennard-Jones systems lja ; ljb ; ljn ; ljc , complex plasmas cp0 ; cp1 ; cp2 ; pu , colloidal suspensions coll1 ; coll2 , metallic glasses mg , confined films nc ; ncc , granular media, etc. Within this method, the rotational invariants of rank of both the second and the third order are calculated for each particle in the system from the vectors (bonds) connecting its center with the centers of its nearest neighboring particles
| (8) |
| (9) |
where , are the spherical harmonics and are the vectors connecting the centers of particles and . We note that the bond order parameters scale as ; so, in general, these parameters are much more sensitive to the local orientational order in comparison with . Here, to define structural properties of patchy particles, we calculate the rotational invariants , for each particle that has the maximum number of NNs: , respectively. The first shells of the ideal 4pch and 6pch systems correspond to the cubic diamond (CD) and the simple cubic (SC) arrangements, respectively.
The values of the corresponding rotational invariants and for the perfect patchy crystals are shown in Table 1.
| system | structure | ||||
|---|---|---|---|---|---|
| 4pch | CD (1st shell, 4 NNs) | 0.509 | 0.628 | -0.159 | -0.013 |
| 6pch | SC (1st shell, 6 NNs) | 0.76 | 0.35 | 0.159 | 0.013 |
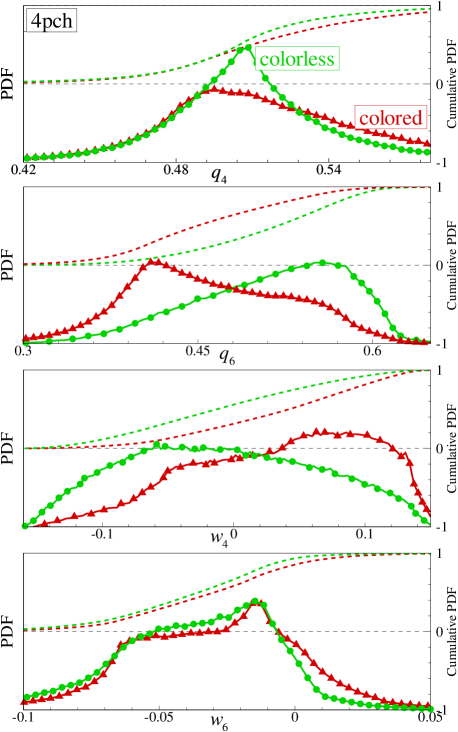
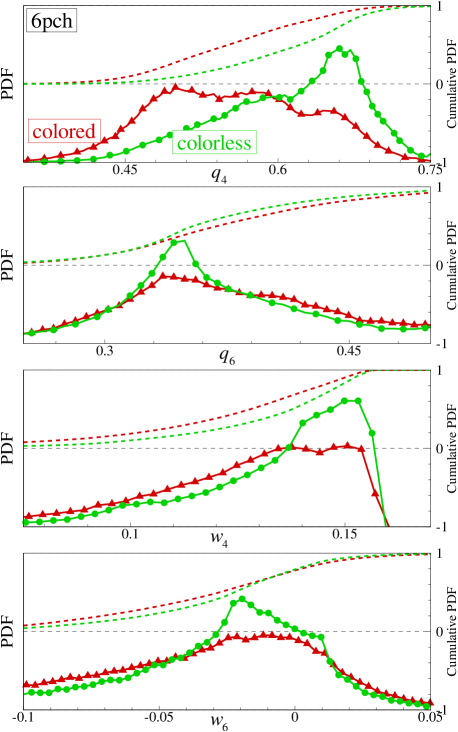
The characterization of the local bond orientation order for 4pch and 6pch aggregates is presented in Fig. 9 and Fig. 10 respectively, both for the colored (triangles) and the colorless (circles) cases. The probability distribution functions and of the rotational invariants and (), and their cumulative distributions shown in the figures, reveal that the colorless systems are more ordered than the colored ones. Specifically, for the colorless system the PDFs exhibit broad yet pronounced peaks at the locations expected for the corresponding perfect crystal. The colored liquid is significantly less ordered, which is in a general agreement with the observation that it is less connected and more frustrated due to the color constraints, and with the fact that it is less stable thermodynamically.
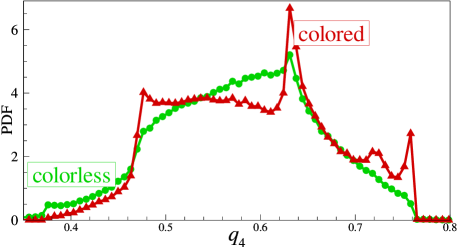
This mostly coherent picture is however challenged when we analyze the local bond orientation order for the subset of 4pch particles with a smaller number of NNs, . In particular, we distinguish a striking example of that indicates remarkable enhancement of the local order in the colored system compared to the colorless one (see Fig. 11). A possible explanation of this anomaly is that additional bonds in the colorless system come at the expense of deformation of the network, and the resulting strain affects weaker connected nodes more strongly than those with . Indeed, if we imposed a condition that each interparticle bond is perfectly aligned with the vector pointing towards the center of the patch, the maximum average coordination number that could be achieved would be . As we have discussed in our earlier work VKT , this constraint is typically unrealistic, and the coordination number is expected to be larger (tending towards , consistently with the present results). These additional bonds however do result in a modest bond rotation and strain in the particle network. Presumably, this leads to the suppression of local order near particles in the better connected colorless system.
IV Conclusions
The central conclusion of our study is that the colored patches provide an important additional element of control over the self-assembled structures. In our work, we considered the early stages of liquid formation from a gas of patchy particles, both colored and colorless. We analyzed the structural and thermodynamic properties of the aggregated phase and concluded that the colorless patchy systems are typically more connected, denser and more ordered than the corresponding colored ones. The only identified anomaly that goes against this general trend deals with the local bond orientation order near 4pch particles with coordination number . That type of order is noticeably increased when the chromatic interactions are introduced.
By means of thermodynamic integration, we were able to compute the chromatic correction to the chemical potential of the aggregated phase, which we treat as a model for the bulk liquid. On the other hand, we evaluated a similar correction to the crystal phase based on an analytic entropic argument. By comparing the two results, we predict that in a generic case, the chromatic interaction between patches would lead to a greater free energy penalty for the disordered liquid phase than for the corresponding ordered structure. This implies an enhanced stability of crystals made of the colored patchy particles compared to the uncolored ones. In particular, we expect that the limitation on the patch size required for the crystallization according to Ref. Sciort_2013, would be less severe in the chromatic case.
The chromatic interactions discussed in this work may be employed not only to shift the balance in the order-disorder transitions, but also to select a desired self-assembled structure in the case of crystalline polymorphism. The classical example of that kind is the competition between cubic and hexagonal diamond lattices (CD and HD), both of which have identical tetrahedral arrangement of NNs. It is an attractive idea to select a specific lattice by chromatic patch-patch interactions. Unfortunately, our binary system of 4pch particles does not provide sufficient control for that: both CD and HD are possible with the same set of particles. However, it should be possible to control the outcome in polymorphic system if more than two particle types are used. This constitutes an intriguing conceptual problem for future study.
This study is supported by European Research Council under FP7 IRSES Marie-Curie grants PIRSES-GA-2010-269139 and PIRSES-GA-2010-269181. Research carried out in part at the Center for Functional Nanomaterials, Brookhaven National Laboratory, which is supported by the U.S. Department of Energy, Office of Basic Energy Sciences, under Contract No. DE-AC02-98CH10886. BAK was supported by the Russian Science Foundation, Project no. 14-12-01185.
References
- (1) S.C. Glotzer and M.J. Solomon, Nature Materials 6, 557 (2007).
- (2) V.N. Manoharan, M.T. Elsesser, and D.J. Pine, Science 301, 483 (2003).
- (3) Y. Wang, Y. Wang, D.R. Breed, V.N. Manoharan, L. Feng, A.D. Hollingsworth, M. Weck, and D.J. Pine, Nature 491, 51 (2012).
- (4) F. Romano, E. Sanz and F. Sciortino, J. Chem. Phys. 134, 174502 (2011).
- (5) F. Romano, E. Sanz, and F. Sciortino, J. Phys. Chem. B 113, 15133 (2009).
- (6) E.G. Noya, C. Vega, J.P.K. Doye, and A. A. Louis, J. Chem. Phys. 132, 234511 (2010).
- (7) Z. Zhang, A.S. Keys, T. Chen, and S.C. Glotzer, Langmuir 21, 11547 (2005).
- (8) N. Kern and D. Frenkel, J. Chem. Phys. 118, 9882 (2003).
- (9) F. Smallenburg and F. Sciortino, Nature Physics 9, 554 (2013).
- (10) D. de las Heras, J.M. Tavares, M.M. Telo da Gama, Soft Matter 8, 1785 (2012).
- (11) O.A. Vasilyev, B.A. Klumov, A.V. Tkachenko, Phys. Rev. E 88, 012302 (2013).
- (12) A.V. Tkachenko, Phys. Rev. Lett. 106, 255501 (2011).
- (13) J.D. Halverson, and A.V. Tkachenko, Phys. Rev. E 87, 062310 (2013).
- (14) D.J. Evans, Mol. Phys. 34, 317 (1977).
- (15) D.J. Evans, S. Murad Mol. Phys. 34, 327 (1977).
- (16) T. P. Straatsma and H.J.C. Berendsen, J. Chem. Phys. 89, 5876 (1988).
- (17) P. Steinhardt, D. Nelson, and M. Ronchetti, Phys. Rev. Lett. 47, 1297 (1981); P. Steinhardt, D. Nelson, and M. Ronchetti, Phys. Rev. B 28, 784 (1983).
- (18) I. Volkov, M. Cieplak, J. Koplik, and J.R. Banavar, Phys. Rev. E 66, 061401 (2002).
- (19) T. Aste, M. Saadatfar, A. Sakellariou, and T.J. Senden, Physica A 339, 16 (2004); T. Aste, J. Phys.: Condens. Matter 17, S2361 (2005).
- (20) B. A. Klumov, S. A. Khrapak, and G. E. Morfill, Phys. Rev. B 83, 184105 (2011).
- (21) P.R. ten Wolde, M.J. Ruiz-Montero, and D. Frenkel, J. Chem. Phys. 104, 9932 (1996).
- (22) M.D. Rintoul and S. Torquato, J. Chem. Phys. 105, 9528 (1996).
- (23) W. Lechner and C. Dellago, J. Chem. Phys. 129, 114707 (2008).
- (24) B.A. Klumov, JETP Lett. 98, 259 (2013); B.A. Klumov, JETP Lett. 97, 372 (2013).
- (25) G. E. Morfill, A.V. Ivlev, S.A. Khrapak, B.A. Klumov, M.Rubin-Zuzic, U. Konopka, and H.M. Thomas, Contrib Plasma Phys. 44, 450 (2004).
- (26) B. Klumov, P. Huber, S. Vladimirov, H. Ivlev, G. Morfill, V. Fortov, A. Lipaev, and V. Molotkov, Plasma Phys. and Controll. Fusion 51, 124028 (2009).
- (27) B. Klumov, G. Joyce, C. Räth, P. Huber, H. Thomas, G.E. Morfill, V. Molotkov, and V. Fortov, EPL 92, 15003 (2010).
- (28) B.A. Klumov, Phys. Usp. 53, 1053 (2010).
- (29) U. Gasser, E.R. Weeks, A. Schofield, P.N. Pusey, and D.A. Weitz, Science 292, 5515 (2001).
- (30) T. Kawasaki and H. Tanaka, J. Phys.: Condens. Matter 22, 232102 (2010).
- (31) A. Hirata, L.J. Kang, T. Fujita, B. Klumov, K. Matsue, M. Kotani, A.R. Yavari, and M.W. Chen, Science 341, 376 (2013).
- (32) B.A. Klumov and G.E. Morfill, JETP Lett. 85, 498 (2007); B.A. Klumov and G.E. Morfill, JETP 107, 908 (2008).
- (33) Y. Peng, Z.R. Wang, A.M. Alsayed, A.G. Yodh, and Y. Han, Phys. Rev. E 83, 011404 (2011).