Two New Halo Debris Streams in the Sloan Digital Sky Survey
Abstract
Using photometry from Data Release 10 of the northern footprint of the Sloan Digital Sky Survey, we detect two new stellar streams with lengths of between and . The streams, which we designate Hermus and Hyllus, are at distances of between 15 and 23 kpc from the Sun and pass primarily through Hercules and Corona Borealis. Stars in the streams appear to be metal poor, with [Fe/H] , though we cannot rule out metallicities as high as [Fe/H] = -1.2. While Hermus passes within (in projection) of the globular cluster NGC 6229, a roughly one magnitude difference in distance modulus, combined with no signs of connecting with NGC 6229’s Roche lobe, argue against any physical association between the two. Though the two streams almost certainly had different progenitors, similarities in preliminary orbit estimates suggest that those progenitors may themselves have been a product of a single accretion event.
Subject headings:
globular clusters: general — Galaxy: Structure — Galaxy: Halo1. Introduction
The number of known nearby halo streams (i.e. streams that we can trace in configuration space over an appreciable portion of their orbits around the Galaxy) currently stands at 18 (Grillmair, 2010; Bonaca et al., 2012; Grillmair et al., 2013; Koposov et al., 2014; Martin et al., 2014). Since we can in principle measure all six phase space coordinates for the stars in such streams, they have the potential to significantly improve our understanding of the mass distribution in the Galaxy, particularly in regions where we have no comparable tracers (Deg & Widrow, 2014; Law, Majewski, & Johnston, 2009; Newberg et al., 2010; Koposov, Rix, & Hogg, 2010). The coldest streams (e.g. Palomar 5, GD-1, with velocity dispersions of km/s) are particularly interesting as they may provide a sensitive means of detecting the presence and abundance of dark matter subhalos (Carlberg, 2009; Yoon, Johnston, & Hogg, 2011; Carlberg & Grillmair, 2013).
In this paper we reexamine a portion of the northern imaging footprint of the Sloan Survey. Using photometrically filtered star counts we detect two long, nearly parallel overdensities whose orientations, morphologies, and color-magnitude distributions are consistent with stellar debris streams at distances of 18 and 21 kpc. We briefly describe our analysis in Section 2. We characterize the new streams in Section 3 and we put preliminary constraints on their orbits in Section 3.1. We make concluding remarks in Section 4.
2. Data Analysis
Photometric data in , and for stars with were extracted from the SDSS DR10 release (Ahn et al., 2014). We dereddened the photometry as a function of sky position using the DIRBE/IRAS dust maps of Schlegel, Finkbeiner, & Davis (1998), corrected using the prescription of Schlafly & Finkbeiner (2011). We constructed color-magnitude filters in g-r and g-i using the observed main sequence and red giant branch color-magnitude locus of the metal poor globular cluster NGC 5053. The use of matched filters for highlighting particular stellar populations has been described at length by Rockosi et al. (2002) and Grillmair (2009).
The color-magnitude distribution of field stars was sampled over most of the survey area, with the exception of regions occupied by known streams (see Grillmair 2010 for a list). We applied the filters to the entire survey area, and the resulting weighted star counts were summed by location on the sky, using pixels in size, to produce two dimensional, filtered surface density maps. The g-r and g-i maps were then coadded to improve the signal-to-noise ratio.
To identify features caused by calibration or completeness discontinuities between survey scans, we chose to work in the Sloan survey coordinates and . Discontinuities between scans are then confined to run primarily along the coordinate and can more easily be identified and discounted.
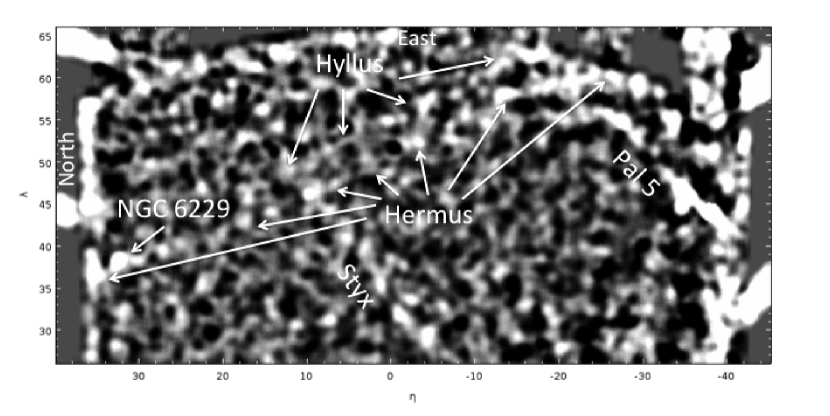
The surface density of the filtered field star population was modeled by first masking the new streams, and then smoothing the 2d surface density map with a Gaussian kernel of width This smooth background model was then subtracted from the original and the result, smoothed with a kernel of width is shown in Figure 1. Note that this figure has been optimized for a distance of 18 kpc by shifting the NGC 5053-based color magnitude filters faintward by 0.2 magnitudes.
3. Discussion
The two new streams appear as long, nearly parallel, nearly great-circle enhancements extending through the constellations Hercules and Corona Borealis. The streams show no correlation with reddening maps of the region (Schlegel, Finkbeiner, & Davis, 1998) and stand out strongly when blinking against surface density maps optimized for different distances or metallicities. The streams appear somewhat fragmented, with numerous lumps and gaps which may be products of either epicyclic motions of constituent stars (e.g. Küpper et al.2012) or of encounters with massive structures in the halo and/or disk. Following Grillmair (2009), we designate the new streams Hermus and Hyllus, after two neighboring rivers in The Illiad. At their southern ends, both Hermus and Hyllus appear to run off the edge of the survey footprint. Hermus extends completely across the footprint and terminates at its northern edge, while Hyllus appears to peter out at .
The southernmost of Hermus curves in a direction opposite to that of the northern Combined with a rather indistinct and confused region connecting the southern and northern portions, this creates some uncertainty as to whether the two features are part of the same stream. The changing curvature is due primarily to the coordinate system used. However, we find that while it is easy to find orbits that fit either the northern or southern portions of the stream individually, attempts to fit both sections simultaneously result in significantly poorer fits, with the southern portion of the predicted orbit lying to the west of the stream. This may be a consequence of the fact that tidal streams do not lie precisely along a single orbit (Eyre & Binney, 2011), or of inadequacies in our adopted model of the Galaxy. However, it may also be that, despite striking similarities in distance and orientation, the northern and southern portions of Hermus are physically unrelated. Kinematic information will be required before we can further test this hypothesis.
The northern of Hermus can be well-described in J2000 equatorial coordinates (to within ) using a polynomial of the form:
| (1) |
The entire of Hermus requires a higher-order fit, and can be described to within using:
| (2) |
Though Hyllus shows no appreciable curvature in Figure 1, the transformation to J2000 equatorial coordinates requires a second order fit to match the stream to within
| (3) |
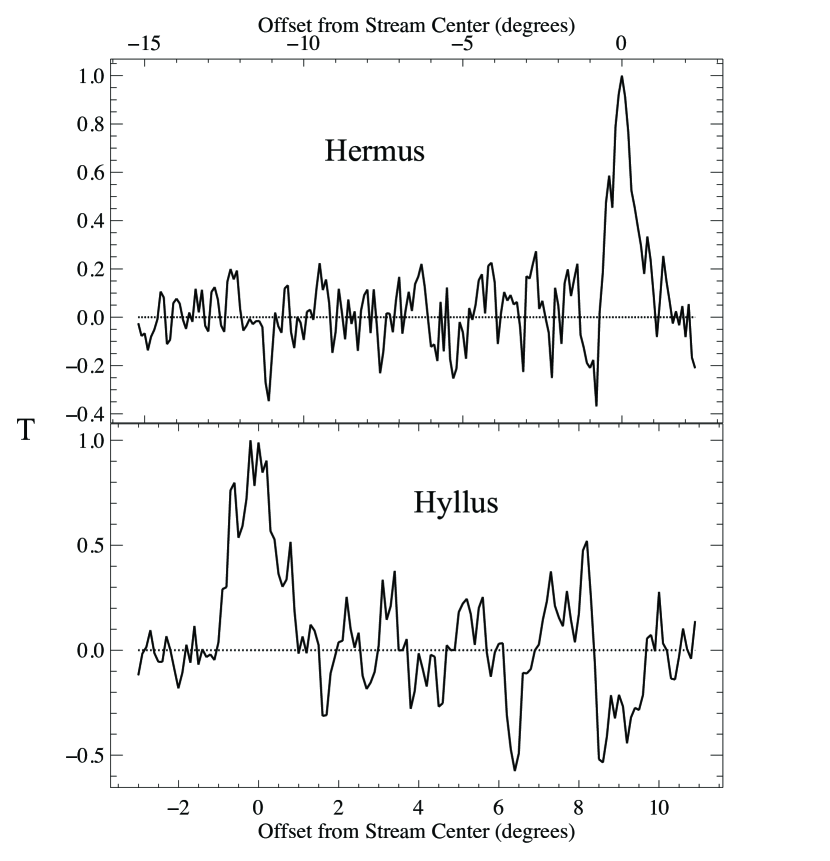
To estimate the significance of the streams above the background, we employ the T-statistic of Grillmair (2009), which measures the median contrast along its length between a stream and the surrounding field. Figure 2 compares the signals of the two streams with the field extending to the west (Hermus) and to the east (Hyllus). Both Hermus and Hyllus are detected at the level. The lateral full-width-at-half-maxima of Hermus and Hyllus are and respectively. We note that the broad width of Hyllus appears to be influenced by two or more strong features along its length that may or may not be related to the stream. If we ignore these features and measure the width at less confused portions of the stream, we find a FWHM of . At mean distances of 18 and 21 kpc (see below), these correspond to spatial widths of and 180 pc, respectively. These widths are considerably narrower than the kpc widths associated with presumed dwarf galaxy streams (Majewski et al., 2003; Grillmair, 2006a, b; Belokurov et al., 2006, 2007; Grillmair, 2009), and we conclude that the progenitors of Hermus and Hyllus were most likely globular clusters. The stream widths are broader than several known or presumed globular clusters streams (e.g. Pal 5, GD-1) but are similar to the pc width of the Eastern Banded Structure, which Grillmair (2011) suggested is a globular cluster stream which has been subject to significant heating over time (Carlberg, 2009).
Hermus passes within about of NGC 6229, a globular cluster visible in Figure 1 near the northern edge of the SDSS footprint. However, Hermus appears to continue past NGC 6229 with no evidence for the characteristic S-curve that would be expected to connect to both NGC 6229 and to a trailing stream on the opposite side of the cluster. Moreover, the published distance of NGC 6229 is 30 kpc (Harris, 1996), well outside the error bound for our distance estimate for Hermus. NGC 6229 is most pronounced in our surface density maps when we use a filter shifted at least one magnitude fainter than a filter that optimizes the strength of Hermus itself. We conclude that Hermus and NGC 6229 are not physically associated.
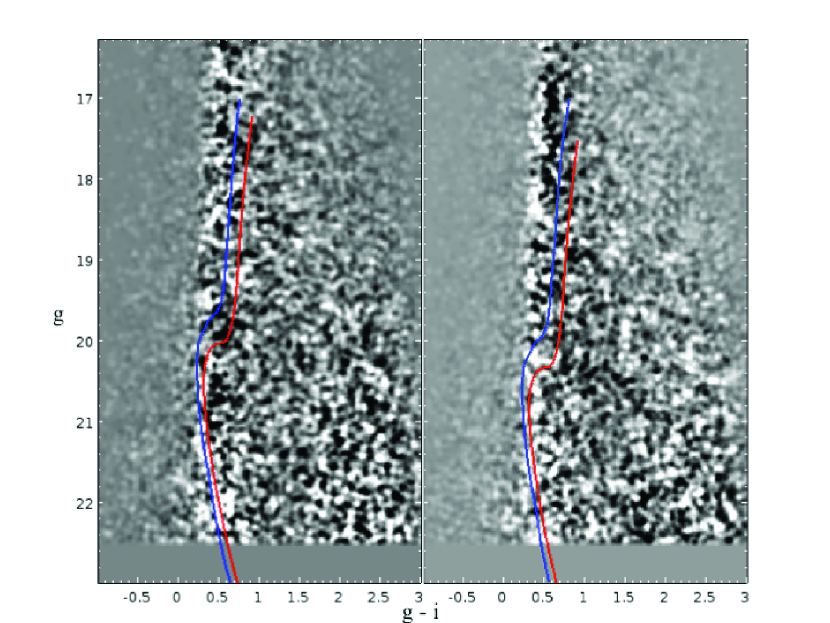
Color-magnitude diagrams (CMDs) for Hermus and Hyllus are shown in Figure 3. These distributions were determined by using Equations 2 and 3 to select stars within of the centerline of each stream. Similar regions, wide on either side of the stream and laterally offset by , were used to sample the field star population. Scaling the latter to the former by area, the CMDs in Figure 3 are a subtraction of the two. While not strong, main sequence loci are clearly visible. In both cases, most of the signal in Figure 1 relies on stars with . Experimentation shows that the stream signals are maximized when using a filter constructed from the CMD locus of NGC 5053, which has [Fe/H] = (Harris, 1996). However, examination of Figure 3 suggests that we cannot exclude metallicities as high as [Fe/H] = . Spectroscopy will be required to better constrain the metallicities in these streams.
We estimate the distances to the streams by shifting our filter brightward and faintward. We use only the portion of the NGC 5053 locus fainter than one magnitude below the main sequence turn-off to avoid introducing uncertainties due to the unknown ages of the stars in these streams. We find the northern end of Hermus peaks at a magnitude offset relative to NGC 5053 of mag, the central portion () at mag, while the southern end peaks at a relative offset of mag. Adopting a distance to NGC 5053 of 16.9 kpc (Harris, 1996), we find that the northern end of the stream is at a heliocentric distance of kpc, the central portion at kpc, and the southern end is at kpc.
For Hyllus, we find offsets of and mag at the northern and southern ends, respectively. This yields estimated distances of and kpc.
Integrating the background-subtracted, unfiltered star counts over a width of and within of the shifted NGC 5053 CMD locus, we find the total number of stars with in Hermus to be , while for Hyllus we find stars. The large uncertainties reflect primarily Poisson statistics due to the relatively large number of field stars at this Galactic latitude (). To , the average surface density of the stream stars is therefore stars deg-2 for Hermus, and stars deg-2 for Hyllus. Within each stream are clumps with surface densities in excess of 40 stars deg-2.
3.1. Constraints on Orbits
Given our distance uncertainties and the lack of velocity or proper motion information, we can place only limited constraints on the orbit. Moreover, Odenkirchen et al. (2009) and Eyre & Binney (2011) have demonstrated that tidal streams do not precisely trace the orbits of their progenitors. Nevertheless, we estimate the orbits of the stream stars to determine whether the streams might plausibly be related to one another. We do this using the Galactic model of Allen & Santillan (1991) to compute trial orbit integrations, and matching these orbit integrations with the measured positions and distances of the streams in a least-squares sense. We fit to 11 (Hyllus) and 12 (Hermus) normal points chosen to lie along the centerline of each stream, and distance estimates to the centers and each end of the streams. For Hermus we use normal points and distances for only the northern We adopt a solar Galactocentric distance of 8.5 kpc, and stream distances as given above. Though we examined the proper motions of stars along the streams (Munn et al., 2004, 2008), the relatively large uncertainties and severe contamination by field stars combined to prevent us from discerning any obvious stream signals. We have therefore left the proper motions as free parameters in the fit.
We compute orbits over a grid of radial velocity and , proper motions to produce a data cube. is computed using the positional and distance offsets of each trial orbit from the normal points and distance estimates above. Uncertainties of and 3 kpc are assigned to the positional normal points and distances, respectively. An initial grid is computed over the ranges km s-1 and arcsec yr-1 to locate all reasonable minima. Once the deepest minimum is identified, a finer grid with 5 km s-1 and 0.02 arcsec yr-1 spacing is used to find the minimum values for radial velocity and proper motion. Uncertainties are estimated using the marginal distributions.
For Hermus, the best-fitting prograde orbit models predict a radial velocity of km s-1, and proper motions arcsec yr-1, arcsec yr-1 at a fiducial point with coordinates [] = []. A retrograde orbit would have km s-1, arcsec yr-1, and arcsec yr-1 at the same point. The uncertainties correspond to the 95% confidence interval. At the northernmost point of the stream () the predicted distance and radial velocity are 13 kpc and -15 km s-1, while at the southernmost point () the corresponding values are 19 kpc and -92 km s-1. Varying the radial velocities and proper motions over all combinations of their respective uncertainty ranges, we find an apogalactic radius of R kpc, perigalactic radius R kpc, orbital eccentricity , and orbital inclination .
For Hyllus the best-fitting model predicts km s-1, arcsec yr-1, arcsec yr-1 at coordinates [ ] = [] in the prograde case. A retrograde orbit would have km s-1, arcsec yr-1, and arcsec yr-1. At the southern end of the stream the best-fit model predicts a distance and radial velocity of 21 kpc and -128 km s-1. The corresponding orbital parameters have R kpc, R kpc, , and orbital inclination .
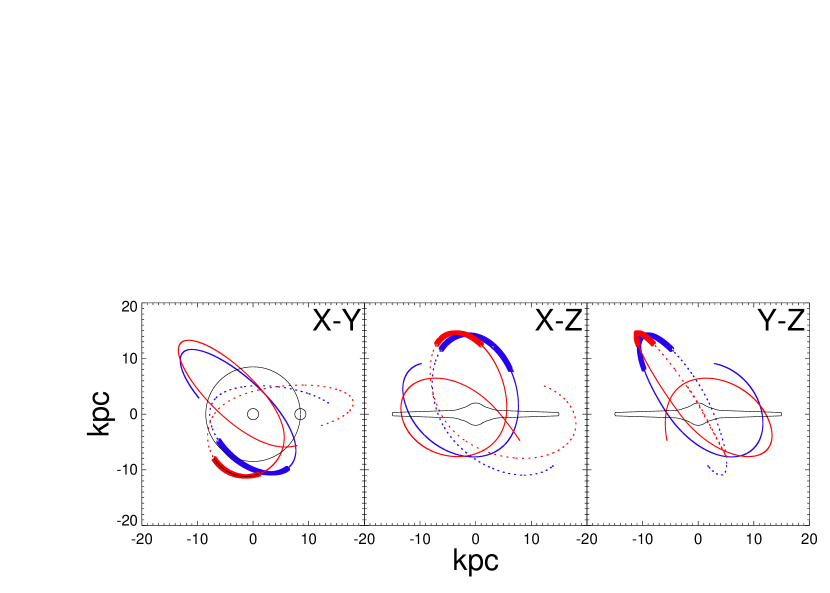
Comparing the orbital parameters of Hermus and Hyllus, we see that the apo- and peri-Galactic distances are within of one another. One the other hand, the well-measured orbital inclinations are separated by at least . Given our current lack of velocity information, it would be unwise to put much weight on these orbit fits or their differences. The fact that we see two distinct, well-separated streams indicates that Hermus and Hyllus originated in two different clusters. However, we cannot rule out that the parent clusters themselves were not part of a larger accretion event. This is made more evident in Figure 4, where we compare the best-fit orbit projections of the two streams. The orbital parameters for such a larger, accreted object would presumably lie somewhere near those of Hermus and Hyllus, though the initial orbit may have been considerably more energetic, only evolving toward the current configuration through dynamical friction. As dynamical friction is proportional to (where is the velocity of the progenitor relative to the field stars in the Galaxy) this evolution would presumably have been considerably more rapid for a prograde orbit. Radial velocity measurements will be necessary before we can ascertain the direction of motion, refine the orbital parameters, and establish the degree to which the two streams might be related.
4. Conclusion
Hermus and Hyllus add to a growing list of debris streams that, with suitable follow-up, will ultimately enable detailed tomography of the Galactic halo. Refinement of the orbits of the streams will require radial velocity and proper motion measurements of carefully selected stars along the length of each stream. Given the relative proximity of the streams, and if a sufficient number of stars can be found with , then the Gaia survey may help to identify individual stars in the streams (for follow-up spectroscopy), and constrain their proper motions. An initial survey reveals a significant number of RR Lyrae lying in projection along both Hermus and Hyllus. If some number of these RR Lyrae can be physically associated with the streams, then follow-up infrared observations with the Spitzer Space Telescope would allow us to determine much more accurate distances to various portions of the streams. These distance measurements will in turn reduce the uncertainties in the space motions of the streams determined by Gaia.
References
- Ahn et al. (2014) Ahn, C. P., et al. 2014, ApJS, 211, 17
- Allen & Santillan (1991) Allen, C., & Santillan, A. 1991, Rev. Mex. Astron. Astrofis., 22, 255
- Belokurov et al. (2006) Belokurov, V., et al. 2006, ApJ, 642, 137
- Belokurov et al. (2007) Belokurov, V., et al. 2007, ApJ, 658, 337
- Bonaca et al. (2012) Bonaca, A., Geha, M., & Kallivayalil, N. 2012, ApJ, 760, 6
- Carlberg (2009) Carlberg, R. G. 2009, ApJ, 705, L223
- Carlberg & Grillmair (2013) Carlberg, R. G., & Grillmair, C. J. 2013, ApJ, 768, 171
- Deg & Widrow (2014) Deg, N., & Widrow, L. 2014, MNRAS, 439, 2678
- Eyre & Binney (2011) Eyre, A., & Binney, J. 2011, MNRAS, 413, 1852
- Grillmair (2006a) Grillmair, C. J. 2006a, ApJ, 645, 37
- Grillmair (2006b) Grillmair, C. J. 2006b, ApJ, 651, 29
- Grillmair (2009) Grillmair, C. J. 2009, ApJ, 693, 1118
- Grillmair (2011) Grillmair, C. J. 2011, ApJ, 738, 98
- Grillmair et al. (2013) Grillmair, C. J., Cutri, R., Masci, F. J., Conrow, T., Sesar, N., Eisenhardt, P. R. M., & Wright, E. L. 2013, ApJ, 769, 26
- Grillmair (2010) Grillmair, C. J., 2010, in “Galaxies and their Masks”, eds. Block, D., Freeman, K.C., & Puerari, I., Springer, New York, p. 247
- Harris (1996) Harris, W. E. 1996, AJ, 112, 1487
- Koposov, Rix, & Hogg (2010) Koposov, S. E., Rix, H.-W., & Hogg, D. W. 2010, ApJ, 712, 260
- Koposov et al. (2014) Koposov, S. E., Irwin, M., Belokurov, V., Gonzales-Solares, E., Kupcu, Y. A., Lewis, J., Metcalfe, N., & Schanks, T. 2014, MNRAS, 442, 85
- Küpper et al. (2012) Küpper, A. H. W., Lane, R. R., & Heggie, D. C. 2012, MNRAS, 420, 2700
- Law, Majewski, & Johnston (2009) Law, D. R., Majewski, S. R., & Johnston, K. V. 2009, ApJ, 703, 67
- Majewski et al. (2003) Majewski, S. R., Skrutskie, M. F., Weinberg, M. D., & Ostheimer, J. C. 2003, ApJ, 599, 1082
- Martin et al. (2014) Martin, N. F., et al. 2014, ApJ, 787, 19
- Munn et al. (2004) Munn, J. A., et al. 2004, AJ, 127, 3034
- Munn et al. (2008) Munn, J. A., et al. 2008, AJ, 136, 895
- Newberg et al. (2010) Newberg, H. J., Willett, B. A., Yanny, B., & Xu, Y. 2010, ApJ, 711, 32
- Odenkirchen et al. (2001) Odenkirchen, M., et al. 2001, ApJ, 548, 165
- Odenkirchen et al. (2009) Odenkirchen, M., Grebel, E. K., Kayser, A., Rix, H.-W., Dehnen, W. 2009, AJ, 137, 3378
- Rockosi et al. (2002) Rockosi, C. M., et al. 2002, AJ, 124, 349
- Schlafly & Finkbeiner (2011) Schlafly, E. F., & Finkbeiner, D. P. 2011, ApJ, 737, 103
- Schlegel, Finkbeiner, & Davis (1998) Schlegel, D. J., Finkbeiner, D. P., & Davis, M. 1998, ApJ, 500, 525
- Yoon, Johnston, & Hogg (2011) Yoon, J. H., Johnston, K. V., & Hogg, D. W. 2011, 731, 58