Phase separation in doped Mott insulators
Abstract
Motivated by the commonplace observation of Mott insulators away from integer filling, we construct a simple thermodynamic argument for phase separation in first-order doping-driven Mott transitions. We show how to compute the critical dopings required to drive the Mott transition using electronic structure calculations for the titanate family of perovskites, finding good agreement with experiment. The theory predicts the transition is percolative and should exhibit Coulomb frustration.
The Mott transition is a pervasive and complex phenomena, observed in many correlated oxide systems Imada et al. (1998). It comes in two varieties: the bandwidth-controlled transition at half-filling, tuned by the ratio of the on-site Coulomb repulsion and band-width , and the filling-controlled transition, tuned by electron doping away from half-filling. Theoretically, Mott insulators exist only at half-filling: with one electron per site, hoppings necessarily create empty and doubly-occupied sites which are heavily penalized by . Introducing a finite charge density allows carriers to move without incurring the on-site Coulomb cost, destroying the Mott insulator Fazekas (1999). However, experiments in a wide variety of transition metal oxides show that the critical doping needed to destroy insulating transport is not zero, but rather a substatial fraction of unity Fujimori (1992), ranging from in the nickelates Xiang et al. (2010) to in the vanadates Belik et al. (2007). Systematic variations of with bandwidth also argue that it is an intrinsic quantityKatsufuji et al. (1997), and motivate the search for mechanisms independent of disorder or coupling to lattice vibrations for insulating behavior away from half-filling.
The scenario of doping a Mott insulator has been heavily studied by a variety of techniques Kajueter et al. (1996); Lee et al. (2006); Kotliar and Ruckenstein (1986); Onoda and Imada (2001). For the classic case of a square lattice, basic issues such as whether the Mott transition is first Balzer et al. (2009); Misawa and Imada (2013) or second Georges et al. (1996); Werner and Millis (2007); Furukawa and Imada (1992) order, the specific parameter regimes and underlying mechanisms of phase separation Visscher (1974); Emery et al. (1990); Putikka and Luchini (2000); White and Scalapino (2000); Galanakis et al. (2011), and the structure of the inhomogeneous phases Spivak and Kivelson (2006); Ortix et al. (2009); Giuliani et al. (2011) have been actively researched, with results dependant on the precise model considered. We take a different approach: we assume the bandwidth-controlled Mott transition is first-order and deduce its implications by constructing a simple thermodynamic description. We predict that the filling-controlled transition is first order as a consequence, implying that phase separation occurs and the critical doping scales as , where defines the critical for the bandwidth controlled transition. We show how to compute in electronic structure calculations Kotliar et al. (2006), using the rare earth titanates Greedan (1985); Mochizuki and Imada (2004) as a protypical example.
Thermodynamics – We construct a theory of the Mott transition by connecting the bandwidth- and filling-controlled transitions. By assuming the former transition is first-order (which covers the majority of cases observed in experiment), we can explicitly write down the energy densities for the metallic and insulating states, since the two states must independently exist over a finite parameter range and cross at the first-order transition. We determine the phase boundary of the Mott transition in the - plane ( is chemical potential) and compute the scaling of the critical doping with .
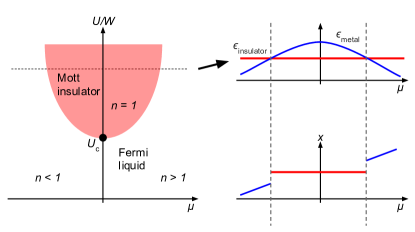
Consider a one-band Hubbard model on generic lattice. The - phase diagram generically consists of two regions: a Mott insulator occupying a finite range in at sufficiently large , and a Fermi liquid (actually a superconductor or any other compressible phase including a possible non-Fermi liquid will suffice for the argument) everywhere else (Fig. 1). Expanding the grand-canonical energy densities of the metal and insulator to lowest order about the bandwidth-controlled transition point (dot in labeled in Fig. 1), we obtain:
| (1) | ||||
| (2) |
Here, is the electronic compressibility, where the doping is defined relative to half-filling, and and are the per-site double-occupancies in the metallic and insulating states. The chemical potential and Coulomb repulsion are measured relative to the bandwidth-controlled transition point.
Equating the two energies, we obtain the Mott phase boundary,
| (3) |
The quadratic dependence is observed within DMFT Werner and Millis (2007). Evaluating the metallic density along the phase boundary, we obtain the critical doping
| (4) |
Similar to the liquid-gas transition, thermodynamics forbids charge densities lying in the range . The system will phase separate if doped to lie within this regime Galanakis et al. (2011).
We note that the filling-controlled transition is not doping in the conventional sense, where the insulator is connected to a metal formed by shifting into the bands lying adjacent to the spectral gap. Indeed the smallness of for small implied by Eq. (3) dictates that the first order transition occurs without the closing of the single-particle gap, when is small. Rather, the Mott insulator transitions to a disconnected, lower-energy, metallic state Balzer et al. (2009).
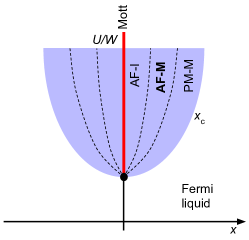
Phase separation – Thermodynamics forbids charge densities in the range , causing the system to phase separate into insulating regions with and metallic regions with (shaded region in Fig. 2). The surface energy , where is the surface tension and is the characteristic size of a metallic region, favors forming a single large puddle. However, the long-ranged part of the Coulomb interaction penalizes macroscopic charge imbalances. Balancing the two gives domains of typical size . The actual spatial patterns formed depend on system-specific details such as dimensionality, anisotropy, and elastic forces Ortix et al. (2009).
Conducting transport does not coincide with the disappearance of phase separation at and the formation of the homogeneous metallic state, but rather when the volume fraction of the metallic puddles reaches the percolation limit, roughly in three dimensions Essam (1980). Depending on the spatial patterns favored, we may expect anisotropic transport. Additionally, we predict an intermediate conducting magnetic state (AF-M in Fig. 2) since long-range order persists as long as the insulating regions percolate, up to doping . This intermediate state does not exist in two dimensions since , implying the metallic and insulating states never simultaneously percolate.
Ab initio modeling – The rare earth titanates TiO3 are an ideal system to investigate the Mott transition Greedan (1985); Mochizuki and Imada (2004). Varying the ionic radius of the rare earth tunes the correlation strength, while rare earth vacancies Sefat et al. (2006a) or Ca substitution Katsufuji et al. (1997) tunes the Ti valence from to . The interplay between structure, transport and magnetism are well-characterized. Critical dopings, determined via transport, range from 0.05 in LaTiO3 to 0.35 in YTiO3, and the predicted intermediate metallic antiferromagnetic state has been observed Katsufuji et al. (1997), although the claim is not without controversy Sefat et al. (2006b). Careful bulk measurements suggest signatures of phase separation Hays et al. (1999); Zhou and Goodenough (2005). However, these prior studies suffer from chemical disorder due to the divalent substitution used to obtain filling control, so recent synthesis of high-quality electrostatically-doped heterostructures opens the possibility of filling-control without cation disorder Moetakef et al. (2011).
To apply our theory to the titanates, we perform electronic structure calculations using the combination of density functional theory and dynamical mean-field theory Kotliar et al. (2006) with the implementation described in Ref. Haule et al., 2010. We used eV and eV for the strength of the Coulomb repulsion on the Ti orbitals, and with as the standard double-counting energy. The empty orbitals do not require correlations for their correct description. We include all the valence states, notably the oxygen states in the hybridization window. We use K, well below the Mott transition temperature at half-filling. The value for was determined by requiring the calculated gap of the end-member LaTiO3 to match the experimentally-determined value, reported to be in the range 20 meV to 0.2 eV Lunkenheimer et al. (2003). Once fixed, these parameters were used to for the entire TiO3 family. To capture correlations in the shells of the compounds with partially-filled rare earth ions, we applied the atomic self-energy
| (5) |
with the static shift . Here, eV is the Hartree term on the -shell, is the center of mass of the density of states, and is the filling fraction (e.g. for NdTiO3). Since the chemical potential is the independent variable in the scans needed to compute the vs. curves, we do not update the charge-density, as this would have required self-consistent adjustment of the nuclear charges. To obtain spectral quantities, we analytically continued the self-energy onto the real axis by applying the maximum entropy method to the effective Green’s function .
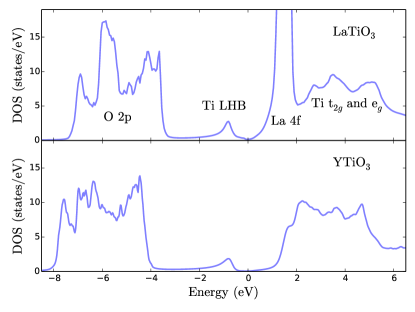
Shown in Fig. 3 is the density of states for the end-compounds LaTiO3 and YTiO3. The contraction of the cation ionic radii from La to Y enhances the octahedral distortions, reducing the bandwidth of YTiO3 relative to LaTiO3 (observed within DFT). The reduction places the YTiO3 deeper inside the Mott insulating state, which is reflected in the increased spectral gap of nearly 2 eV. The salient features—the location of the lower Hubbard band and oxygen 2 binding energies—agree well with photoemission Fujimori et al. (1992a, b).
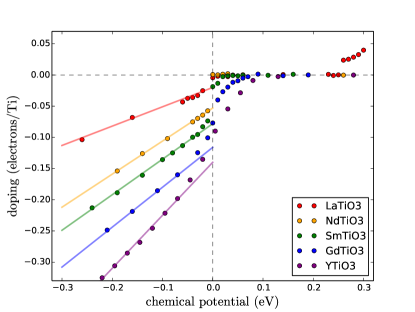
We explicitly determine the critical doping of the titanates by monitoring the charge density as we lower the chemical potential to hole-dope the Mott insulator (Fig. 4). The critical doping, as given by the discontinuity between the insulator and Fermi liquid, increases monotonically from for La to for Y, corroborating our expectation that correlations increase . We note that the small contribution to the compressibility due to the partially-filled shells for the intermediate rare earths has been subtracted out to give a flat vs. curve in the Mott insulating regime. We do not observe a jump in GdTiO3 and YTiO3 because the Mott critical endpoint drops below the simulation temperature of K, as observed experimentally Katsufuji et al. (1997), so we roughly extract by pinpointing the location of steepest slope in the vs. curve. The critical dopings are smaller than experiment a factor of 2, which we attribute to the effect the strong chemical disorder required for doping, as well as polarons, which is known to drive the finite- Mott transition more strongly first-order Capone et al. (2004).
As a consistency check, we also determine for representative compounds using Eq. 4, which is valid near bandwidth-controlled transition point. First, we determined the critical Coulomb strengths for the bandwidth-controlled transition, which decrease from LaTiO3 to YTiO33 as expected. The charge compressibility was obtained by scanning vs. at . To obtain the “double-occupancy” of the metallic and insulating solutions, we note that in multiband models, the Coulomb couples to the generalization of the on-site double-occupancies—the Hartree component of the potential energy— where runs from 0 to 10 within the 3 manifold. The extracted parameters are shown in Table. 1. Again, increases as we progress from the least- to the most-correlated compounds and roughly agree with those from the vs. curves, even for YTiO3 which is quite far from the bandwidth-controlled transition.
| Compound | (/eV) | (eV) | |||
|---|---|---|---|---|---|
| LaTiO3 | 0.20 | 0.15 | 0.13 | 8.8 | 4% |
| SmTiO3 | 0.22 | 0.22 | 0.19 | 6.0 | 20% |
| YTiO3 | 0.28 | 0.23 | 0.20 | 4.7 | 27% |
Summary – We have outlined a theory for the first-order filling-controlled Mott transition, which predicts intrinsic electronic phase separation when a Mott insulator is doped away from half-filling, and demonstrated explicitly how to calculate the critical doping in electronic structure calculations. The thermodynamic signatures of this pervasive phase-separation has been observed in many other correlated systems Imada et al. (1998), as well as directly using near-field optics on VO2 Qazilbash et al. (2007) and STM in the cuprates Kohsaka et al. (2012). The key tasks to enhance the quantitative agreement between theory and experiment involve (a) including disorder and polarons into theoretical calculations, and (b) designing cleaner experimental systems where chemical disorder can be reduced, e.g. through modulation-doped samples or oxide heterostructures. The accessibility of thin films to spatially resolved probes (STM, spatially-resolved optics) is especially advantageous as they would allow direct visualization of the phase separated region.
C.Y. was supported by the Army Research Office MURI grant W911-NF-09-1-0398. L.B. was supported by the MRSEC Program of the National Science Foundation under Award No. DMR 1121053. We benefitted from facilities of the KITP, funded by NSF grant PHY-11-25915. We also acknowledge support from the Center for Scientific Computing at the CNSI and MRL: an NSF MRSEC (DMR-1121053) and NSF CNS-0960316.
References
- Imada et al. (1998) M. Imada, A. Fujimori, and Y. Tokura, Reviews of Modern Physics 70, 1039 (1998).
- Fazekas (1999) P. Fazekas, Lecture Notes on Electron Correlation and Magnetism, Series in Modern Condensed Matter Physic, Vol. 5 (World Scientific Publishing Co. Pte. Ltd., 1999).
- Fujimori (1992) a. Fujimori, Journal of Physics and Chemistry of Solids 53, 1595 (1992).
- Xiang et al. (2010) P.-H. Xiang, S. Asanuma, H. Yamada, I. H. Inoue, H. Akoh, and a. Sawa, Applied Physics Letters 97, 032114 (2010).
- Belik et al. (2007) A. a. Belik, R. V. Shpanchenko, and E. Takayama-Muromachi, Journal of Magnetism and Magnetic Materials 310, e240 (2007).
- Katsufuji et al. (1997) T. Katsufuji, Y. Taguchi, and Y. Tokura, Physical Review B 56, 10145 (1997).
- Kajueter et al. (1996) H. Kajueter, G. Kotliar, and G. Moeller, Physical review. B, Condensed matter 53, 16214 (1996).
- Lee et al. (2006) P. A. Lee, N. Nagaosa, and X.-G. Wen, Reviews of Modern Physics 78, 17 (2006).
- Kotliar and Ruckenstein (1986) G. Kotliar and A. E. Ruckenstein, Physical Review Letters 57, 1362 (1986).
- Onoda and Imada (2001) S. Onoda and M. Imada, Journal of the Physical Society of Japan 70, 3398 (2001).
- Balzer et al. (2009) M. Balzer, B. Kyung, D. Sénéchal, A.-M. S. Tremblay, and M. Potthoff, EPL (Europhysics Letters) 85, 17002 (2009).
- Misawa and Imada (2013) T. Misawa and M. Imada, , 16 (2013), arXiv:1306.1434 .
- Georges et al. (1996) A. Georges, G. Kotliar, W. Krauth, and M. J. Rozenberg, Reviews of Modern Physics 68, 13 (1996).
- Werner and Millis (2007) P. Werner and A. Millis, Physical Review B 75, 085108 (2007).
- Furukawa and Imada (1992) N. Furukawa and M. Imada, Journal of the Physical Society of Japan 61, 3331 (1992).
- Visscher (1974) P. Visscher, Physical Review B 10, 943 (1974).
- Emery et al. (1990) V. Emery, S. Kivelson, and H. Lin, Physical Review Letters 64, 475 (1990).
- Putikka and Luchini (2000) W. Putikka and M. Luchini, Physical Review B 62, 1684 (2000).
- White and Scalapino (2000) S. White and D. Scalapino, Physical Review B 61, 6320 (2000).
- Galanakis et al. (2011) D. Galanakis, E. Khatami, K. Mikelsons, a. Macridin, J. Moreno, D. a. Browne, and M. Jarrell, Philosophical transactions. Series A, Mathematical, physical, and engineering sciences 369, 1670 (2011).
- Spivak and Kivelson (2006) B. Spivak and S. a. Kivelson, Annals of Physics 321, 2071 (2006).
- Ortix et al. (2009) C. Ortix, J. Lorenzana, and C. Di Castro, Physica B: Condensed Matter 404, 499 (2009).
- Giuliani et al. (2011) A. Giuliani, J. L. Lebowitz, and E. H. Lieb, Physical Review B 84, 064205 (2011).
- Kotliar et al. (2006) G. Kotliar, S. Savrasov, K. Haule, V. Oudovenko, O. Parcollet, and C. Marianetti, Reviews of Modern Physics 78, 865 (2006).
- Greedan (1985) J. Greedan, Journal of the Less Common Metals 111, 335 (1985).
- Mochizuki and Imada (2004) M. Mochizuki and M. Imada, New Journal of Physics 6, 154 (2004).
- Essam (1980) J. Essam, Reports on Progress in Physics 43 (1980).
- Sefat et al. (2006a) A. Sefat, J. Greedan, and L. Cranswick, Physical Review B 74, 104418 (2006a).
- Sefat et al. (2006b) A. Sefat, J. Greedan, G. Luke, M. Niéwczas, J. Garrett, H. Dabkowska, and A. Dabkowski, Physical Review B 74, 104419 (2006b).
- Hays et al. (1999) C. Hays, J.-S. Zhou, J. Markert, and J. Goodenough, Physical Review B 60, 10367 (1999).
- Zhou and Goodenough (2005) H. Zhou and J. Goodenough, Physical Review B 71, 165119 (2005).
- Moetakef et al. (2011) P. Moetakef, T. a. Cain, D. G. Ouellette, J. Y. Zhang, D. O. Klenov, A. Janotti, C. G. Van de Walle, S. Rajan, S. J. Allen, and S. Stemmer, Applied Physics Letters 99, 232116 (2011).
- Haule et al. (2010) K. Haule, C.-H. Yee, and K. Kim, Physical Review B 81, 1 (2010).
- Lunkenheimer et al. (2003) P. Lunkenheimer, T. Rudolf, J. Hemberger, a. Pimenov, S. Tachos, F. Lichtenberg, and a. Loidl, Physical Review B 68, 245108 (2003).
- Fujimori et al. (1992a) A. Fujimori, I. Hase, M. Nakamura, H. Namatame, Y. Fujishima, Y. Tokura, M. Abbate, F. de Groot, M. Czyzyk, J. Fuggle, O. Strebel, F. Lopez, M. Domke, and G. Kaindl, Physical Review B 46, 9841 (1992a).
- Fujimori et al. (1992b) A. Fujimori, I. Hase, H. Namatame, Y. Fujishima, Y. Tokura, K. Takegahara, and F. M. F. de Groot, Physical Review Letters 69, 1796 (1992b).
- Capone et al. (2004) M. Capone, G. Sangiovanni, C. Castellani, C. Di Castro, and M. Grilli, Physical Review Letters 92, 106401 (2004).
- Qazilbash et al. (2007) M. M. Qazilbash, M. Brehm, B.-G. Chae, P.-C. Ho, G. O. Andreev, B.-J. Kim, S. J. Yun, A. V. Balatsky, M. B. Maple, F. Keilmann, H.-T. Kim, and D. N. Basov, Science (New York, N.Y.) 318, 1750 (2007).
- Kohsaka et al. (2012) Y. Kohsaka, T. Hanaguri, M. Azuma, M. Takano, J. C. Davis, and H. Takagi, Nature Physics 8, 1 (2012).