Prediction of a potential high-pressure structure of FeSiO3
Abstract
We predict a new candidate high-temperature high-pressure structure of FeSiO3 with space-group symmetry Cmmm by applying an evolutionary algorithm within DFT+U that we call post-perovskite II (PPv-II). An exhaustive search found no other competitive candidate structures with ABO3 composition. We compared the X-ray diffraction (XRD) pattern of FeSiO3 PPv-II with experimental results of the recently reported “H-phase” of (Fe,Mg)SiO3. The intensities and positions of two main X-ray diffraction peaks of PPv-II FeSiO3 compare well with those of the H-phase. We also calculated the static equation of state, the enthalpy and the bulk modulus of the PPv-II phase and compared it with those of perovskite (Pv) and post-perovskite (PPv) phases of FeSiO3. According to the static DFT+U computations the PPv-II phase of FeSiO3 is less stable than Pv and PPv phases under lower mantle pressure conditions at T=0 K and has a higher volume. PPv-II may be entropically stabilized, and may be a stable phase in Earth’s lower mantle, coexisting with α-PbO2 (Columbite-structure) silica and perovskite, or with magnesiowustite and/or ferropericlase, depending on bulk composition.
pacs:
In 1987, Knittle and Jeanloz reported that silicate perovskite was stable throughout Earth’s lower mantle Knittle and Jeanloz (1987), and for a long-time it was believed to be the last major phase change in Earth’s mantle. Ten years ago, the post-perovskite phase was discovered, which explained many-features of Earth’s D′′ layer at the base of the mantle, and since has been widely believed to be the last mantle phase transition Hirose et al. (2007). Recently, a new phase has been reported formed by disproportionation of (Mg,Fe)SiO3 perovskite Zhang et al. (2014).
We have used the evolutionary algorithm encoded using XtalOpt Lonie and Zurek (2011); Xta (2014) with the quantum espresso PWSCF code Giannozzi et al. (2009); Pws (2014) and GGA(PBE)+U by searching for the lowest enthalpy phases of FeSiO3 at 100 GPa with 10, 15, 20, and 30 atoms/primitive cell. The reported cell-parameters for the H-phase were used at initial guess, and each structure was optimized at a constant pressure of 100 GPa.
After calculations for several thousands of FeSiO3 structures, we selected some with the lowest enthalpies for further studies. The symmetry of a selected structure was refined by FINDSYM Stokes and Hatch (2005); ISO (2014) with tolerance no higher than 0.01. After careful study on the selected structures, we obtained three phases of FeSiO3 that have the lowest enthalpies at 100 GPa. Perovskite and post-perovskite are two among the three. Another low enthalpy phase, referred to as the post-perovskite II (PPv-II) here, was not discovered before.
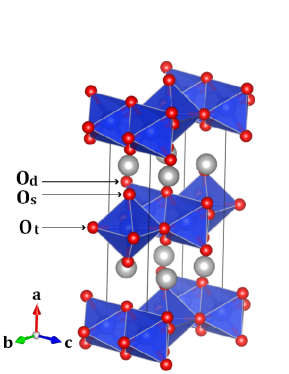
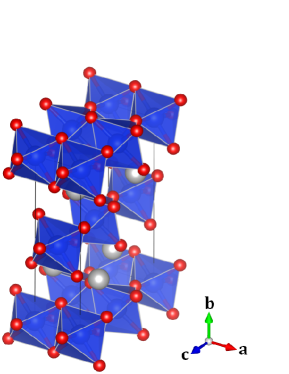
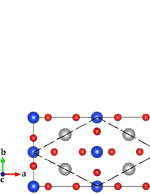
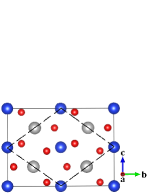
The PPv-II structure is C-centered orthorhombic, with a pseudohexagonal primitive cell (Fig. 1 a and c, Table 1). This structure consists of silicon layers stacking along the a-direction and intercalated Fe ions, which is the same as in the structure of post-perovskite FeSiO3. In the silicon layer of post-perovskite FeSiO3, one interval line of silicon atoms and one interval line of Fe atoms move about half of its lattice constant along the a-direction (corresponding to c-direction in the structure of PPv-II) to form post-perovskite II. Accompanying the movement of silicon and Fe lines, some oxygen atoms become bonded to three silicon atoms, while other oxygen atoms become bonded only to one silicon atom (Fig. 1). PPv-II looks like PPv compressed along the silicon surfaces and also along the Fe surfaces while pulled in the vertical direction, which is demonstrated by the lattice lengths in Table 1. In PPv-II, the average Si-O bond distance is smaller than that of PPv, while the average Fe-O bond distance is larger (Table 1).
| Phase | PPv-II | PPv | ||||||
| Crystal system | Orthorhombic | Orthorhombic | ||||||
| Space group | Cmmm (No. 65) | Cmcm (No. 63) | ||||||
| Cell parameters | ||||||||
| a(Å) | b(Å) | c(Å) | a(Å) | b(Å) | c(Å) | |||
| 10.082 | 5.478 | 2.495 | 2.508 | 8.614 | 6.283 | |||
| (∘) | (∘) | (∘) | (∘) | (∘) | (∘) | |||
| 90 | 90 | 90 | 90 | 90 | 90 | |||
| Atomic coordinates | ||||||||
| Label* | Label* | |||||||
| Fe | 4 e | 0.25 | 0.25 | 0 | 4 c | 0 | 0.743 | 0.25 |
| Si1 | 2 a | 0 | 0 | 0 | 4 a | 0 | 0 | 0 |
| Si2 | 2 c | 0.5 | 0 | 0.5 | ||||
| O1 | 4 i | 0 | 0.702 | 0 | 4 c | 0 | 0.058 | 0.25 |
| O2 | 4 h | 0.336 | 0 | 0.5 | 8 f | 0 | 0.368 | 0.048 |
| O3 | 4 h | 0.115 | 0 | 0.5 | ||||
| Interatomic distances (Å) | ||||||||
| Si1-O | 1.630(2), 1.705(4) | 1.648(2), 1.718(4) | ||||||
| Si2-O | 1.652(2), 1.669(4) | |||||||
| Average Si-O | 1.672 | 1.695 | ||||||
| Fe-O | 2.042(4), 2.297(4 ) | 2.030(2), 2.083(4), 2.107(2) | ||||||
| Average Fe-O | 2.170 | 2.076 | ||||||
| *The label letters are Wyckoff labels and the number before each letter is the corresponding multiplicity. | ||||||||
We calculated the X-ray diffraction patterns of PPv FeSiO3, PPv-II FeSiO3 and Pv MgSiO3 under experimental pressures and wavelengths (Fig. 2). According to Ref. Zhang et al. (2014), the experimental powder is composed mainly of Pv MgSiO3 and H-phase in Fig. 2A, and the experimental powder is nearly pure H-phase in Fig. 2B. H110 and H101 are the two main peaks of H-phase based on these experimental XRD patterns. Surprisingly PPv-II FeSiO3 also has two main peaks PPv-II400 and PPv-II220 whose positions are very close to the peak positions of H110 and H101 (Fig. 2) in spite of that the lattice lengths of pseudohexagonal primitive cell of PPv-II are different from those of the hexagonal H-phase in Ref. Zhang et al. (2014) (Table 2).
| a(Å) | b(Å) | c(Å) | (∘) | (∘) | (∘) | |
|---|---|---|---|---|---|---|
| H-phase Zhang et al. (2014) | 5.096 | 5.096 | 2.862 | 90 | 90 | 120 |
| PPv-II Primitive cell | 5.737 | 5.737 | 2.495 | 90 | 90 | 122.96 |
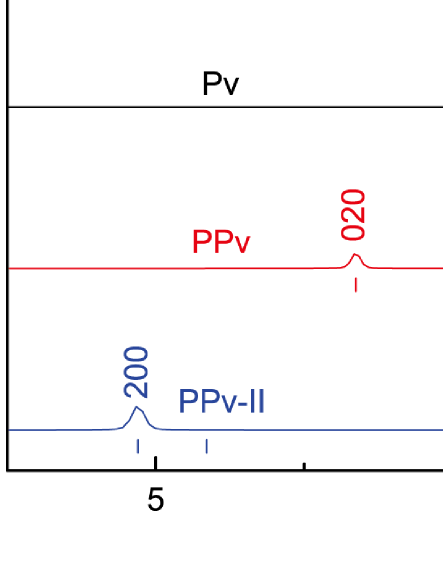
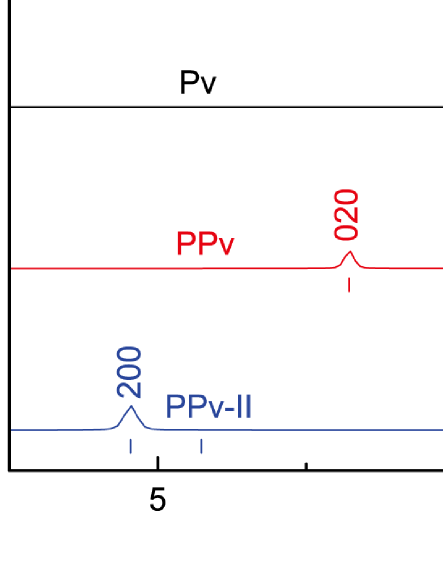
Note that the experimental intensities are not likely to be reliable as they come from averaged diffraction of small single-crystallites (i.e. diffraction spots rather than rings). The differences in peak positions of PPv-II from experiment is caused by the difference in composition - ours is for pure FeSiO3 , whereas the experimental pattern contains some Mg. Note that PPv also has two peaks at the peak positions of H110 and H101. Zhang et al. claim that PPv is ruled out by their data: “In addition to Pv, another set of peaks not corresponding to any previously known phases appeared with particularly conspicuous peaks at 2.55 and 2.40 Å(marked H110 and H101, respectively). These two peaks are close to the diagnostic PPv peaks near 2.5 and 2.4 Å(PPv 022 and 110, respectively), but the high-quality XRD pattern clearly rejects the possibility of PPv” Zhang et al. (2014). The best diagnostic peak for PPv-II would be the large d-spacing 200 peak, but this weak small 2 peak may be difficult to observe.
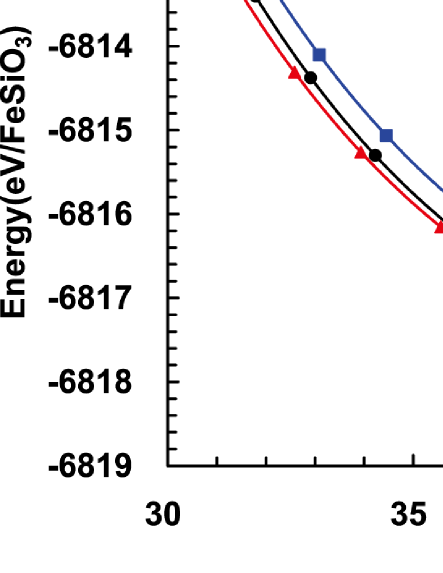
We studied the equations of state (EOS) of Pv, PPv, and PPv-II phases of FeSiO3 based on DFT+U static calculations. All of our calculations used projector augmented-wave (PAWs) generated with Perdew-Burke-Ernzerhof (PBE) exchange-correlation functional in the Quantum Espresso library for Fe, Si and O atoms. We used 20-atoms cells, 444 k-points mesh and 80 Ry cut-off energy for all Pv, PPv, and PPv-II crystals so that the enthalpy difference between FeSiO3 phases converged within 0.01eV/FeSiO3. We used U6.0 which is the same value as used in the structure searchings. All the phases of FeSiO3 are in high-spin antiferromagnetic states in our calculations for they have lower total energy than the corresponding ferromagnetic and low-spin states.
For each phase of FeSiO3, we calculated the static total energies at eight volumes (Fig. 3). The eight volumes correspond to eight pressures of -10, 0, 25, 50, 75, 100, 125 and 150 GPa. The EOS parameters were fitted to the E(V) data with a Vinet equation of state Vinet et al. (1987); Cohen et al. (2000). At 100 GPa, the bulk modulus of PPv-II is smaller than those of Pv and PPv and the one formula volume of PPv-II is larger (Table 3).
| (,Å3/FeSiO3) | (,GPa) | () | |
|---|---|---|---|
| Pv | 44.31(34.27) | 225(597) | 4.42(3.34) |
| PPv | 44.90(33.98) | 189(579) | 4.73(3.47) |
| PPv-II | 45.45(34.49) | 195(580) | 4.67(3.44) |
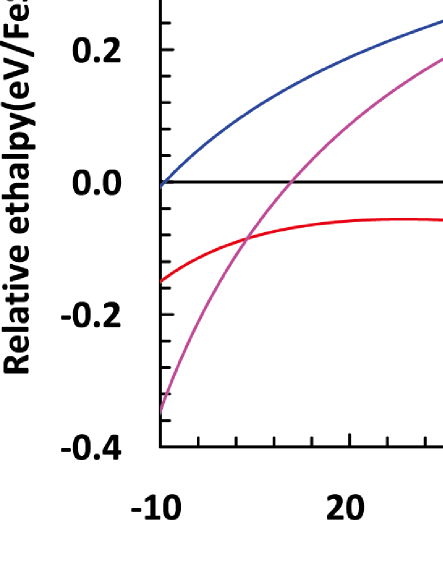
Pv and PPv phases of FeSiO3 are more stable than the PPv-II phase at high pressures in the lower mantle (Fig. 4). We find that the orthorhombic structure (Cmmm) of PPv-II is unstable at low pressure and it has a displacive phase transition to monoclinic symmetry (C2/m) (Fig. 4). The monoclinic structure of PPv-II phase of FeSiO3 is more stable than Pv at pressures lower than 10.8 GPa and more stable than PPv at 4.5 GPa.
It is intriguing to consider more complex phases that have a mixture or super lattice of the PPv Si-O chains and the PPv-II Si-O chains. These could either form as a stable structure, or due to kinetically hindered solid-state reactions. It also seems possible that the Fe atoms could move in their planes at high temperatures, as in host-guest structures Degtyareva et al. (2007).
We have discovered a post-perovskite II phase of FeSiO3 using crystal structure searches based on enthalpy from DFT calculations at 100 GPa. The crystal of PPv-II is orthorhombic. The structure of PPv-II can be formed from PPv by moving interval lines of silicon and iron atoms half the lattice constant along their surfaces. Based on the enthalpy from the Vinet equation of state regressed from static total energies of 8 volumes, the PPv-II phase of FeSiO3 is less stable than its Pv and PPv phases at lower mantle pressure conditions. PPv-II has slightly larger volume than Pv and PPv, and high temperature is probably more propitious to PPv-II than Pv and PPv. Two main peaks in the XRD pattern of PPv-II are in good agreement with the experimental peaks of the H-phase both in their positions and relative intensities.
I Acknowledgments
This work is supported by National Science Foundation grants DMS-1025370 and EAR-1214807. R. E. Cohen was supported by the Carnegie Institution and by the European Research Council advanced grant ToMCaT. We thank Li Zhang for helpful discussions.
References
- Knittle and Jeanloz (1987) E. Knittle and R. Jeanloz, Science 235, 668 (1987).
- Hirose et al. (2007) K. Hirose, J. Brodholt, T. Lay, and D. Yuen, Post-Perovskite: The Last Mantle Phase Transition (Geophysical Monograph Series) (American Geophysical Union, 2007).
- Zhang et al. (2014) L. Zhang, Y. Meng, W. Yang, L. Wang, W. L. Mao, Q.-S. Zeng, J. S. Jeong, A. J. Wagner, K. A. Mkhoyan, W. Liu, R. Xu, and H.-k. Mao, Science 344, 877 (2014).
- Lonie and Zurek (2011) D. C. Lonie and E. Zurek, Computer Physics Communications 182, 372 (2011).
- Xta (2014) “Evolutionary crystal structure prediction,” http://xtalopt.openmolecules.net/ (2014).
- Giannozzi et al. (2009) P. Giannozzi, S. Baroni, N. Bonini, M. Calandra, R. Car, C. Cavazzoni, D. Ceresoli, G. L. Chiarotti, M. Cococcioni, I. Dabo, A. Dal Corso, S. de Gironcoli, S. Fabris, G. Fratesi, R. Gebauer, U. Gerstmann, C. Gougoussis, A. Kokalj, M. Lazzeri, L. Martin-Samos, N. Marzari, F. Mauri, R. Mazzarello, S. Paolini, A. Pasquarello, L. Paulatto, C. Sbraccia, S. Scandolo, G. Sclauzero, A. P. Seitsonen, A. Smogunov, P. Umari, and R. M. Wentzcovitch, J. Phys.: Condens. Matter 21, 395502 (2009).
- Pws (2014) “Quantum espresso,” http://www.quantum-espresso.org (2014).
- Stokes and Hatch (2005) H. T. Stokes and D. M. Hatch, Journal of Applied Crystallography 38, 237 (2005).
- ISO (2014) “Isotropy software suite, (brigham young university),” http://stokes.byu.edu/iso/isotropy.php (2014).
- Vinet et al. (1987) P. Vinet, J. Ferrante, J. H. Rose, and J. R. Smith, J. Geophys. Res. (B: Solid Earth) 92, 9319 (1987).
- Cohen et al. (2000) R. E. Cohen, O. Gülseren, and R. J. Hemley, Am. Mineral. 85, 338 (2000).
- Degtyareva et al. (2007) O. Degtyareva, V. V. Struzhkin, and R. J. Hemley, Solid state communications 141, 164 (2007).