1\Yearpublication\Yearsubmission2011\Month\Volume\Issue
Studying the dwarf galaxies in nearby groups of galaxies: spectroscopic and photometric data
Abstract
Galaxy evolution by interaction driven transformation is probably highly efficient in groups of galaxies. Dwarf galaxies with their shallow potential are expected to reflect the interaction most prominently in their observable structure. The major aim of this series of papers is to establish a data base which allows to study the impact of group interaction onto the morphology and star-forming properties of dwarf galaxies. Firstly, we present our selection rules for target groups and the morphological selection method of target dwarf member candidates. Secondly, the spectroscopic follow-up observations with the HET are present. Thirdly, we applied own reduction methods based on adaptive filtering to derive surface photometry of the candidates. The spectroscopic follow-up indicate a dwarf identification success rate of roughly 55%, and a group member success rate of about 33%. A total of 17 new low surface brightness members is presented. For all candidates, total magnitudes, colours, and light distribution parameters are derived and discussed in the context of scaling relations. We point out short comings of the SDSS standard pipeline for surface photometry for these dim objects. We conclude that our selection strategy is rather efficient to obtain a sample of dim, low surface brightness members of groups of galaxies within the Virgo super-cluster. The photometric scaling relation in these X-ray dim, rather isolated groups does not significantly differ from those of the galaxies within the Local Volume.
keywords:
galaxies: dwarf – galaxies: distances and redshifts – galaxies: clusters: individual (IC 65 group, NGC 697 group, NGC 6278 group, NGC 6962 group, NGC 5005/5033 group)1 Introduction
Groups of galaxies are excellent places to study the evolution of galaxies
triggered by external processes. This includes all kind of interactions
with the surroundings, starting from wide to nearby fly-bys of (or: encounters with) other
group galaxies, the fly-bys of in-falling galaxies, the merging of equally
sized galaxies and the accretion of dwarf galaxies (hereafter DGs) by massive galaxies. This
also includes interaction of the individual galaxies with the overall group
gravitational potential or with a homogeneously distributed gaseous component.
Several of these processes like e.g. ram pressure stripping or harassment
(e.g. Moore et al. [1998]) have been discussed in the theoretical
literature, mostly based on detailed simulations (see earlier reviews e.g.
in Barnes & Hernquist [1992]; Mamon [1993], [2007];
Lake & Moore [1999]).
The individual galaxies can respond to these interactions in various ways,
among them bursts of star formation if the gaseous content gets condensed
and shocked, or quenching of star formation after a removal of that gas
(Mayer et al. [2000]). The shape of the galaxy can be temporarily
or permanently be changed, yielding a more irregular appearance, tidal
features like arms, higher order structural parameters up to the complete
disruption of a galaxy and/or formation of tidal DGs
and of the intergalactic matter (IGM), depending on the mass ratios of
interacting galaxies (e.g. Toomre & Toomre [1972],
Barnes & Hernquist [1992], Weinberg [1997],
Henriques et al. [2008], or for a more recent view the
contributions in Smith et al. [2010]).
In general, the low-luminosity dwarf galaxy population is outnumbering their brighter counterparts by far (e.g. Eigenthaler & Zeilinger [2009]). The number of DGs in groups and clusters is puzzling, however. Lambda-Cold-Dark-Matter (CDM) cosmology suggests more DGs than observed, an issue of the so-called missing satellite problem (Klypin et al. [1999]). Due to the much smaller gravitational potential, DGs are normally expected to respond stronger on interactions than massive galaxies. One of the most drastic Local Group examples is the Sgr dwarf (SagDEG) which is in a stage of disruption and accretion by the Milky Way galaxy (Johnston et al. [1995], Ibata et al. [2001]). Another illustrative example of a later stage of disruption is probably the great stream in the Andromeda galaxy (see e.g. Fardal et al. [2008] for a recent discussion and references therein). The Magellanic stream between the LMC and SMC and its long tail are normally understood as a response of these relatively large dwarf galaxies to the interaction with the Milky Way. Despite these clear examples, observations of the - meanwhile roughly fifty (Whiting et al. [2007], Belokurov et al. [2007]) - dwarf galaxies of the Local Group yielded relatively little direct evidence for interaction driven response of DGs. There exist also only few indirect hints like the local morphology-density relation (or morphological segregation) of the dwarf spheroidal and irregular galaxies found around the Milky Way and M31 (first discussed by Einasto et al. [1974], [1975], for a recent discussion see e.g. Grebel et al. [2003] ). More distant groups can step in to provide good examples for the interaction history of small galaxies, see e.g. the recent discussion by Gallagher ([2010]) who focuses on minor interactions (mass ratios below 1 to 10). A special aspect of dwarf galaxy interactions within groups is the relatively high probability of multiple interactions (D’Onghia & Lake [2010]).
The current galaxy evolution paradigm of hierarchical clustering in a CDM universe rises the expectation of relatively frequent interactions in groups of galaxies and a large number of accretions of small galaxies, including the accretion of the early building blocks of the galaxy population. That so relatively few examples can be easily found inside our very local surrounding possibly points - beside the observational difficulties with some more modest responses - to short time scales of many transformations triggered by galaxy interactions. To enlarge the sample of responses which can be studied in detail, one thus has to leave the Local Group despite the fact that this shrinks the resolution and sets the flux limits to higher absolute values (for given instrumentation). Recently, a number of detailed studies of more distant individual groups have been presented (e.g. Chiboucas et al. [2009] on the M81 group, Cote et al. [2009], and Crnojevic et al. [2009] on the Cen A group, Trentham & Tully [2009] on the NGC 1023 group, Karachentsev et al. [2002] on the groups in Ursa Majoris, Tully & Trentham [2009] on the NGC 5353/4 group, Mahdavi et al. [2005] on the NGC 5846 group, Grützbauch et al. [2005] on the NGC 4756 group).
The detection of dwarf satellite population in groups and studying their photometric and structural properties, is an essential part of each of such group studies. However, detailed photometry and spectroscopy of low-luminosity galaxies is challenging. Only the groups within the Local Volume ( Mpc) and a few other nearby galaxy aggregates to some extent have been studied photometrically (e.g. Bremnes et al. [1998], [1999], [2000] Parodi et al. [2002], Jerjen et al. [2000]) and kinematically (e.g. Karachentsev et al. [1999], [2002]).
Besides studying the galaxy properties in possibly partly dynamically relaxed central regions of dense groups, extended infall regions around the groups should also be investigated for signs of the group-growth-history through infalling sub-units. The mass of an infall region could be of order 20-120% of the virial mass (Rines et al. [2003]). Wetzel et al. ([2013]) argue that the environmental effects on the galaxy’ properties can be traced on ’ejected’ or ’back-splash’ galaxies out to several virial radii around massive clusters as well as on the DGs around loose groups. Recently, several examples of dwarf galaxies in such in-falling subgroups have been detected and investigated (Tully et al [2009], Cortese et al. [2006]). In the extended regions around the groups significant perturbations to the global Hubble flow have been found, which could be interpreted either as an effect of deceleration due to the group mass, in the =0 (=0) cosmology (Sandage [1986]), or as an effect of local dark energy, in the CDM cosmology (Teerikorpi et al. [2008], Hartwick [2011], Chernin et al. [2012]).
This is the second paper in a small series, where we present our study of a small sample of relatively nearby groups of galaxies. The first paper of this series (Vennik & Hopp [2008]) presented a detailed surface photometry of the known and probable members of the compact group of galaxies around IC 65. The paper included a kinematical study of that group. The goal of present paper is to detect new (mainly dwarf) group members, verify their true group membership by means of spectroscopic redshift measurements and constrain their photometric properties as a function of environment. We present the selection of the groups in chapter 2 and the selection of additional dwarf galaxy candidates in chapter 3. In chapter 4, we discuss our attempts to confirm these candidates based on radial velocities with dedicated observations at the Hobby-Eberly telescope (hereafter HET). The fifth chapter discusses and summarises the results of our spectroscopic and photometric (i.e. observational) studies, while we leave the detailed analysis of the studied (five) groups for the next paper.
Throughout this paper, we use the concordance cosmology ( = 0.3, = 0.7, and h = 0.7), and all magnitudes are given in the AB system unless explicitly noted.
2 Group selection
| Group | Parent galaxy | ngal | R.A. | DEC | |||||||
|---|---|---|---|---|---|---|---|---|---|---|---|
| [2000] | [2000] | [km s-1] | [Mpc] | [Mpc-3] | [] | [Mpc] | |||||
| (1) | (2) | (3) | (4) | (5) | (6) | (7) | (8) | (9) | (10) | (11) | (12) |
| LGG 016 | IC 65 | 3 | 01:00:30 | 48:48.6 | 2965 | 75 | 0.20 | 3 (6) | 1.1 (2.2) | 0.8 | 0.8 |
| LGG 034 | NGC 697 | 10 | 01:50:37 | 21:54.2 | 3046 | 160 | 0.40 | 8 (10) | 0.2 (0.3) | 7.1 | 1.7 |
| LGG 334 | NGC 5005/33 | 16 | 13:11:42 | 36:42.5 | 975 | 95 | 0.26 | 5 (15) | 0.2 (0.5) | 1.6 | 1.0 |
| WBL 629 | NGC 6278 | 3 | 17:00:42 | 23:01.7 | 3036 | 133 | 0.33 | 4 (8) | 0.5 (0.9) | 4.1 | 1.4 |
| WBL 666 | NGC 6962 | 7 | 20:47:21 | 00:21.1 | 4115 | 224 | 0.55 | 14 (32) | 0.4 (0.8) | 19.2 | 2.3 |
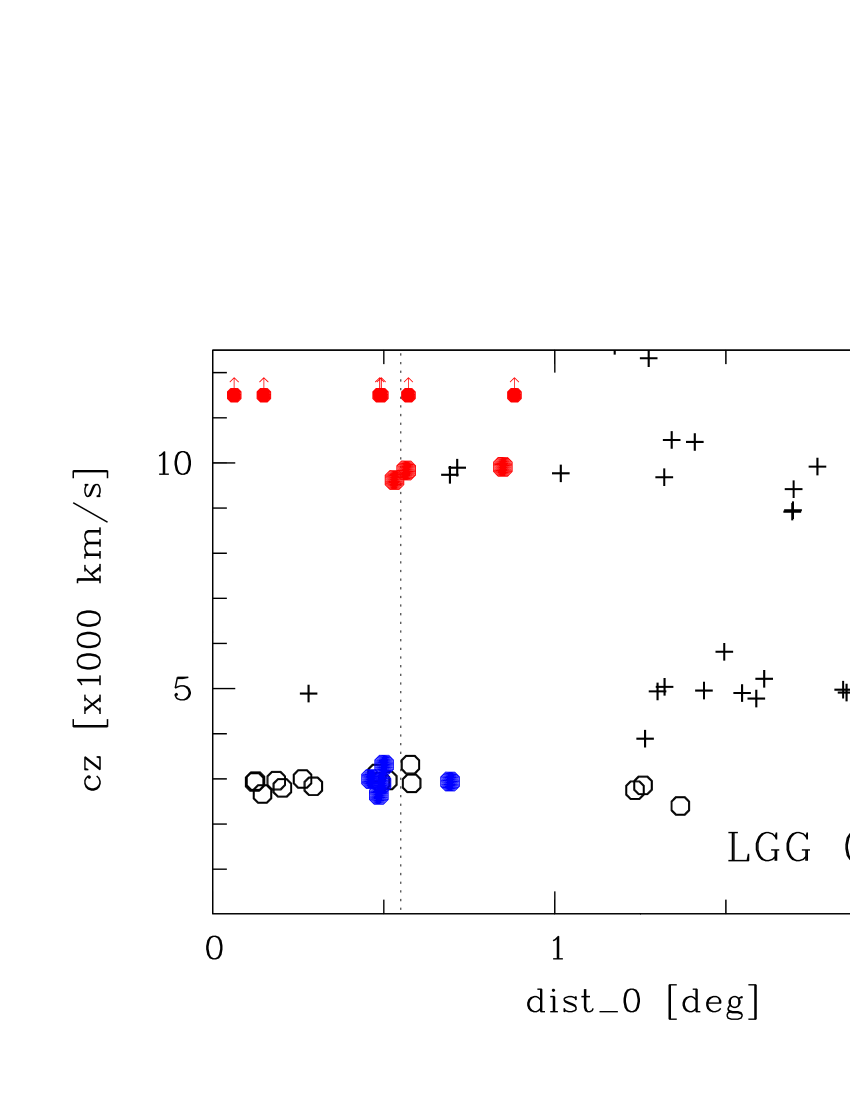
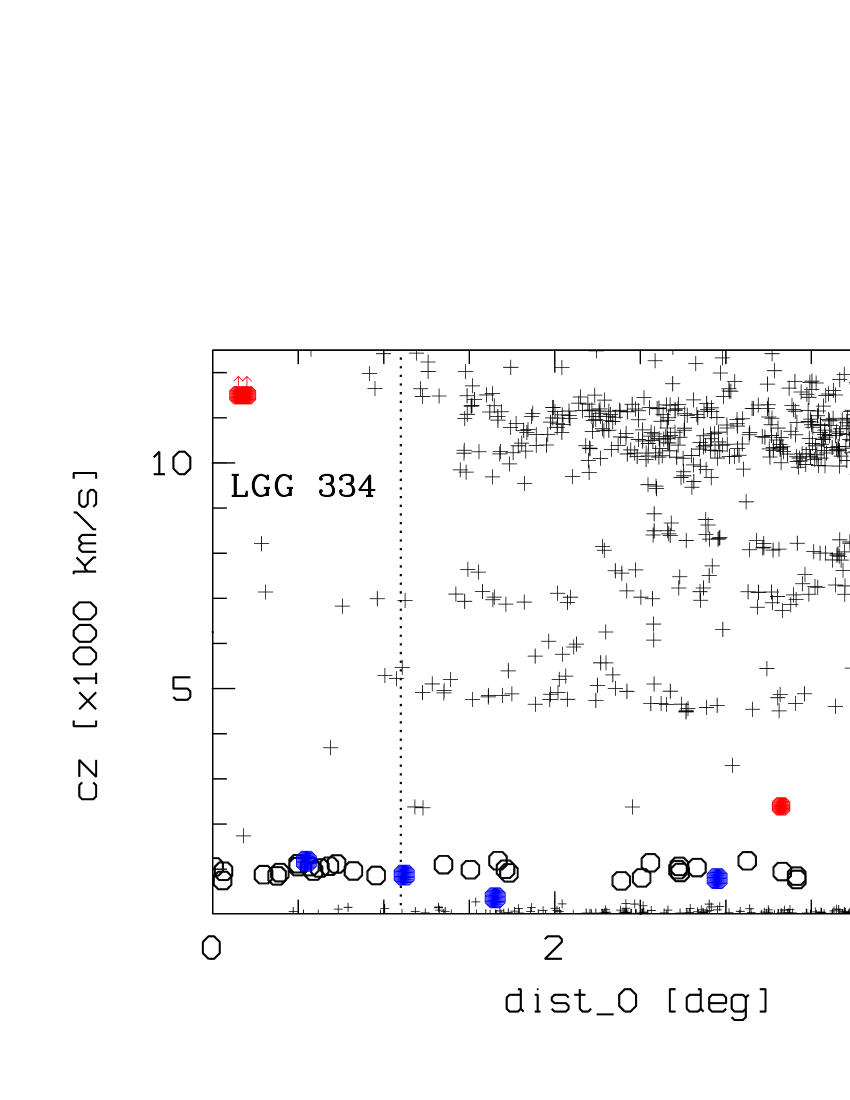
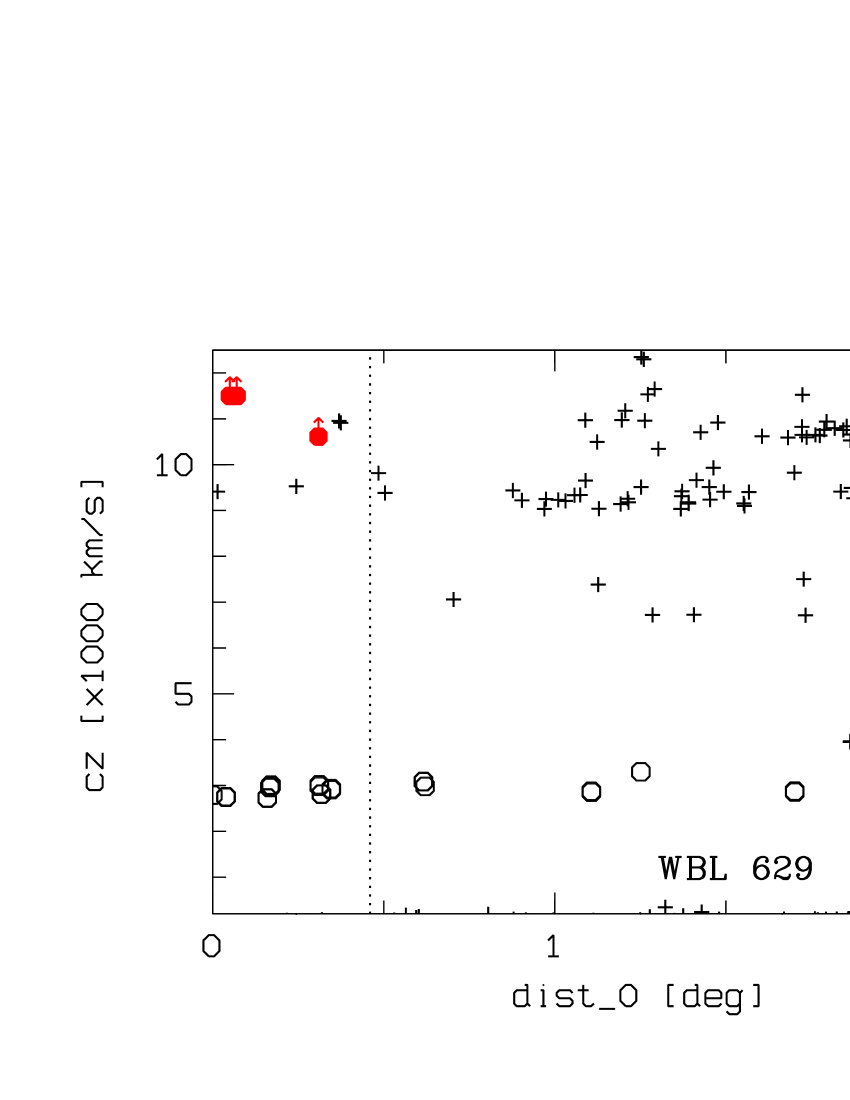
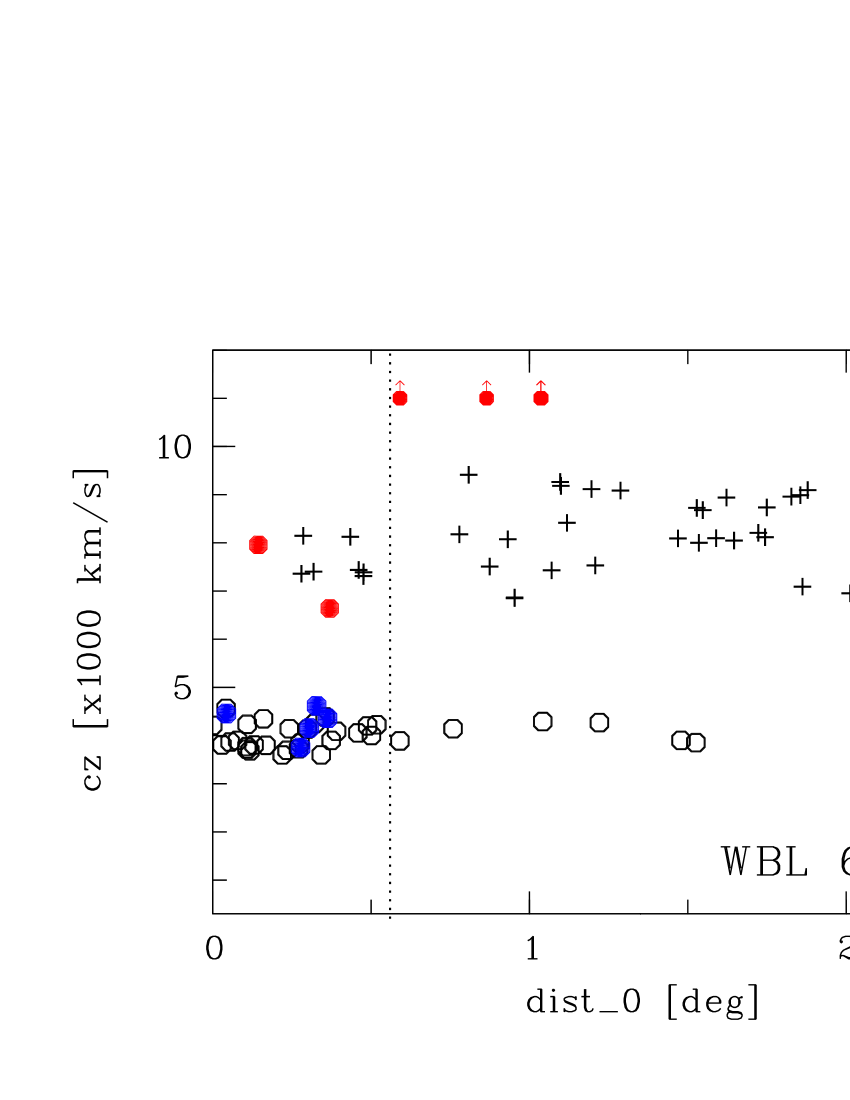
Most of the galaxies and galaxy groups in and near to the Local Super-cluster (hereafter Scl) are distributed in sheets and filaments. Thus, problems arise from contamination between separate structures along a common line of sight. Since this kind of background contamination effects the identification of faint dwarf galaxies most prominently, we have preferentially selected target groups where the group foreground is almost empty and the background galaxies are clearly separated in redshift by (see Fig. 1), i.e. we are seeing the large-scale structures (sheets) nearly face-on. The isolation of selected groups on the sky is less clearly defined. The number density of galaxies in the potentially virialized central regions of the groups (Table 1) exceeds the median galaxy density in the Nearby Galaxy Catalogue (Tully [1988], NBG) as well as the mean density of the clouds in the Local Scl (Tully [1982]) by a factor of about two. However, there are galaxies with concordant redshifts, sparsely populating the group surroundings within the zero-velocity radius. These galaxies are potentially in-falling to the group along a sheet/filament. With the aim of studying environmentally conditioned galaxy properties in and around the groups, we avoid to set strict constraints on the group isolation on the sky, and will consider all galaxies within the group zero-velocity radius.
As further group selection criteria, the groups should be (1) located preferentially in the redshift range between , in order to be able to cover the group area by imaging studies with reasonable number of pointing’s, but still in the distance-range, where dwarf galaxies could have been distinguished and classified using structural and photometric criteria, and (2) prefer groups less studied or un-studied earlier.
Here we describe a set of five optically selected groups, which all remain undetected as sources of diffuse (extended) X-ray emission, when cross-correlating their coordinates with the ROSAT pointed mode (PSPC) observations. That means, the groups have a diffuse X-ray flux less than above the background level, which nearly corresponds to the upper flux limit of (Osmond & Ponman [2004], Mulchaey et al. [2003]). The lack of group-scale X-ray emission is common for a class of spiral-rich groups and could probably mean that those groups are not yet fully collapsed, but are sites of recent dynamical evolution (Osmond & Ponman [2004]).
We note that a few galaxies in selected groups are detected in the ROSAT all-sky survey as X-ray point sources, i.e. they probably host AGNs111E.g. the luminous galaxies with an AGN in the LGG 334 group - NGC 5005 (LINER) and NGC 5033 (Sy 1.9), and the compact pair of galaxies NGC 6962/6964 in the WBL 666, which has a bolometric X-ray luminosity of (Henriksen et al. [1999].).
Initial group membership has been obtained from published catalogues by Vennik ([1984]), Garcia ([1993], LGG), White et al. ([1999], WBL). The lists have been supplemented with new galaxies with concordant redshifts from the SDSS and/or from the NED, located within the zero-velocity radius, which separates the group from the Hubble flow.
The zero-velocity (or infall) radius of each group was estimated, according to Sandage ([1986]) as:
where Gyr is the age of the Universe, and
is the mass within the standard (virial) radius
within which the (galaxy) density exceeds the mean density by a factor of 200 (Carlberg et al. [1997]). The standard radius and the velocity dispersion within that radius were estimated iteratively. The characteristics discussed above for selected groups are summarised in Table 1. The distribution of galaxies with known redshifts around the four groups is shown in Fig. 1 (the LGG 016/IC 65 group has been studied earlier in Vennik & Hopp [2008]). Isolation properties of each group are shortly described below.
The NGC 697 group (LGG 034) (Garcia [1993]) is a local density enhancement in a filamentary structure, which appears to connect the (canonical) Pisces-Perseus Super-cluster (PPS, Haynes & Giovanelli [1986]) ridge with the Local Scl, and the group is located to the South of the PPS main ridge. The group is behind of a local mini-void with the depth of Mpc (Karachentsev et al. [2002]). The major portion of the foreground between the Local Scl and PPS is found to be empty and the NGC 697 group area is essentially devoid of galaxies with measured redshifts up to 10000 km/s (see top left of Fig. 1).
The NGC 5005/5033 group (LGG 334). This group is a locally isolated condensation of late-type galaxies in a sheet-like structure in the central region of the Local Scl. Despite of a crowded background (with 4500 km/s), the group itself is well-defined along the line-of-sight (see Fig. 1, top right). There are several sub-condensations of galaxies with concordant redshifts within the group infall region.
The NGC 6278 group (WBL 629) (White et al. [1999])
is located behind the Local Void (Tully & Fisher [1987]), known also
as the Hercules-Aquila Void in the direction of RA = , DEC = +18o
(Karachentseva et al. [1999]). This void has been found to be
completely empty of known galaxies, including dwarf galaxies,
with km/s, and containing only few known galaxies in between
1500 2500 km/s. Unfortunately, this group is partly projected to
the outskirts of the Hercules Scl ( 9000 km/s), which
potentially rises the contamination problem from
crowded background
(but see Sec. 3.2.2).
The NGC 6962 group (WBL 666) is a conspicuous condensation in a ridge or filament of galaxies, surrounded by several local ( 0.015) mini-voids, e.g. Aquila, Pegasus and Microscopum voids (Fairall et al. [1994]). The group foreground is almost empty as the group is projected onto the outskirts of the Local Void. Another sheet/filament is crossing the group background at 8000 km/s. This group is favourably located within the wide Stripe 82 of the SDSS, which provides co-added images of 2 mag deeper than SDSS in general.
The IC 65 group (LGG 16) is a poor compact assembly of four late-type galaxies, located to the North of the PPS main ridge. There are several filaments extending to the North of the PPS main ridge, but the group background is nearly empty of galaxies with measured redshift. However, our observations have shown that there are a number of nearby DGs, loosely distributed in front of this group, and probably associated with the luminous spiral galaxy NGC 278.
3 Dwarf galaxy candidate selection
The first step to supplement the membership of the original groups
was to query the SDSS222http://www.sdss.org/ and the
NED333http://ned.ipac.caltech.edu/ for all galaxies within
the group infall radius and with redshifts 500 km/s around the
mean velocity of the corresponding group. As a result the membership
of the NGC 6278 and the NGC 5005/5033 groups, as well that of
the central area of the NGC 6962 group within should
be almost complete within the completeness limit of the SDSS
spectroscopic survey of mag. Thus, the completeness
of the group galaxy membership lists extend into the domain of dwarf
galaxies () by mag (NGC 6962 group)
to mag (NGC 5005/5033 group). However, the NGC 697 group
is only partly covered by the SDSS DR8 imaging survey, and its
redshift data are not yet available for the full area of the group.
Finally, the IC 65 group area is outside the SDSS survey footprint
and its members could be only selected from the inhomogeneous
NED database.
Next, we have searched for new dwarf member candidates using the
DPOSS444http://www.astro.caltech.edu/ george/dposs/ blue and
red frames, SDSS multicolour imaging data (and frames), as well as
our own imaging studies of the IC 65 group. The various imaging data
bases forced slightly different selection techniques as described in
the following.
3.1 Candidate selection on the DPOSS (IC 65 group)
We carried out a parametric search for new dwarf galaxies within an area of 1 around the centre of the IC 65 group applying the SExtractor software (Bertin & Arnouts [1996]) to the DPOSS blue and red frames, which were previously linearised and photometrically calibrated. To disentangle the possible dwarf members of the group from distant galaxies in SExtracted catalogue we used two criteria, firstly the Binggeli’s ([1994]) empirical relation between the central surface brightness (SB) and absolute magnitude, common both for the dE and dIrr galaxies, and secondly, the empirical light concentration parameter (Trentham et al. [2001]), versus colour index. More details about the dwarf selection and classification procedure in the IC 65 group is given in Vennik & Hopp ([2008]). As result, we have selected four LSB irregular galaxies with lowest light concentration and the bluest colour (0.45 1.05) as the highest rated dwarf member candidates for the follow-up spectroscopy with the HET.
3.2 Candidate selection with the SDSS data
The other four groups of our small sample are either completely,
i.e. within the infall radius (NGC 6278 and
NGC 5005/5033),
or partly, i.e. within the virial radius (NGC 697 and NGC 6962),
visible in the SDSS DR7. We have searched for new dwarf member
candidates of these groups using the homogeneous multi-colour imaging
data of the SDSS.
3.2.1 Automatic searches towards NGC 6962
First we have queried the catalogue within a radius up to around the centre of the NGC 6962 group, for objects, which have: (1) low surface brightness with g arcsec-2; (2) low light concentration with ; (3) isophotal diameter of , which corresponds to the linear diameter 4 kpc at the distance of the NGC 6962 group. All pre-selected dwarf candidates have been visually inspected on the SDSS and DPOSS frames and final rating of the group membership probabilities (rated ‘1 ’- probable group member, rated ‘2 ’- possible member, and rated ‘3 ’- probable background galaxy) has been made on their morphological and colour grounds.
We have retrieved 29 probable and 44 possible members of the NGC 6962 group within Mpc around the parent galaxy NGC 6962. We have studied the clustering properties among various sub-samples comparing the angular 2-point correlation properties of true (confirmed by redshift) and candidate members of the NGC 6962 group. We found that the ”reference correlation” for 22 true members is significantly more peaked than the functions describing correlation properties for different sub-samples of the candidates, even that for the ensemble of rated ‘1 ’candidates. A simple model sample consisting of a mix of 55% of galaxies in the ”reference sample” and 45% of randomly distributed objects was a good description of the correlation properties of rated ‘1 ’galaxies (Vennik & Tago [2007]). Therefore, we admit that even among the highest rated candidates there may be nearly 50% of projecting background galaxies. However, the results obtained by the HET spectroscopy (Section 4), confirm our ability to distinguish between the dwarf group members and distant LSB galaxies even in outskirts the Local Scl.
3.2.2 Visual candidate selection for the remaining groups
Our exercises with the parametric search for the LSB dwarf galaxies
in the IC 65 and NGC 6962 groups have shown that, despite of the
advantage of having the well-defined selection criteria, they will
inevitably result in an automatic selection of a large number of
different kinds of spurious objects and defects, which could have
been rejected only by a careful visual follow-up inspection of blue
and red DPOSS or SDSS frames. Furthermore, the parametric (automatic)
search in the other three groups would have been more complicated
because:
(1) the NGC 697 group is only partly covered by SDSS DR7 survey,
and combination of parametric searches on the SDSS and DPOSS would
introduce additional uncertainties;
(2) the NGC 6278 group has a crowded background due to projection
to the outskirts of the Hercules Scl, which again complicates the
automatic selection procedure;
(3) the nearest group around the NGC 5005/5033 is rather extended
in the sky and, consequently, a much too large number of candidates
would have been selected by automatic procedure.
Therefore, we decided for the visual search for LSBGs, as a pilot project, preceding the more sophisticated parametric selection (with well defined completeness limits), which would result in selection of a reasonable number of most probable dwarf galaxy candidates for the follow-up long-slit spectroscopy.
We carried out a visual search for the LSB dwarf galaxy candidates of these three groups in two iterations. Firstly, we have selected the most probable (highest rated) dwarf candidates on the SDSS frames (supplemented by DPOSS frames for the NGC 697 group) and compared their photometric characteristics (colour, surface brightness, light concentration), obtained from the SDSS photometric catalogue, with those of the full sample with within this area. We found that the dwarf galaxy candidates, selected in the first round, are best separated from the background (field) objects in the colour index - surface brightness parameter space, where the dwarf candidates are distributed in a sector of blue colours () and of low surface brightness (). Specifically, for the NGC 6278 group surroundings, only of the Sloan galaxies within the survey area and with , are distributed in this parametric range. This indicates that the contamination from the Hercules Scl is not particularly serious.
In the second round of selecting dwarf galaxy candidates, we scrutinised other galaxies within this parametric range, which were not selected in the first iteration. The final decision of their membership probabilities was based on their morphological appearance.
As a result, we have selected 6 targets in the central
(0.4 Mpc) area of the NGC 6278 group, which
include only one probable dwarf galaxy with several luminous clumps,
identified earlier as kkr 31 by Karachentseva et al. ([1999])),
and other five selected objects being classified as possible
(small and diffuse but nucleated) dwarf galaxies.
For the NGC 5005/5033 group of galaxies, our survey resulted in
selection of five probable and eight possible dwarf galaxy
candidates within a radius of (1.4 Mpc) around the group centre.
In the NGC 697 group we have classified 13 targets within the
search radius of (0.4 Mpc) as follows:
three LSB irregular galaxies were rated ‘1’, six compact,
bluish targets - rated ‘2’, and four small, diffuse but
nucleated targets - rated ‘3’.
4 Spectroscopic confirmation
4.1 SDSS and NED
As already discussed, the original group member lists were supplemented by querying the SDSS and NED data base for additional further members of the five groups. This process was repeated after we finished the selection of member candidates from imaging data as described above (chap. 3). Objects with literature redshifts available form the two archives were not included into the follow-up observing program.
4.2 Hobby-Eberly telescope observations
| Setup | Property | Resolution | rms scatter |
|---|---|---|---|
| [nm] | [nm] | ||
| (1) | (2) | (3) | (4) |
| Long slit | 4 arc min | ||
| Filter | GG385 | ||
| Grism g1a | 410 - 800 nm | ||
| slit width | 2.0 arcsec | 1.67 | 0.002 |
| Grism g2a | 430 - 730 nm | ||
| slit width | 1.0 arcsec | 0.41 | 0.0001 |
| 2.0 arcsec | 0.82 |
used wavelength range given in column (2)
The prime focus station Low-Resolution Spectrograph (Hill et al. [1998], LRS) of the Hobby-Eberly Telescope (HET) (Ramsey et al. [1998]) was used through several observing seasons to verify the group membership of dwarf galaxy candidates. A few objects which we had classified as background objects were also included. The LRS is a focal reducer system which enables pre-imaging for the acquisition of the objects and the slit centring and offers various spectral resolution (see Tab. 2). We started the program with the higher resolution grism to obtain also kinematical parameters of the galaxies. This turned out to be too ambitious for many of our low surface brightness targets and we changed to lower resolution (see Tab. 2 and Tab. 4).
Finally, the most efficient set-up was the one with grism g1 which take the full advantage of the HET queue scheduling (Shetrone et al. [2007]). Its relatively low resolution and thus less efficient OH-sky line subtraction in the CCD near infrared was not balanced by the higher resolution of the other grisms. In most cases, the long-slit was oriented along the apparent major axis of the candidate to collect as many photons as possible. In some case, this strategy was somehow compromised to either include bright knots seen in the relevant candidate, or to set a nearby foreground star onto the slit which ease the observational procedure and thus helps to keep the overhead time low. Here, the correct positioning of the slit onto the brightest parts of the candidate by fixing the slit position on stars easily visible in the short acquisition images of the LRS helps a lot to improve the signal-to-noise ratio. With the typical apparent extension of the objects and their relatively smooth light distributions, seeing (or image quality due to the segmented mirror stack) influences the observations only marginally, thus, an upper limit of 3.0′′ was set.
4.3 Data reduction technique
The LRS data were reduced with standard reduction tools inside the ESO MIDAS package LONG (see e.g. Grosbol et al. [1988], Warmels [1991]). Bias pattern and offset as well as pixel-to-pixel variation (flat-fielding) were corrected and all frames were wavelength calibrated by Cd-Ne-lamp exposures. The wavelength calibration was double-checked with the night-sky lines and offset corrected where necessary (see also Tab. 2). The night-sky air glow was interpolated along the columns of the frames and removed. Finally, the objects were extracted applying the Horn algorithm for optimal extraction (Horne [1986]). In a few cases, other galaxies appeared projected on the long-slit (by chance or on purpose), and those were extracted in the same manner and are also listed in Table 5.
In half of the nights, flux standard stars from the HET calibration list were observed (stars from the lists of Oke [1990], Massey & Gronwall [1990], and Fukugita et al. [1996]). We used these observations to establish a common relative flux calibration for all nights to correct the instrumental profile before measuring line positions, line ratios, and comparison to template spectra.
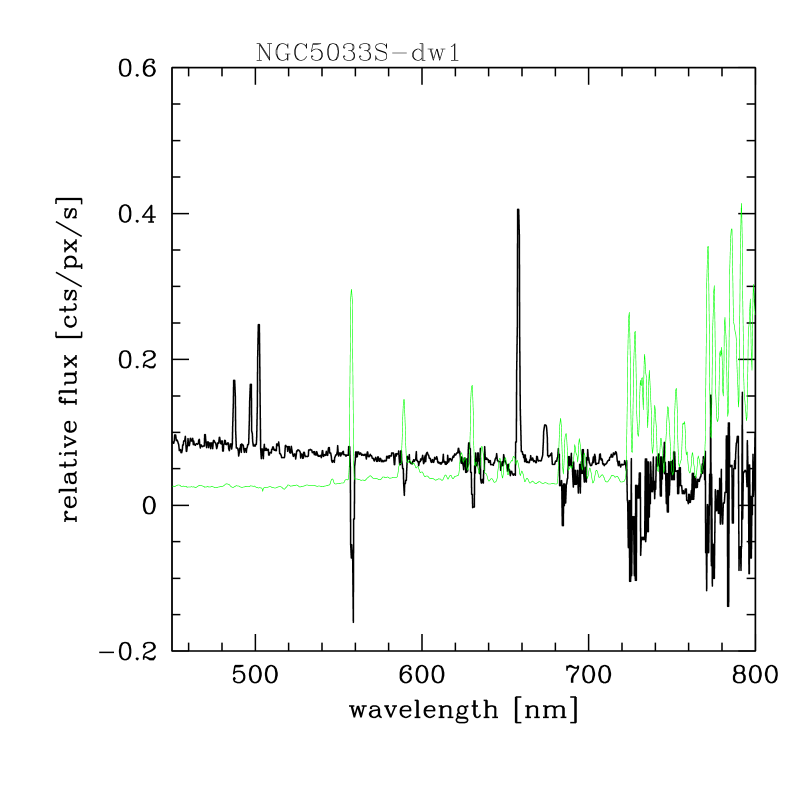
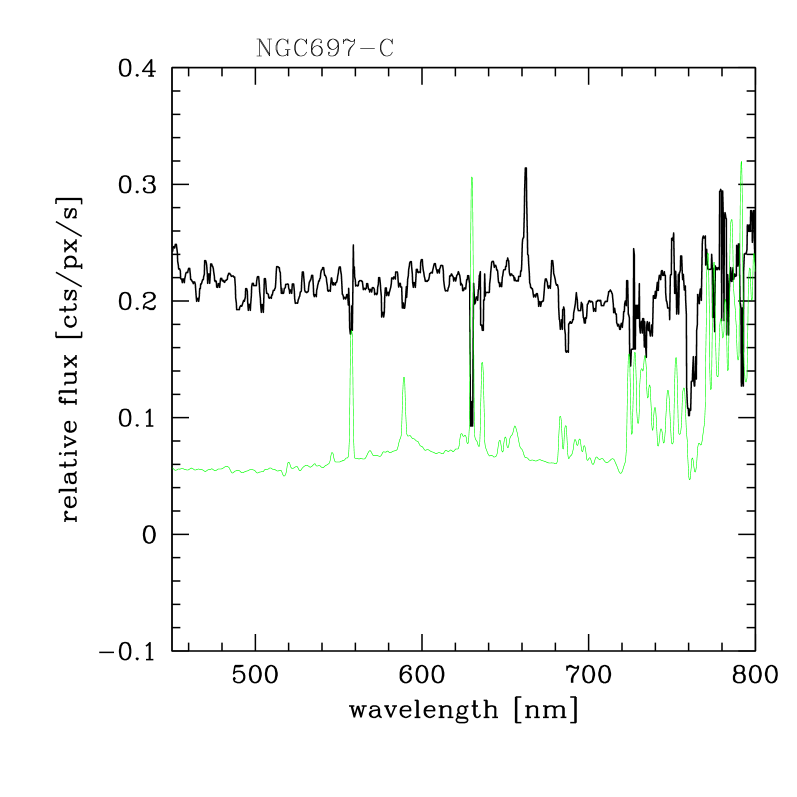
In most cases (see Fig. 3 and Tab. 5), prominent HII emission lines were visible and gaussian fits to them delivered the redshift of the galaxy. As we used several observational setups, the derived data quality is not homogeneous. The signal-to-noise ratios of the individual emission lines used to measure the radial velocity vary between 10 and 150. In few cases (one probable dwarf elliptical group member, several background galaxies), no emission lines were visible, especially not at the location expected for a group member. The spectra of these low surface brightness objects hardly show clear indications of absorption lines which would enable a direct measurement of the redshift. We correlated the spectra in relative flux units of these objects with the template spectra of Kinney & Calzetti ([1996]) to estimate a redshift. While the redshifts obtained by emission lines normally are accurate to km/s, the results of the simple correlation technique applied to these low S/N spectra is in the order of km/s, only.
4.4 Spectroscopic results
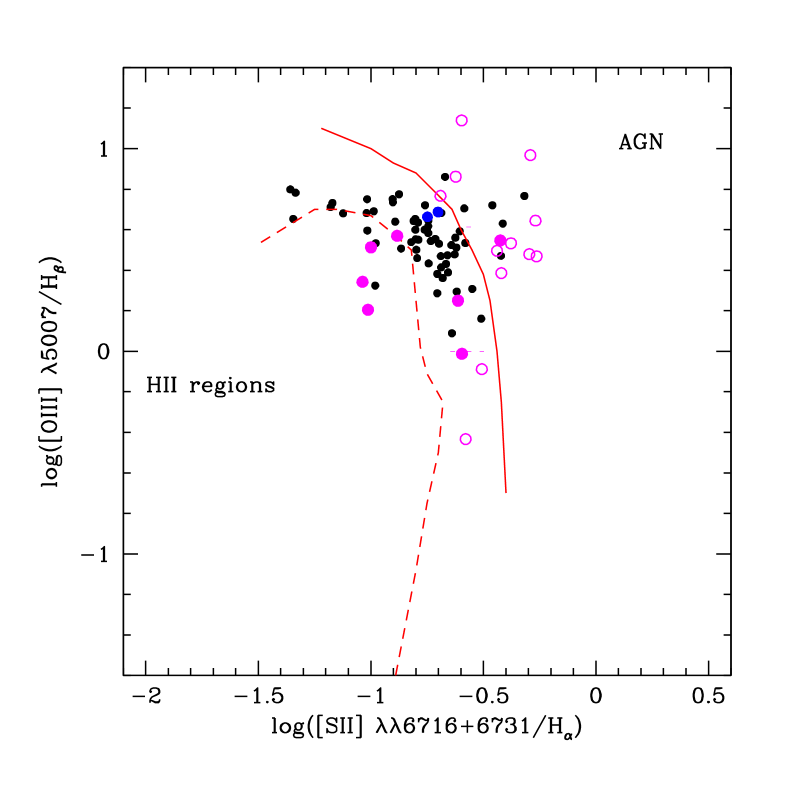
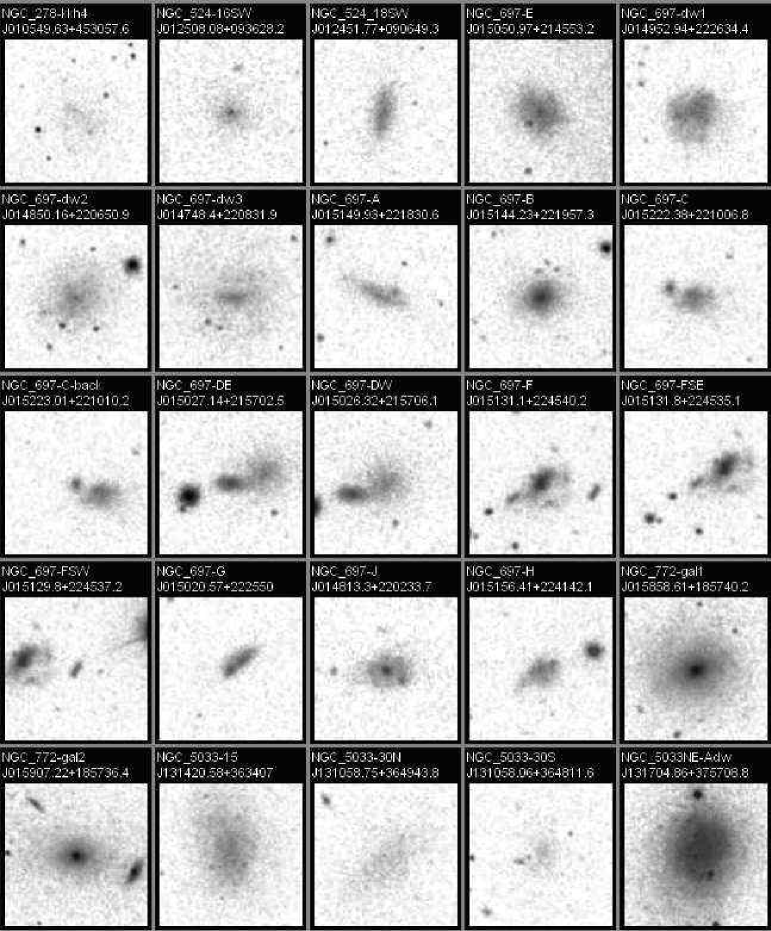
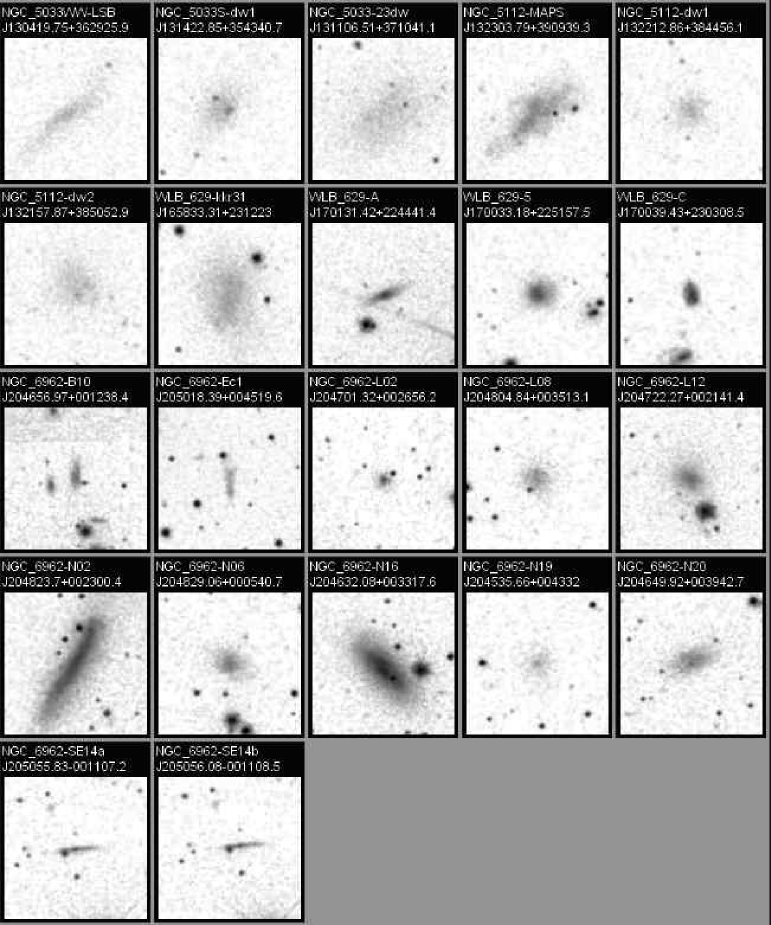
Table 5 lists the individual redshifts together with the statistical errors, coordinates, type and membership classification. A total of 51 target galaxies were observed, another 4 galaxies appeared projected on the long-slit. For 7 (14%) of target galaxies, a redshift could not be extracted either due to low S/N or because of missing features or for both reasons. A mosaic of those 47 observed galaxies, which are visible in the Sloan Survey (SDSS), has been composed with the help of the SDSS Visual Tools, and is presented in the Fig. 2.
The above described target selection aimed for DGs. Based on the redshifts and photometry (see below), 26 of the target galaxies are dwarfs in the sense that . This corresponds to a success rate of 51%. We intentionally added two galaxies classified as background giants to the HET observations which were indeed verified as such. Including those brings the success rate of the morphological selection to 55%.
The more ambitious aim of the selection is to identify new members of our target groups. Using a simple cut-off in the radial velocity of 500 km/s around the group velocity (Tab. 1), we classify 17 galaxies as new group members in the target groups. This corresponds to a success rate of 33%. It is worth mentioning that only 15 of these new members are dwarf galaxies while two have luminosities above the dwarf threshold and are in the range of LMC-M 33-like objects. Furthermore, the majority of the new dwarf members are belonging to the brighter irregular dwarf galaxies, only three of them have absolute magnitudes fainter than -15 (in B-band). Among those faint new members is our only dE candidate galaxy (NGC 5033-30N). Two (brighter) dwarf members show Balmer absorption lines (indicating recent star formation, so called star bursts, NGC 697-B, and NGC 6962-L12) and all other member dwarfs show classical HII spectra pointing to ongoing star formation activity.
We found two DGs in the foreground of our target group IC 65. Using additional data from NED, we suggest that there is a small foreground group around NGC 278, which would fulfil our group selection criteria555The members of this foreground group are NGC 278, UGC 672, and UGC 731 according to NED data, and IC 65-dw1 and IC 65-dw4 based on our own observations. We emphasise that this proposal needs further verification as redshifts are only a poor distance measure below 1000 km/s.. Adding these two galaxies brings the success rate to 37%. NGC 278-kkh4 would qualify as a member of the IC 65 group according to its redshift, but its projected distance of about 2.5 Mpc is too large to accept this dwarf galaxy as a genuine IC 65 group member. It may belong to a neighbouring group or the host large scale structure of the group. The remaining galaxies, including all chance projections onto the spectrograph slit, are background galaxies.
We notice that our success rate in identifying new dwarf members of our target groups neither depends on the Milky Way foreground extinction, nor on the velocity of the group, or on the richness of the group. Even a relatively nearby background structure might or might not confuse the selection. We did not identify a single member in the group WLB 629, which has a background group of similar richness at about 9200 km/s. On the other hand, we found 6 new members in LGG 034, a group with almost identical foreground reddening, distance, and richness, which also appears in front of a small group of galaxies at about 9800 km/s. Here our observations succeeded not only in the identification of six group members, but we were able to identify also three new members of the background group. This background group has a helio-centric radial velocity of 9794 48 km/s, the total of now six members allows a first estimate of the group velocity dispersion to 109 km/s 666The members of this background group are NGC 0695, LCSB S0298P, and IC 1742 (according to data from NED), and NGC 697-dw1, NGC 697-G, and NGC 697-H (from our HET spectra)..
In Table 5, we provide our final classification if the galaxy belongs to a group, the fore- or background. Galaxies are accepted as group members if their velocity does not deviate by more than 500 km/s from the mean of the group as given in Table 1. Table 3 presents the numbers of members identified from the NED data base together with the new members and the total number of objects probably belonging to the groups as well as the revised virial masses of target groups, which have changed by factors between 0.6 – 2.0.
| Group | nNED | nnew | ntotal | |
|---|---|---|---|---|
| [] | ||||
| LGG 016 | 4 | 2 | 6 | 0.7 |
| LGG 016a | 3 | 2 | 5 | |
| LGG 034 | 9 | 5 | 16 | 9.1 |
| LGG 334 | 12 | 5 | 17 | 2.8 |
| WBL 629 | 10 | 0 | 10 | 2.3 |
| WBL 666 | 27 | 5 | 32 | 40.0 |
a Foreground group around NGC 278, see text for details.
For those galaxies where emission lines are present in the observed spectrum, the relative line flux in the emission lines was derived by fitting a gaussian to the line (MIDAS procedure integrate/line). The leading error of this measurement is the determination of the continuum level which in most of our spectra has a low S/N (the spectra were originally not taken for this purpose). If the relevant lines are observed, one can calculate line ratios which allow to classify the dominant emission process in the galaxy following Veilleux & Osterbrock ([1987]). From multiple, independent measurements, we estimate a typical error of these ratios to be of order 0.1 dex. We do not present line fluxes (and properties which might be derived from them like e.g. star formation rates) as many of our observations were taken under non-photometric conditions. Further, slit losses are not really under control for our sample galaxies. One has to take in mind for the following discussion that the [NII] lines are not resolved from H, and the [SII] doublet is not resolved. The LRS at HET does not allow to observe low-redshift [OII] 3727, thus, an abundances estimate based on the R23 method is not possible for the group members. Our spectra do not allow to independently estimate the impact of the underlying stellar absorption features to the H emission lines strength. Thus, we do not correct for the absorption. Typically, the absorption lines of the early type stars of the stellar population produce absorption lines of an equivalent width of about 0.2 nm (Skillman & Kennicutt [1993]), correcting for an effect of this magnitude would increase the H fluxes by about 13% (or 0.05 in a log ratio as used later on, which does not impact the conclusions we will draw from the data. Finally, we calculated the (log of the) ratio of [OIII] 5007 to H and of [SII] 6716+6731 to H+[NII]6584.
Figure 4 shows the [OIII]/H and of [SII]/H ratios derived from our spectra. As the lines used to derive the ratios are nearby in wavelength space, their differential extinction dimming is negligible within the accuracy of our data and we did not correct for that effect despite the available H to H ratio as the correction adds further noise. The observations are compared to the model sequence of photo-ionisation following Veilleux & Osterbrock (dashed line) as well as to the observed quantities of an HII-galaxy sample (Popescu et al. [2002]). We further add the dividing line between the HII and AGN regime from Kewley & Ellison ([2008], solid line). For 19 of our targets, all 4 required fluxes could be measured (for the remaining, at least one of those lines was not measurable). Only seven of those 19 galaxies are members of our target groups (shown as filled dots). All of them occupy the parameter space of normal HII (star forming) dwarf galaxies. We see no hint for unusual low or high metallicity. Comparing the spectra of all our group members does not indicate that those where all four lines could be measured differ in any sense from the others where one or more of those lines could not be measured due to bad S/N, night sky line residuals, and further similar technical reasons. Therefore, we draw the conclusion that all new group members with the spectral classification ’HII’ are star forming dwarf galaxies, in good agreement with the photometric results (see next chapter). We mention in passing that many of the twelve background galaxies with measured ratios spread into the AGN regime.
5 Surface photometry of observed galaxies
5.1 Surface photometry method
We have performed standard surface photometry of all observed galaxies with new redshifts on frames downloaded from the SDSS imaging database. For that exercise, we used the so-called corrected frames in the , , and band of different data releases (DR7, DR8 and DR9). Most of our targets are LSB galaxies of irregular shape (Fig. LABEL:galfigs). Therefore, to increase the S/N ratio and to extend the surface photometry on those relatively shallow SDSS frames as far into the galaxy’s periphery as possible, we applied a space-variable (i.e. adaptive) filter (Lorenz et al. [1993]), as implemented in the ESO MIDAS environment (filter/adaptive task). The adaptive filtering procedure is described in more detail in Vennik et al. ([1996], [2008]). After filtering, the local sky level around the target galaxy was fitted, using the least-square method of the MIDAS task fit/flat-sky. Then, the foreground stars and other disturbing objects on the galaxy image were masked and replaced using an interactive interpolation routine.
The main result of the surface photometry are the differential and cumulative SB profiles, as well as a set of isophotal, effective, and integral parameters, derived from these profiles. The SB distribution of galaxies was analysed in a traditional way, by means of fitting the galaxy isophotes with a set of model ellipses, using the fit/ell3 task in MIDAS. First, we fitted ellipses to the adaptive-filtered , , and band composite image. Higher S/N ratio of the composite image permits to trace the light distribution at larger radii. Next, the cleaned and background subtracted images in each filter were fitted with the same set of ellipses. Finally, the azimuthally averaged SB and colour index profiles were constructed as a function of the equivalent radius , where , are major and minor semi-axes of the fitted ellipses.
The total magnitudes were estimated by asymptotic extrapolation of the radial growth curves. The effective (half-light) radius () was measured on the growth curve and the effective SB at () was determined on the SB profile. One should keep in mind that the NGC 6962 group is located within the SDSS Stripe 82. Thus, we used the co-added , and band frames, which are about 2 magnitude deeper than normal SDSS frames.
5.2 The photometry errors
The magnitude errors consist of internal and external components. The internal random component is dominated by the accuracy of the background estimates and, in addition, includes, the random count error determined from the photon statistics in the aperture measurements. Following Vader & Chaboyer ([1994]), we calculated the internal errors in intensity as
where is the total number of counts within aperture , which is defined as the area between successive isophotes (in pixels), and is the mean sky counts per pixel, and the fractional error in the mean sky value.
The variations in the sky background, as obtained from the parameters (SkyIvar, Sky) in the SDSS DR9 PhotoObjAll catalogue, are typically 0.17% (in ), 0.16% () and 0.25% (). This yields the typical sky uncertainty in the range of 0.002 - 0.003 mag arcsec-2. We note, however, that the parameter SkyIvar in the SDSS PhotoObjAll catalogue is strongly varying for individual objects, indicating possibly problems with proper sky-level determination by automatic data processing. Since most of our targets are LSB galaxies, their photometry is particularly sensitive to the sky-level variations. Therefore, we have measured interactively the local sky-level in empty areas around each of the studied galaxies (on the frames of DR7 and earlier), as well as re-measured the local sky level on the sky-subtracted and calibrated DR8 and DR9 frames. We applied the same approach to the co-added Stripe 82 frames.
We found significant differences in sky-level values
(),
when using the frames from the DR7 and earlier. With mean
relative () values of
(in ), (in ), and (in ).
On the opposite, we found only marginal sky-corrections, when using
the re-processed sky-subtracted frames from the DR8 and DR9.
Those differences are typically 0.13 % (in ), 0.07 % (in )
and 0.1 % (in ), with deviations of the same order.
Therefore we conclude, based on our rather limited sample of 50
galaxies, that sky-subtraction on the re-processed frames since DR8
is generally reliable.
Using our interactively determined sky values and their 1 uncertainties, we have calculated the errors of total magnitudes, as those, corresponding to the 1 sky-level deviations. The 1 sky-error component in total magnitudes in the different filters are typically 0.071 mag (in ), 0.069 mag (in ), and 0.104 mag (in ). The individual errors are listed in the Table 6. We note, that the model-magnitude errors of the studied galaxies, as listed in the DR9 catalogues, are about a factor of two smaller.
Besides of sky-subtraction issues there are various potential caveats related to the automatic pipeline data reduction in the SDSS which were discussed and flagged, e.g. in the NYU-VAGC (Blanton et al. [2005]). Most of these issues are related to poor de-blending of large and/or LSB galaxies with complicated morphology (e.g. star-forming regions, dust features etc.). At low redshifts a number of extended, knotty LSB galaxies have been found shredded, i.e. a large galaxy image is split by the target selection algorithm into several sub-images (e.g. Panter et al. [2007], Tago et al. [2008]). Therefore, the treatment of LSB galaxies requires special care.
In order to estimate the true (external) magnitude errors we need high-quality magnitudes for comparison. For the dwarf galaxies in the IC 65 group region we carried out error estimates in Vennik & Hopp ([2008]). For other galaxies, which were studied on the SDSS frames, no independent comparison data are available. Therefore, we apply for comparison the model magnitudes of the SDSS, which were derived during automatic pipeline data reduction.
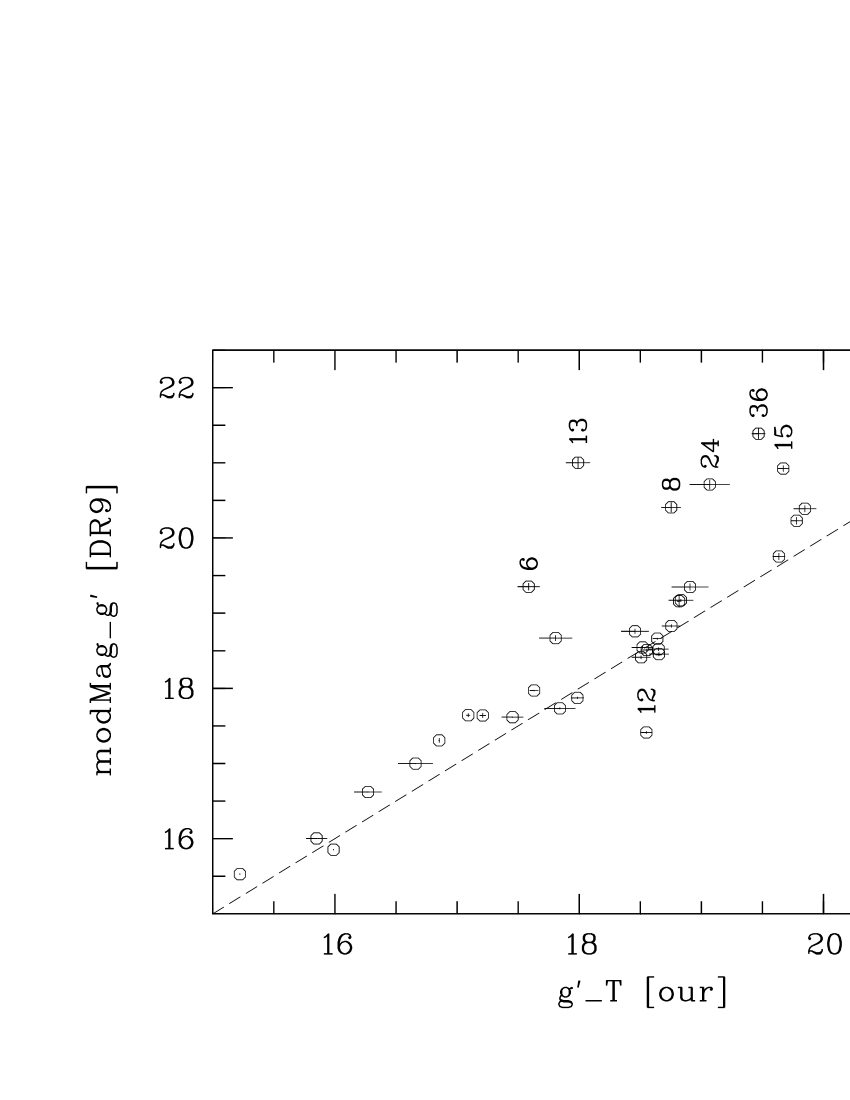
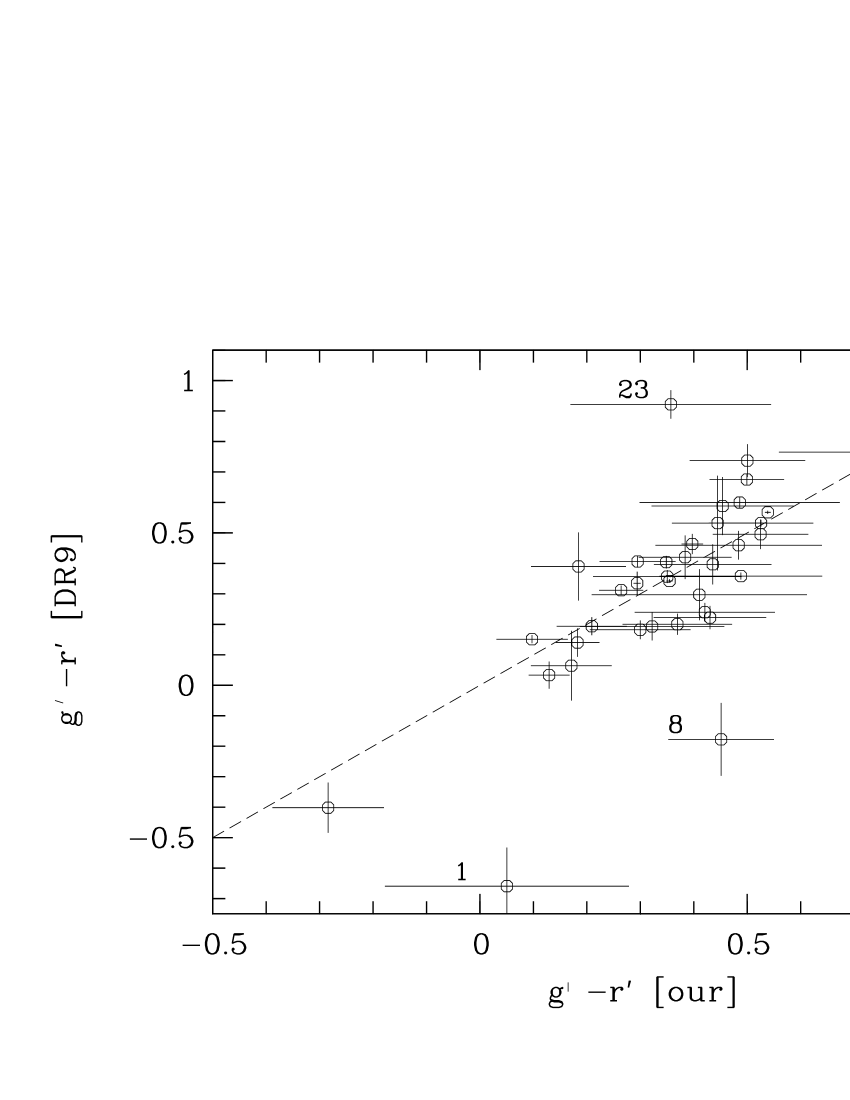
In the Fig. 5 we compare our total magnitudes and colours to the model magnitudes and colours as given in the SDSS DR9. Eight galaxies with large magnitude differences of are identified with the galaxy sequence number in the Table 6. To understand the reason of big magnitude differences we have checked all galaxy images using the SDSS Visual Tools option and found several cases of shredding - in galaxies 6, 8, 24, 29, 36, and poor de-blending of galaxies seen in projection to each-other (galaxies 12, 13, 15), and poor identification of very LSB irregular galaxies (e.g. the galaxy 1). When neglecting those cases of poor galaxy identification in the DR9, we obtain small systematic total magnitude differences of ), and ). respectively.
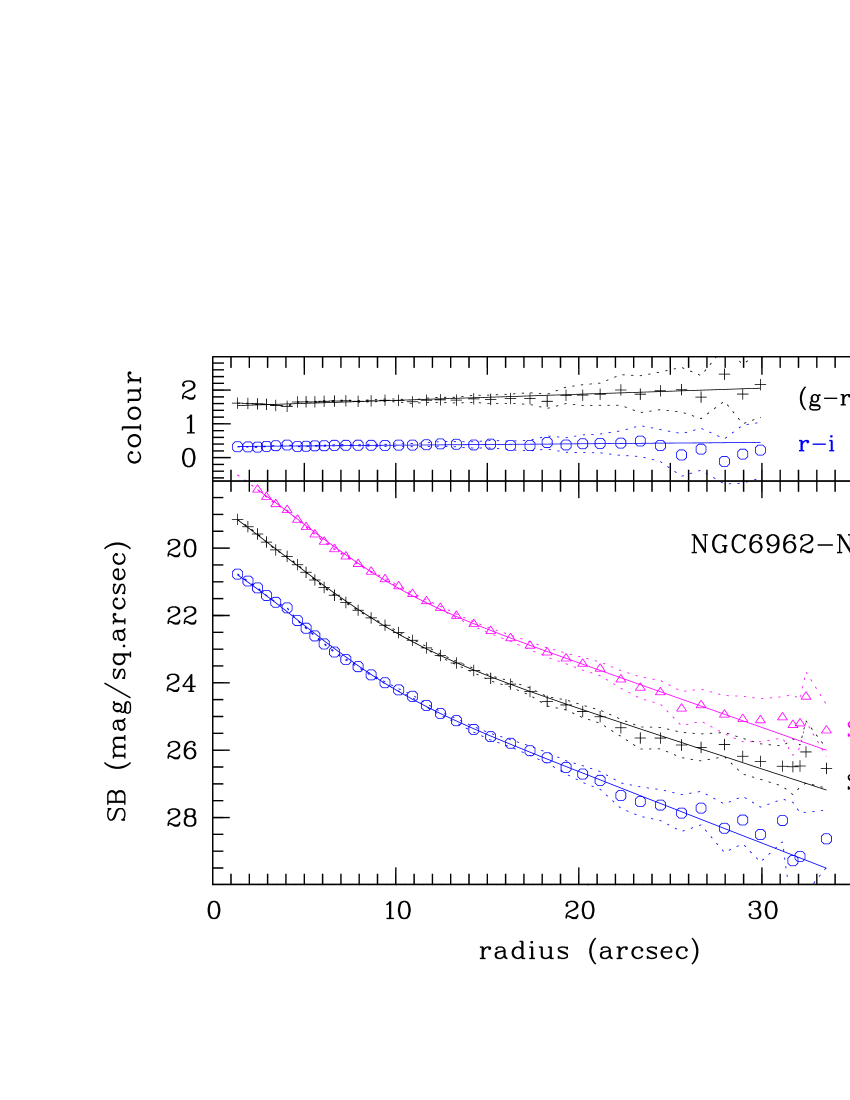
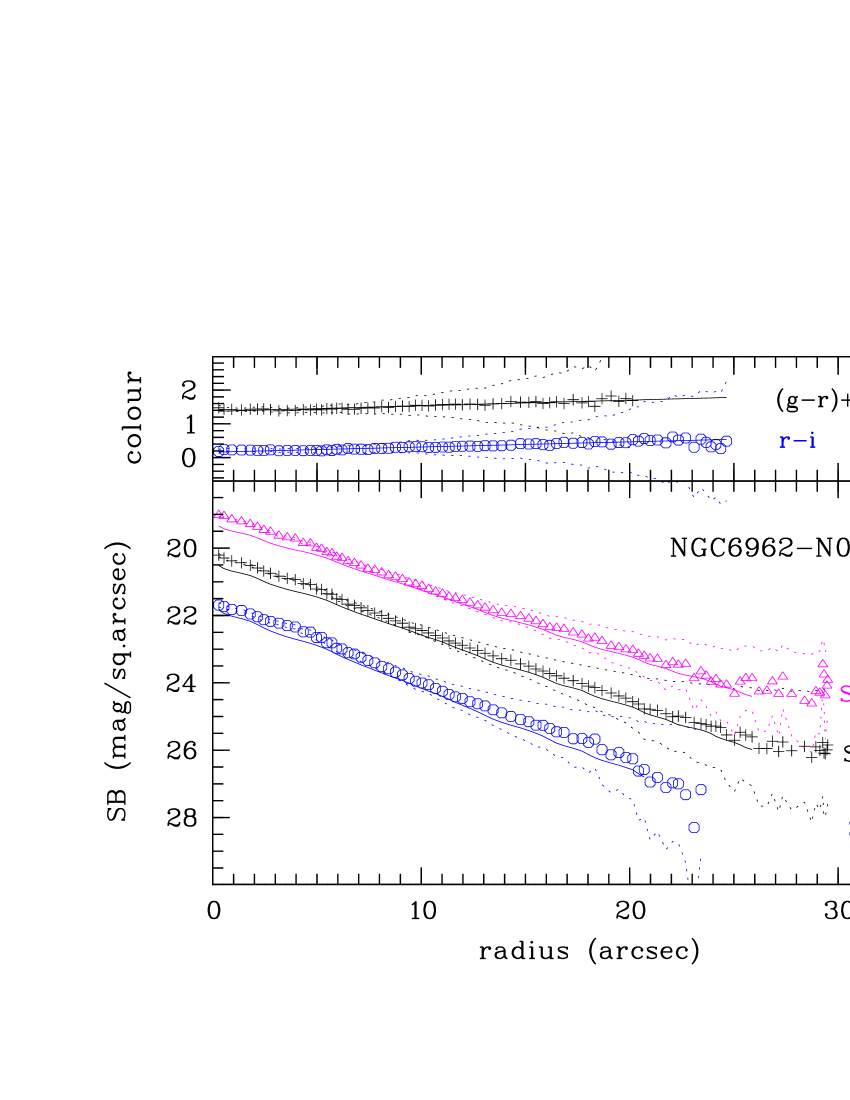
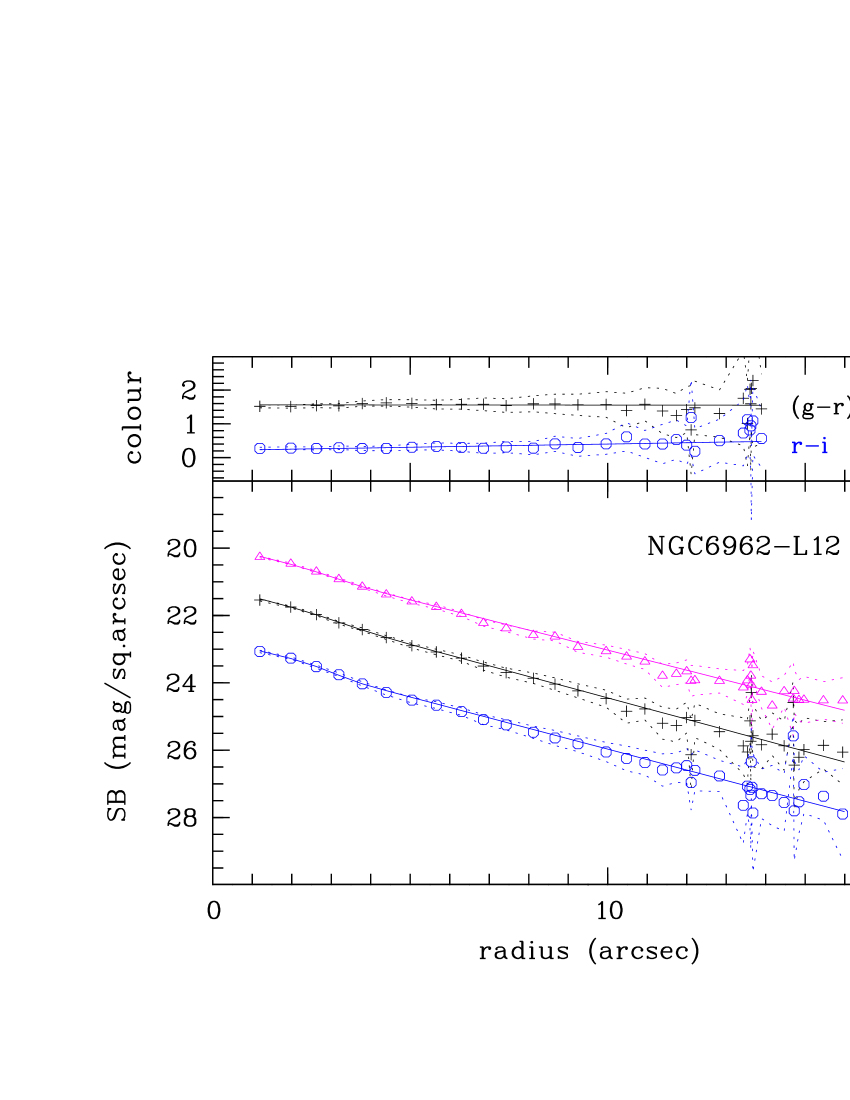
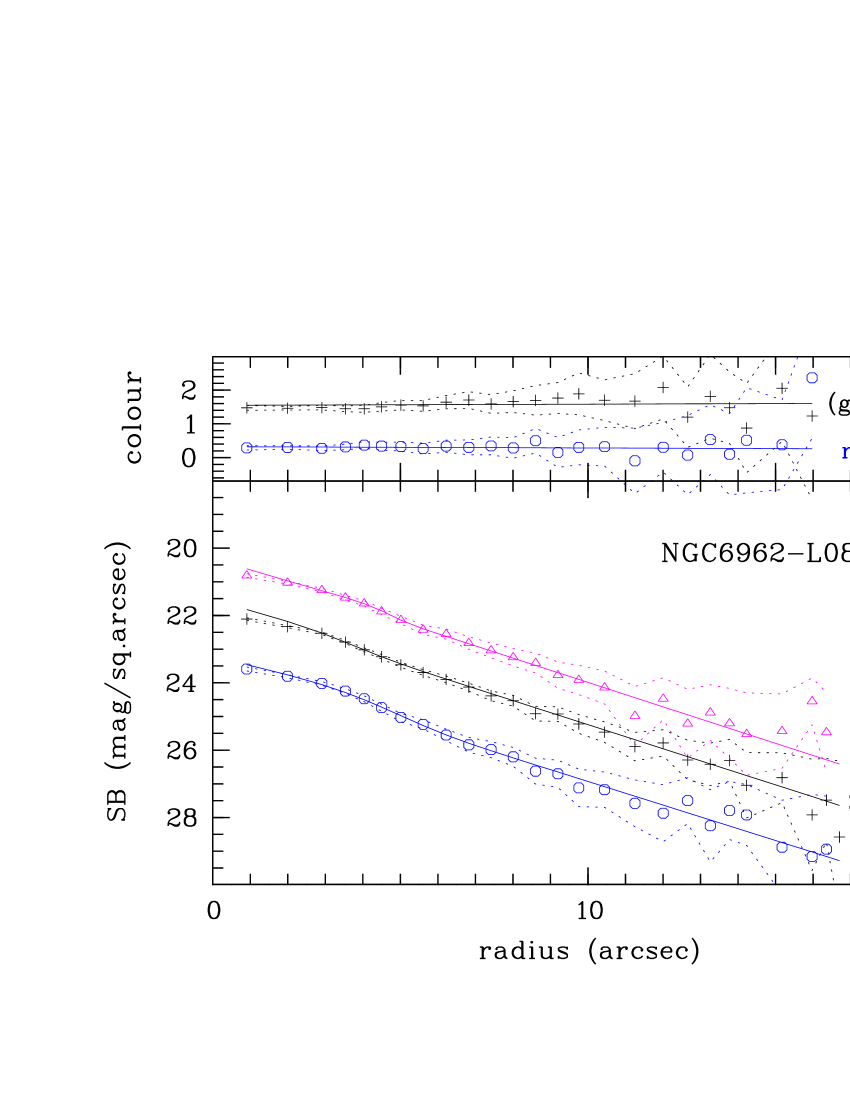
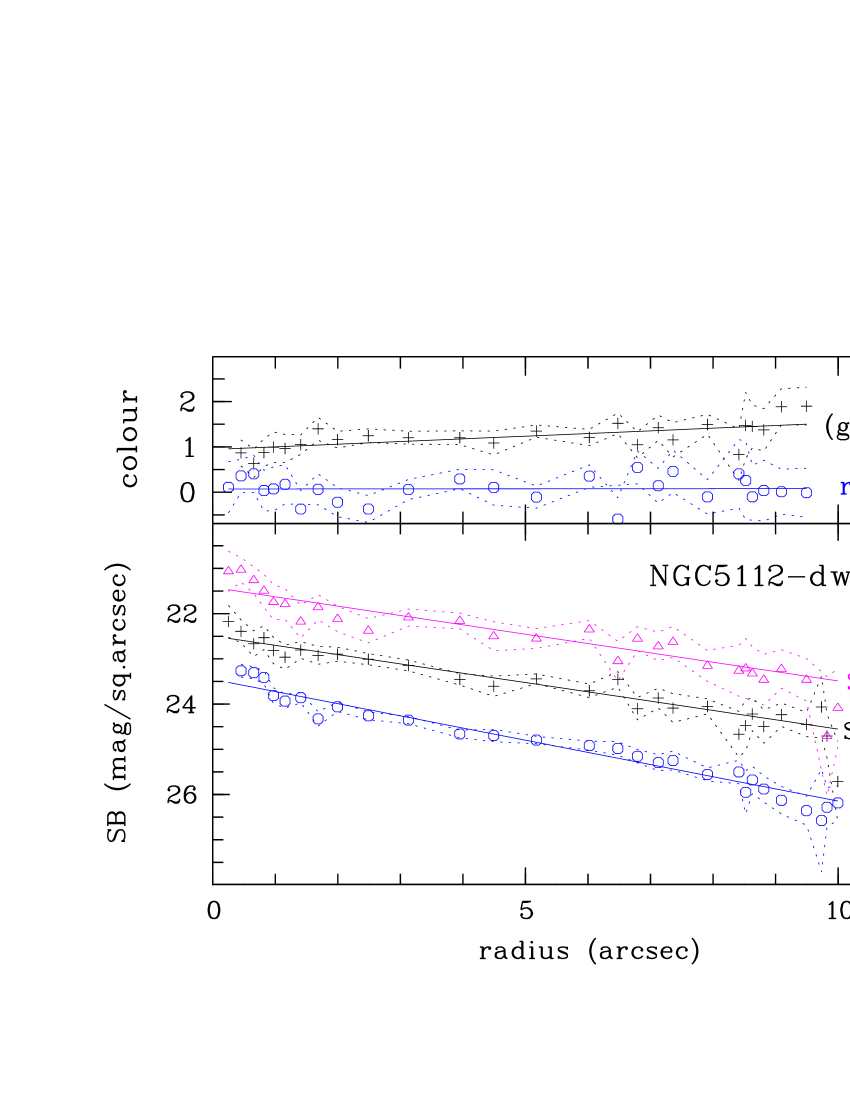
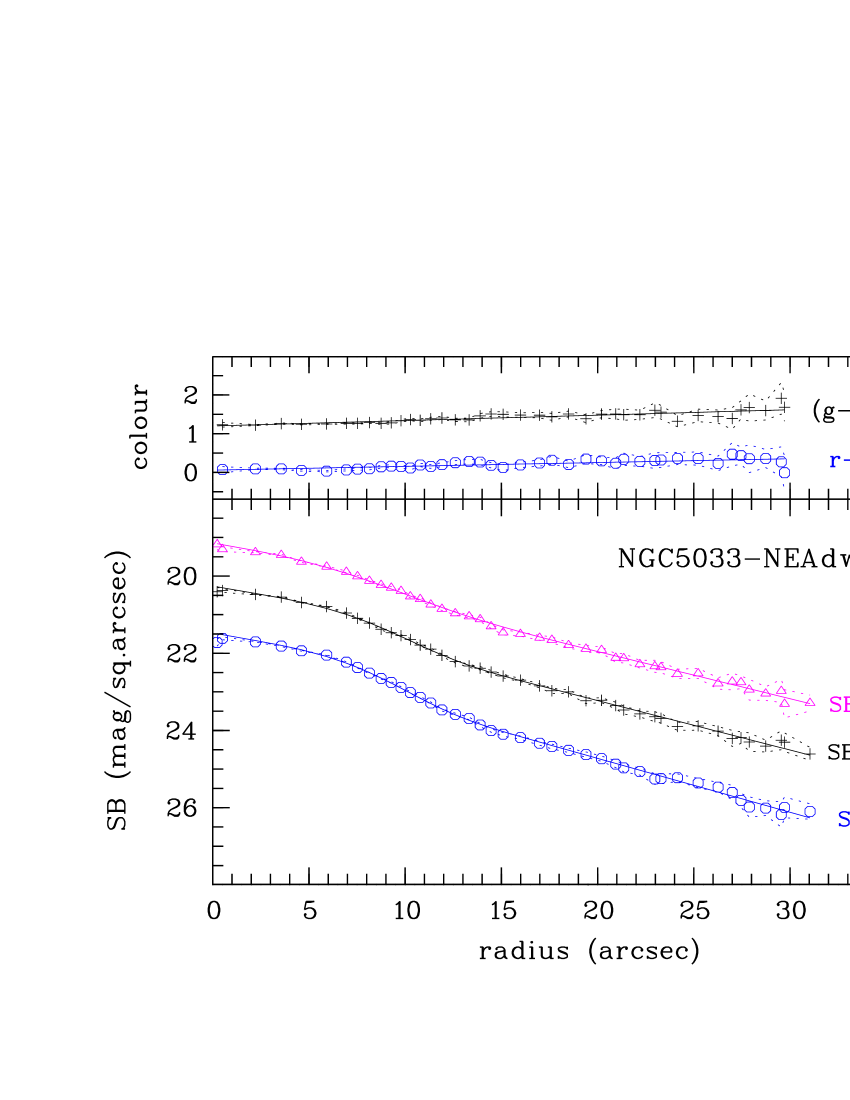
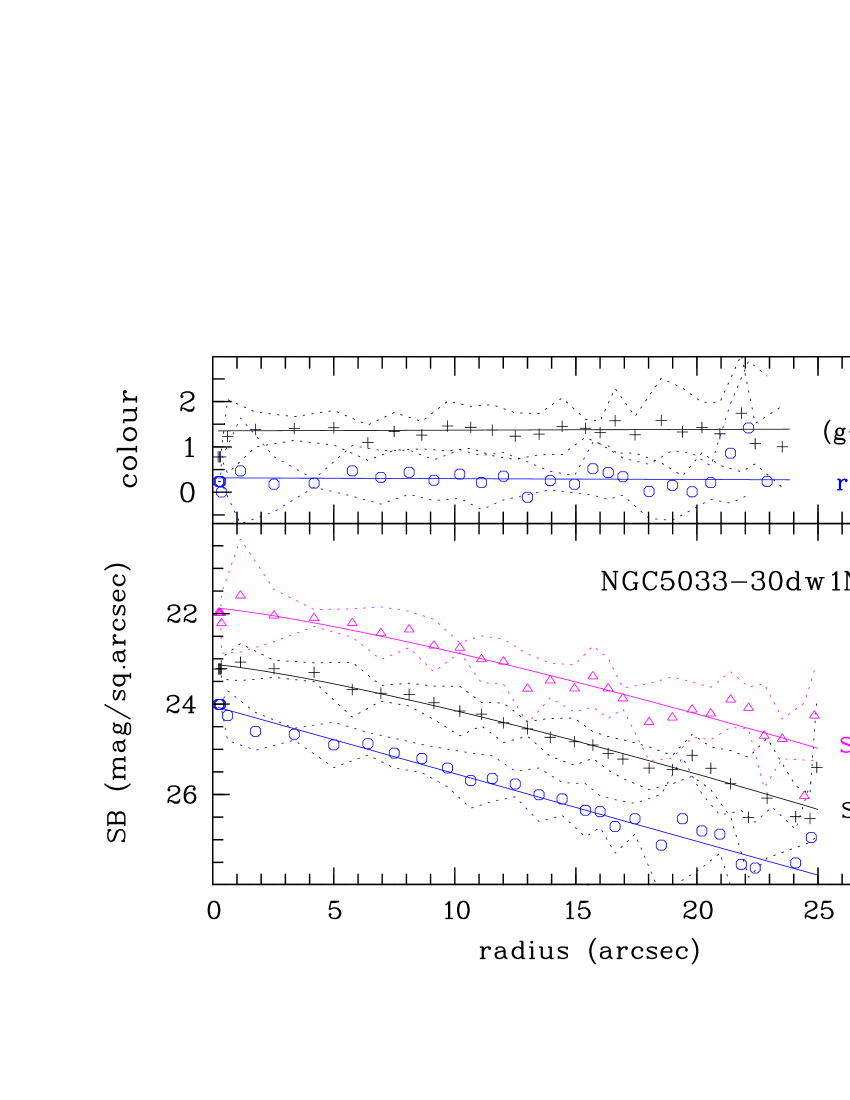
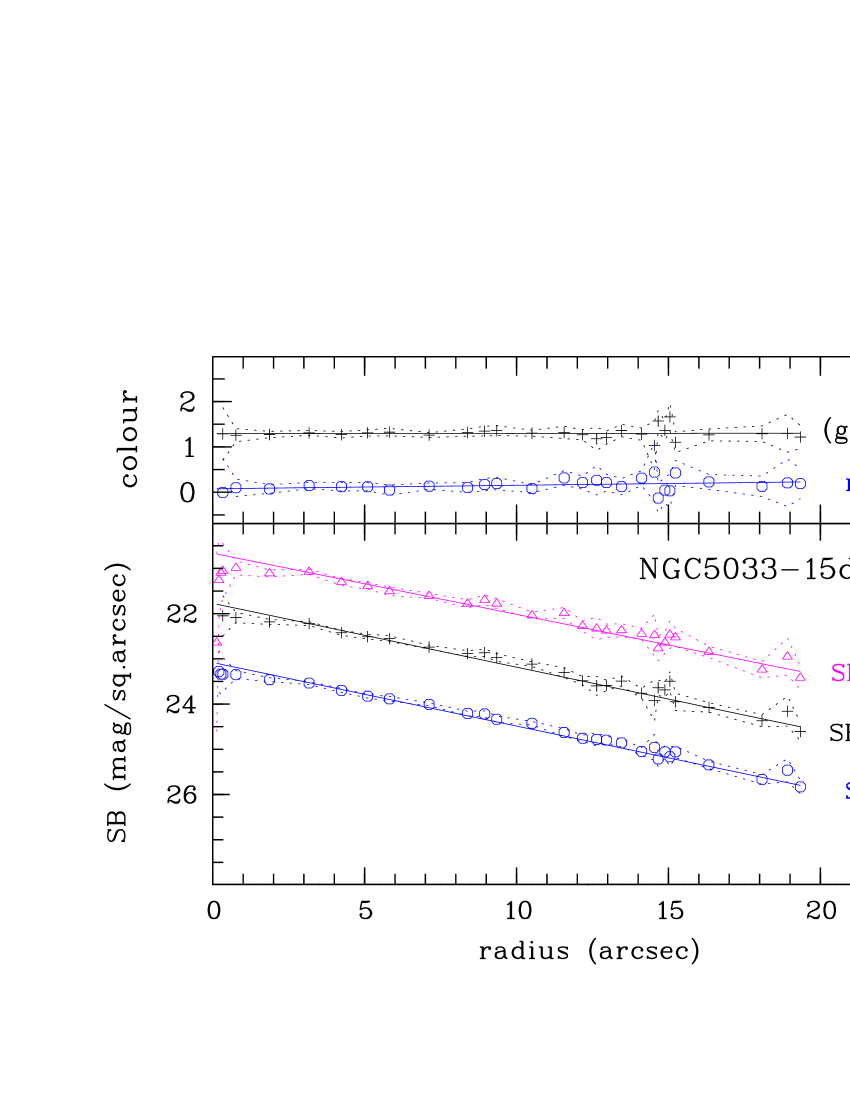
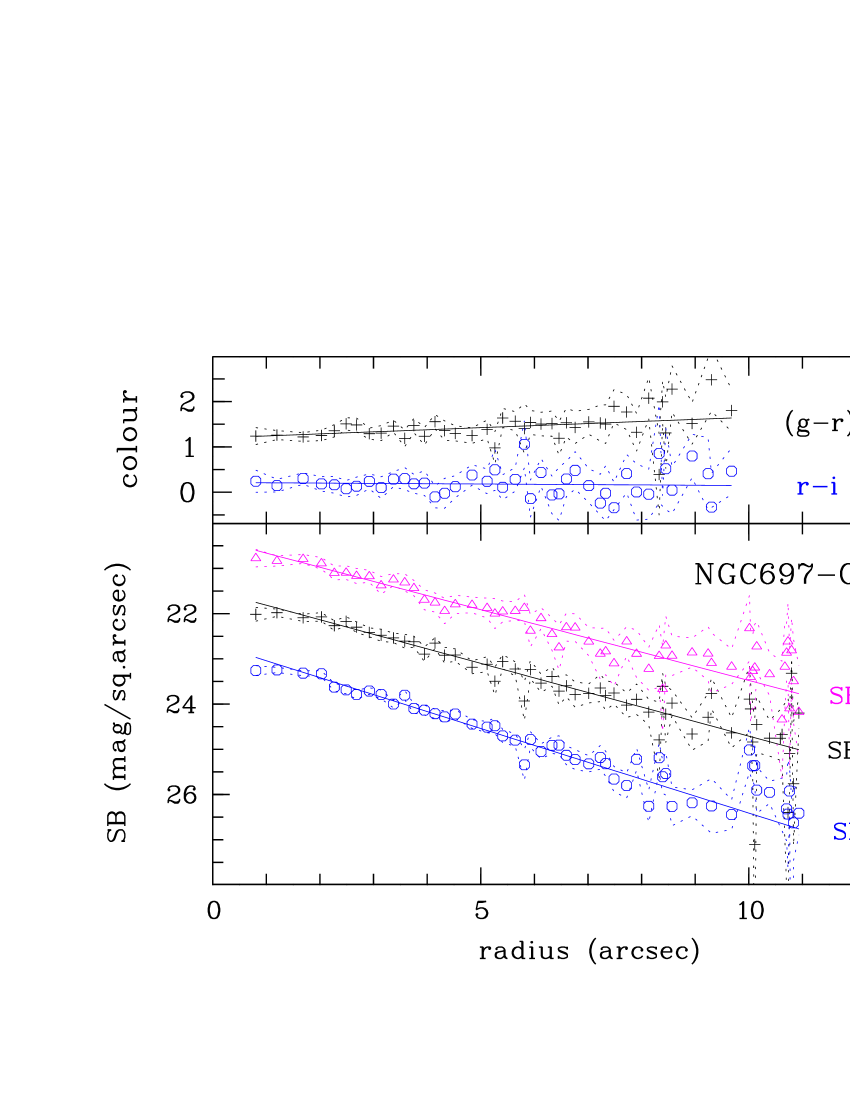
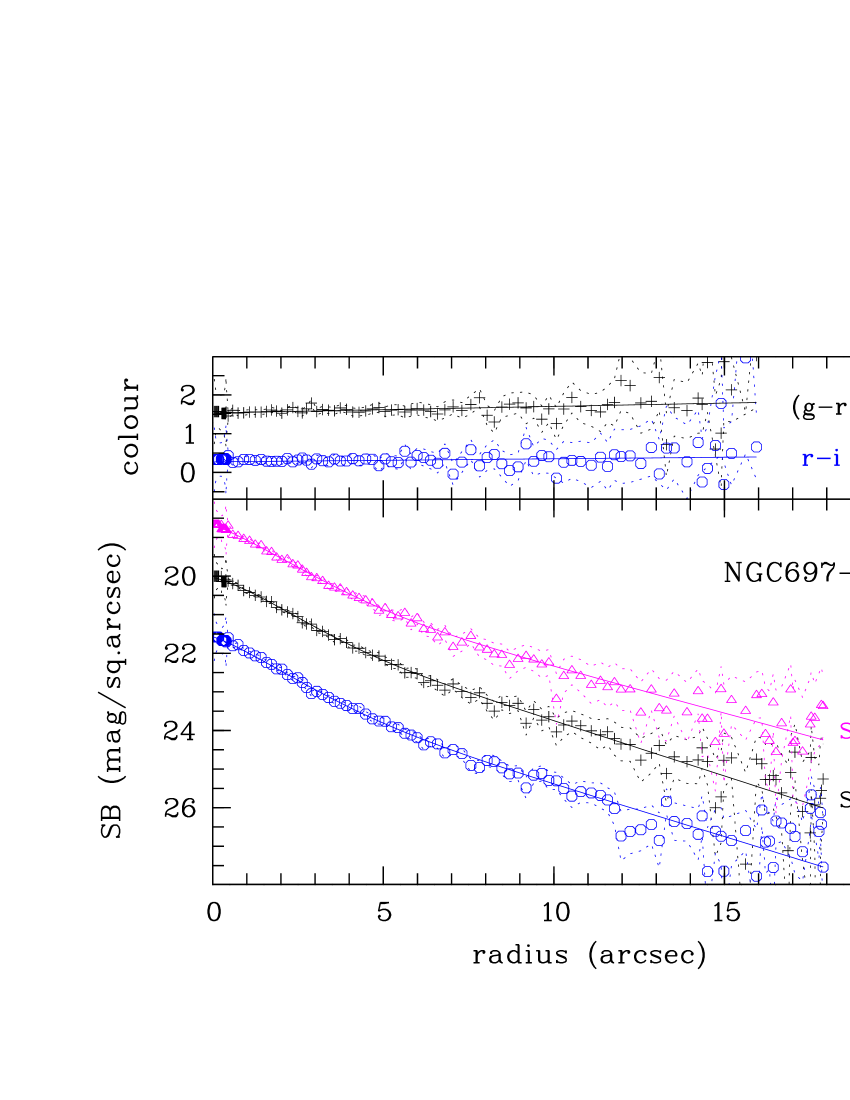
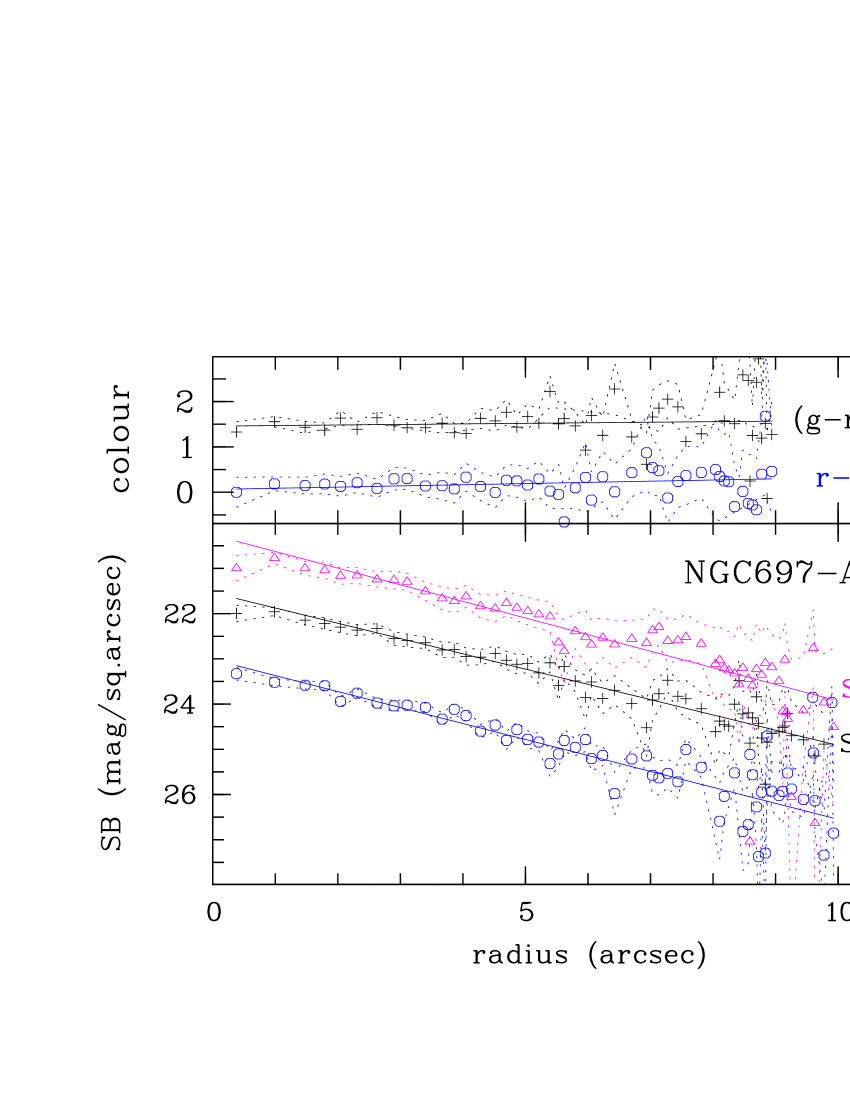
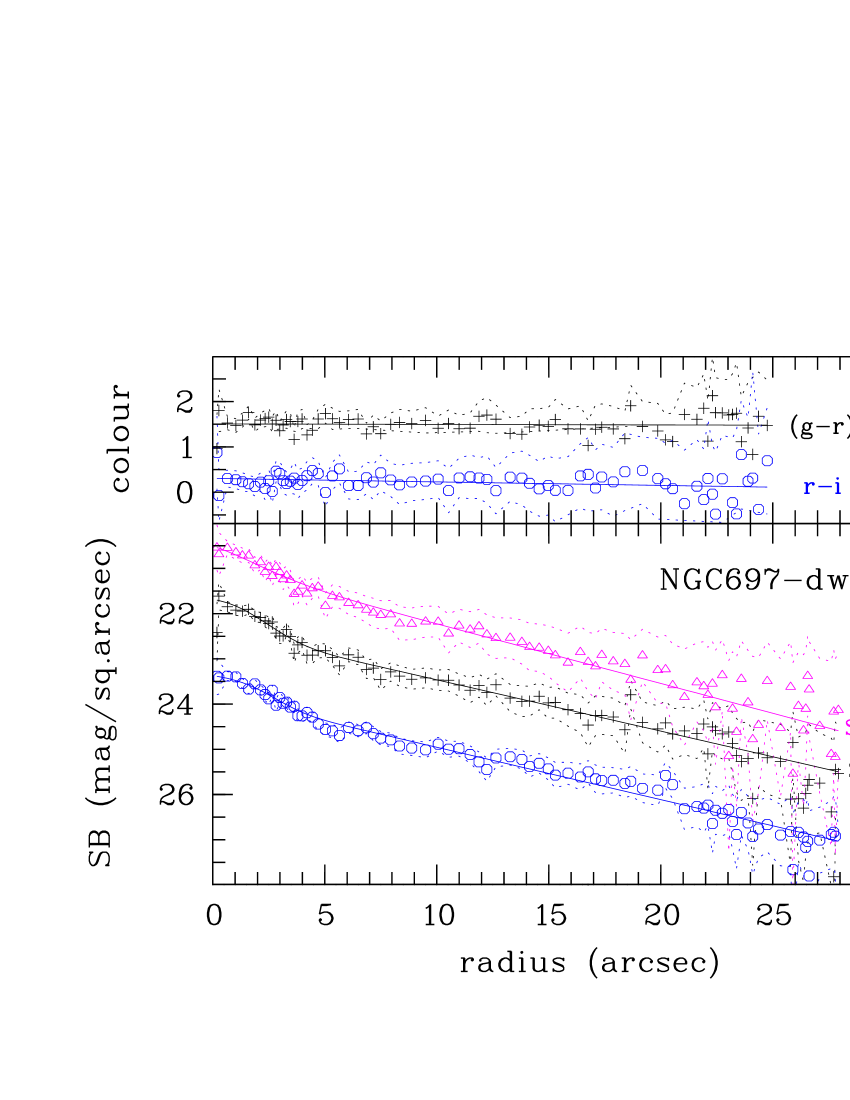
5.3 The SB profile fitting
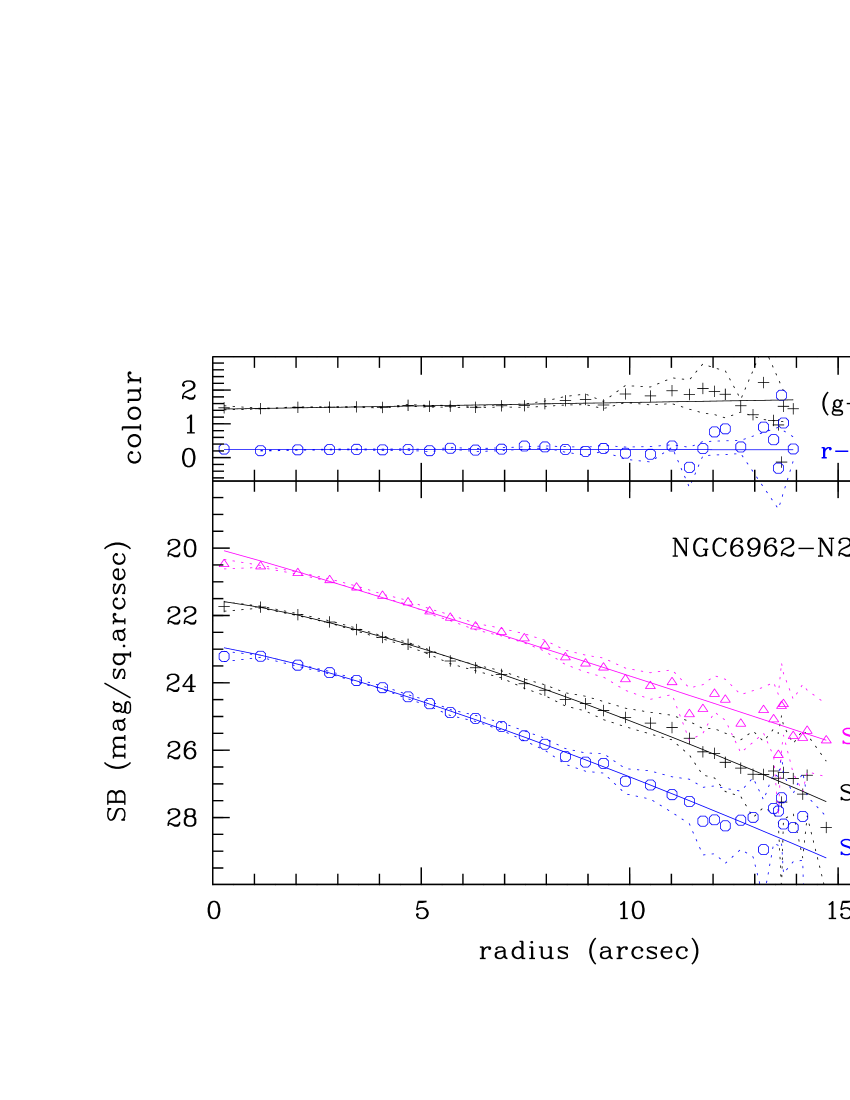
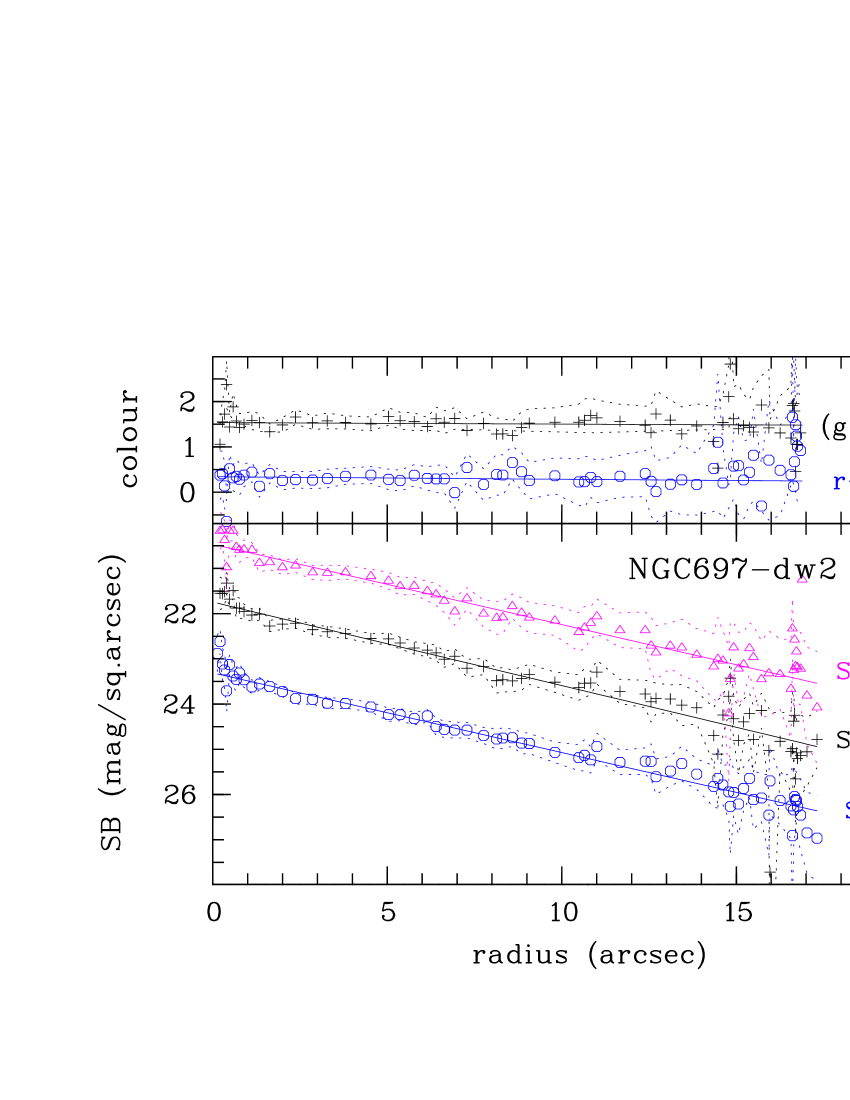
The inspection of the derived SB profiles (see Fig. 12) generally reveal a close agreement with pure exponential disk profile. Only minor deviations are observed in some cases, both, central flattening as well as central brightenings as can be caused by small bulges or nuclei. Depending on the particular profile shape, we fitted the SB profiles either by one single or two Sersic power laws
First, we estimated the extent of outer linear part of the SB profile (comparing the profiles in different bands), fitted it with a pure exponential disk model ( = 1) and determined the best-fitting model parameters (). If the fit residuals show a reliable light excess over the exponential disk model, we fitted it with a second power law. In case of central light depression, as it is common for many LSB dwarf galaxies, we fitted the SB-profile with a single Sersic function with . The model-free effective (half-light) photometric parameters and exponential disk model parameters (if applicable) of galaxies, with new redshift measurements, are given in Table 6.
5.4 Photometric properties of the studied galaxies
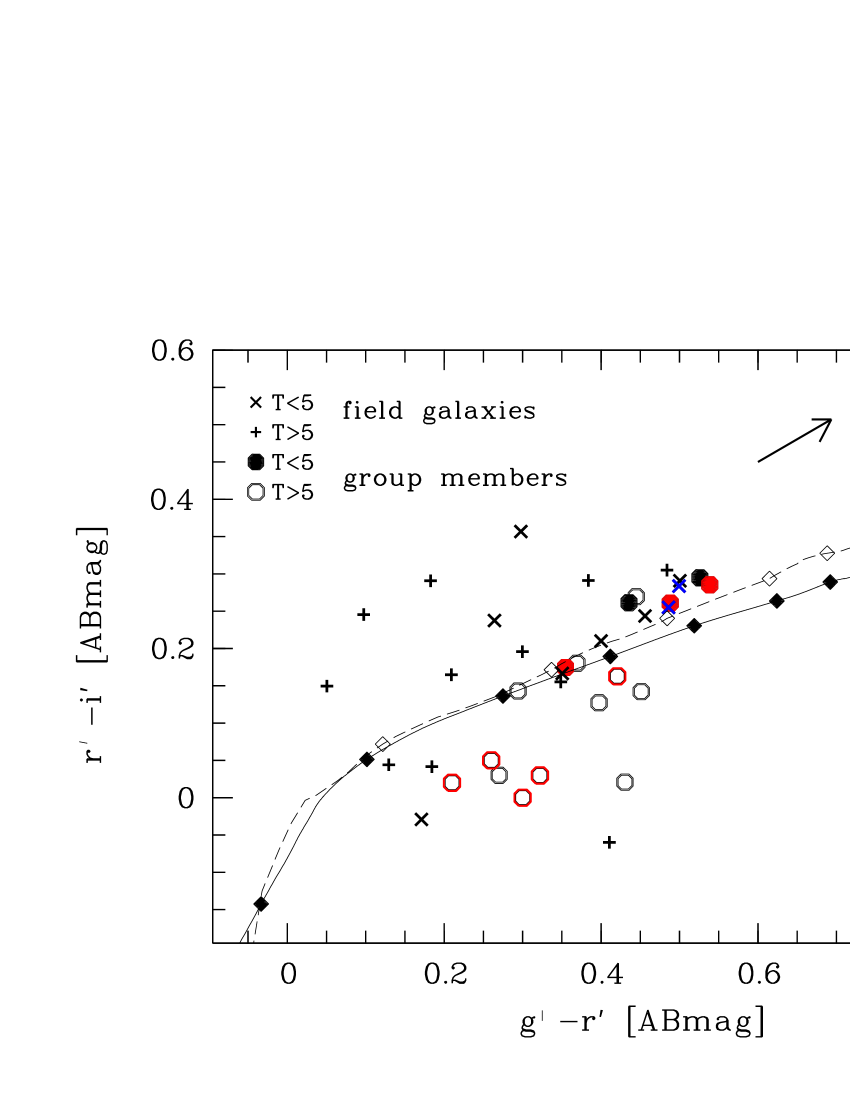
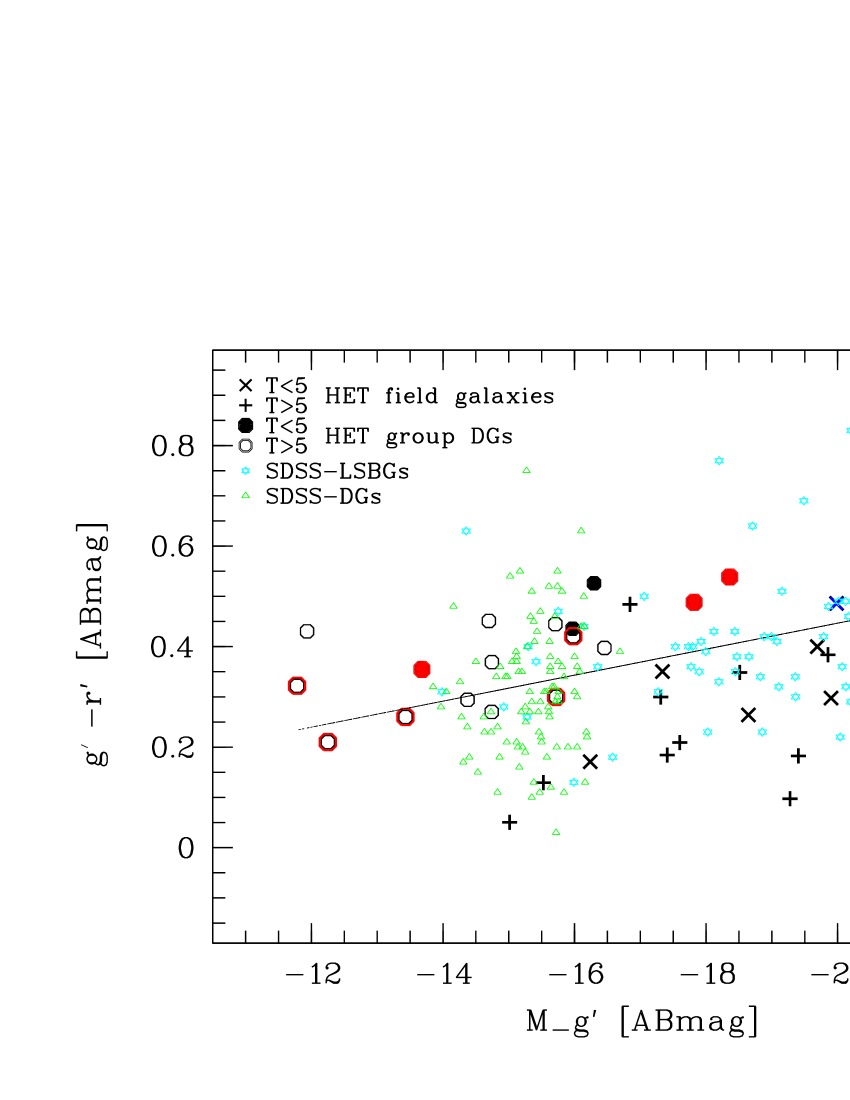
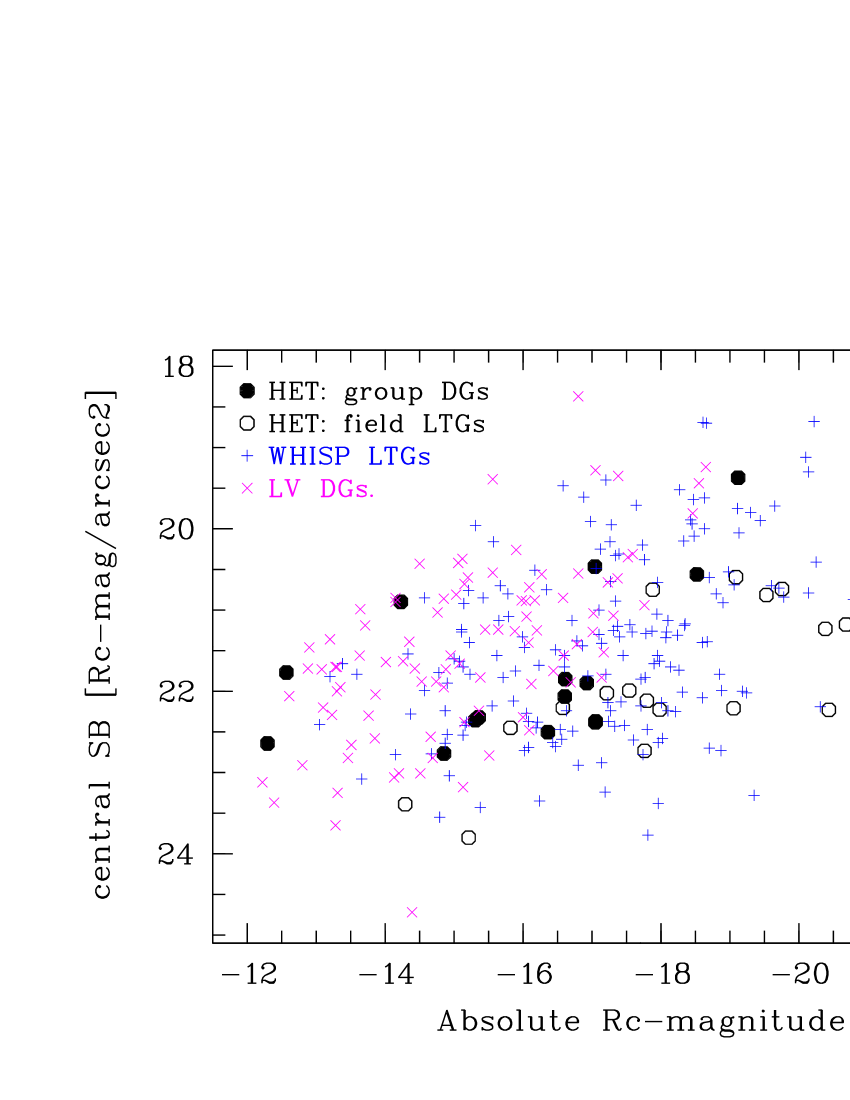
According to our morphological classification the studied sample is largely dominated by late-type () spiral and irregular galaxies, with a few examples of early-type dwarf galaxies. The studied galaxies can be naturally divided into two sub-samples. The first sub-sample consists of 17 new confirmed dwarf(ish) members of six (5 targeted + 1 foreground) groups - hereafter ’group DGs’. One very nearby dSph galaxy NGC 5033-Adw, located within the Local Volume, could be added to this sub-sample. The second sub-sample consists of 26 (mostly late-type) galaxies located in the background of the target groups. Those galaxies are mainly distributed in the lower density ’field’ (sheets/filaments, but also in, at least, one possible group) environment. The main characteristics of these two sub-samples are compared in the Table 7. The new group members are predominantly dwarf (with median luminosity of ) and LSB ( = 22.55 mag arcsec-2) galaxies. The background (’field’) galaxies are 4 mag more luminous than the group dwarfs, show typical Freeman’s disk central SBs and median disk scale length of 2 kpc. Interestingly, the group DGs and the field LTGs have similar median () and () colours (which is close to the mean colour of the SDSS DGs of = 0.45 (ABmag), as given in Barazza et al. [2006]), however they are marginally separated in the colour-magnitude diagram (CMD) in the Fig. 6, and appear to trace different colour-magnitude correlations. The group members trace a narrow sequence on the CMD, possibly having (more) homogeneous stellar populations. The field galaxies of the same luminosity tend to have bluer colours by 0.2 mag, which could be an age and/or metallicity effect. The data of our two samples overlap with the distribution presented by (Geha et al. [2006]) for low mass DGs and the one given by (Kniazev et al. [2004] for LSB galaxies (both derived from SDSS data). The literature data show a wider spread in colour for given magnitude than our group sample again supporting the view that those group members might have a more homogeneous stellar population.
In order to study the colours and star-formation histories (i.e. to
obtain a crude estimate of the stellar population ages) of the observed
galaxies we compare their colours with the GALEV evolutionary synthesis
models (Kotulla et al. [2009]), which were computed using the webform
http://model.galev.org.
Since our galaxy sample being dominated by late morphological types
includes a few early types too, we selected for comparison two (extreme)
models - one with the exponentially declining SFR, typical for ETGs
(ellipticals), and second one with constant SFR, proper for actively
star-forming Sd galaxies. The models with constant SFR have been found
to be typical for the field late-type dwarf galaxies (LTDGs) (e.g.
van Zee 2001) and they can reproduce the colours of the bluest objects.
The single burst followed by exponentially declining SFR models are
able to cover the colours of redder objects with no present time SF.
However, the SFHs of DGs in the Local Group, both the late and early
types, are known to be more complex and constitute a mixture of
multiple bursts and periods of constant SF
(see e.g. Tolstoy et al [2009] for a recent review). In the (observed)
colour-colour diagram (Fig. 6, left) we show
for comparison two GALEV models. Solid line traces the chemically
consistent colour evolution of a late-type (Sd) galaxy and combines
a constant star-formation rate (SFR) with a single star-burst (STB)
at yr (, burst strength 0.7).
Dotted line shows a model of a single (early) STB followed by an
exponentially decreasing SF. (More details of both models are given in
the figure caption). In order to reproduce the reddest observed colours
we have to expect a modest reddening by dust in an amount of 0.25 mag.
The mean stellar ages of the dwarf group members appear to be confined
in a narrow range of 2 - 5 Gyrs. Colours of the field galaxies show a
large dispersion and their age estimates are much more uncertain.
The sequence of galaxies in the colour-colour plot is probably determined
both by the most recent episode of star-formation and also by the
luminosity, as indicated by the rather steep slope of the CMD in
the Fig. 6 (and its large scatter).
We can conclude that the range of observed colours is consistent with
a SFH combining single (or multiple) star-burst(s) with intermediate
periods of constant SFRs. A model with exponentially decreasing SFR
can also reproduce the global colours (Barazza et al. [2006]).
We can (qualitatively) say that the stellar disks of late-type
() field galaxies are, as a mean, marginally bluer (and
probably younger), when compared to the colours of the early-type
() field galaxies. The two reddest galaxies (with oldest
stellar populations) are NGC 772-gal1 and -gal2. These qualitative
age estimates are certainly hampered by the well-known age-metallicity
degeneracy of the optical colours.
In addition to the common SB profiles we also constructed the colour index profiles and determined the radial colour gradients of 34 galaxies with our new detailed photometry, which may give us information on the stellar content and other physical parameters as a function of radius. In about half (55%) of the studied galaxies we found statistically significant (at level) () colour gradients. Positive gradients (i.e. the galaxy is getting redder towards its periphery) are slightly dominating in our sample, in proportion 11 positive to 8 negative gradients. The dwarf group members (14) tend to show positive gradients, with . The five steepest gradients, significant at level, are all positive. The (more luminous) ’field’ galaxies (20 of them with new photometry) tend to show negative gradients, , among them 6 (30%) at , and 4 (20%) at are all with negative gradients.
There are observational indications that massive galaxies are growing inside-out fashion but the DGs show no gradients in age, i.e. no gas accretion in dwarf satellites residing in the DM halo of the parent galaxy (Fossati et al. [2013]). Environmentally conditioned differences in SF properties have been noted between the cluster and field early-type disk galaxies, particularly, enhanced SF in central and truncated SF in outer disk of cluster galaxies (Bretherton et al. [2013]). Generally, most of LSBDGs have been found revealing flat colour profiles, however, both negative and positive colour gradients were noted for some dIrr’s earlier (e.g. Patterson & Thuan [1996]), and for LSBGs in nearby groups (Bremnes et al. [1998], [1999]). A variety of scenarios exist to explain the transformation of spiral-rich field galaxy population into early-type rich (S0/dE/dSph) population in clusters and groups of galaxies. Removal of gaseous halos, outer and/or inner HI disks leads to SF strangulation in long time-scales or SF truncation on shorter ones (Kotulla et al. [2009]).
Thus, in line with the above considerations, the marginal colour
differences between the group and field/bkg galaxies in our small sample,
could be interpreted as an effect of gas depletion predominantly in
outer fragile disks of dwarf satellite galaxies in groups, which results
in positive colour gradients. The field/background disk galaxies are
evolving in common inside-out fashion.
However, the colour profiles and their gradients are highly sensitive
to proper sky subtraction issues. Despite of special effort made
previously by sky level determination, the reliability of detected
(generally shallow) gradients should be confirmed by new deep
imaging studies.
5.5 The photometric scaling relations
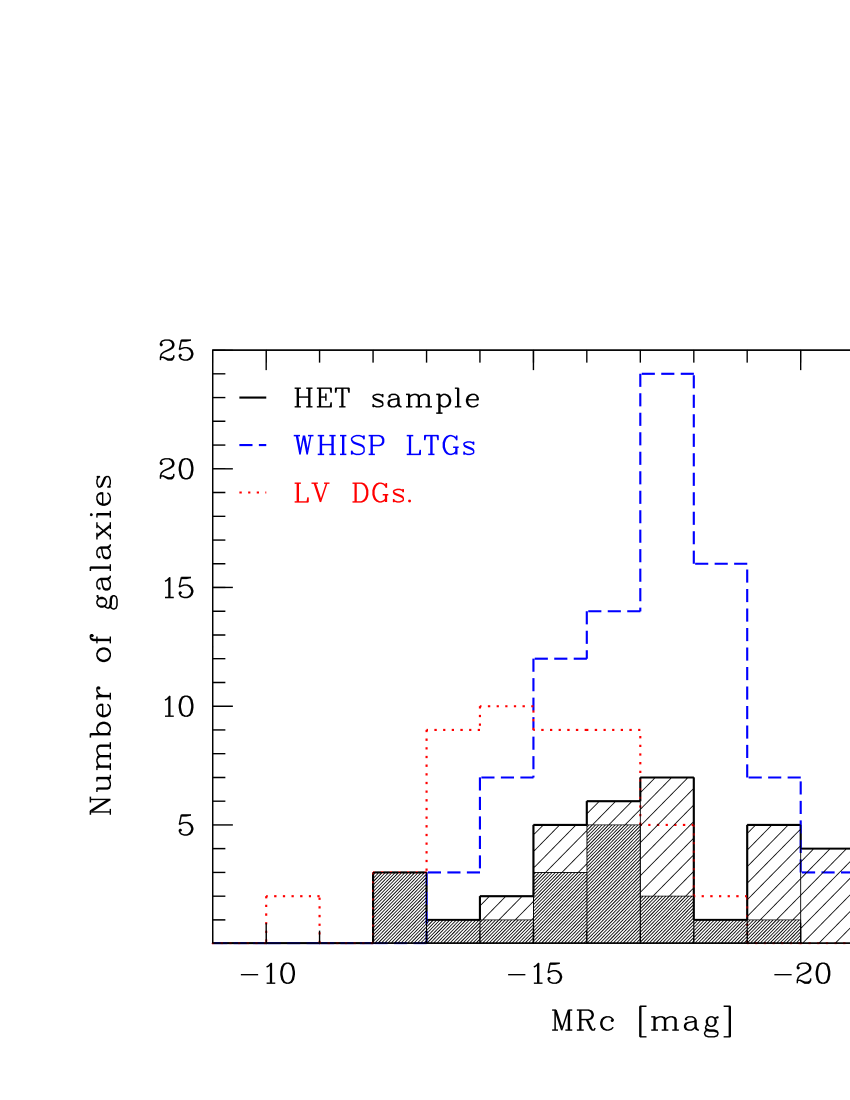
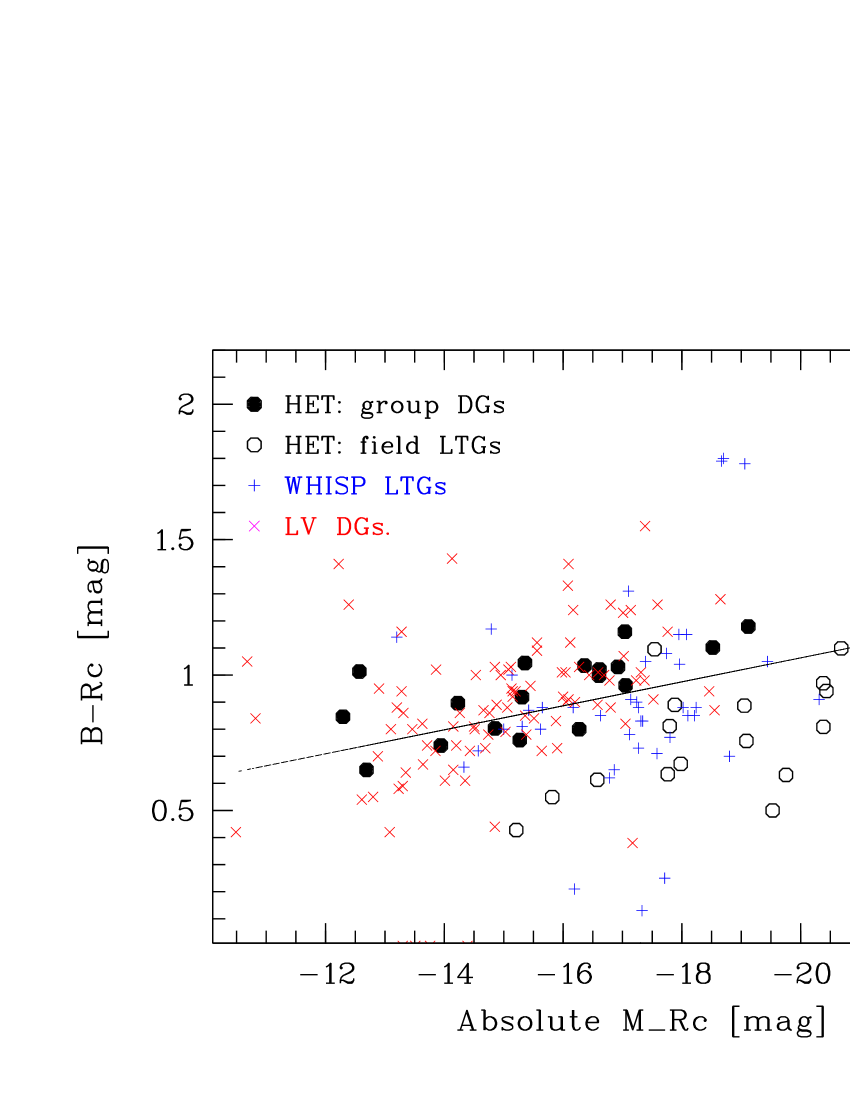
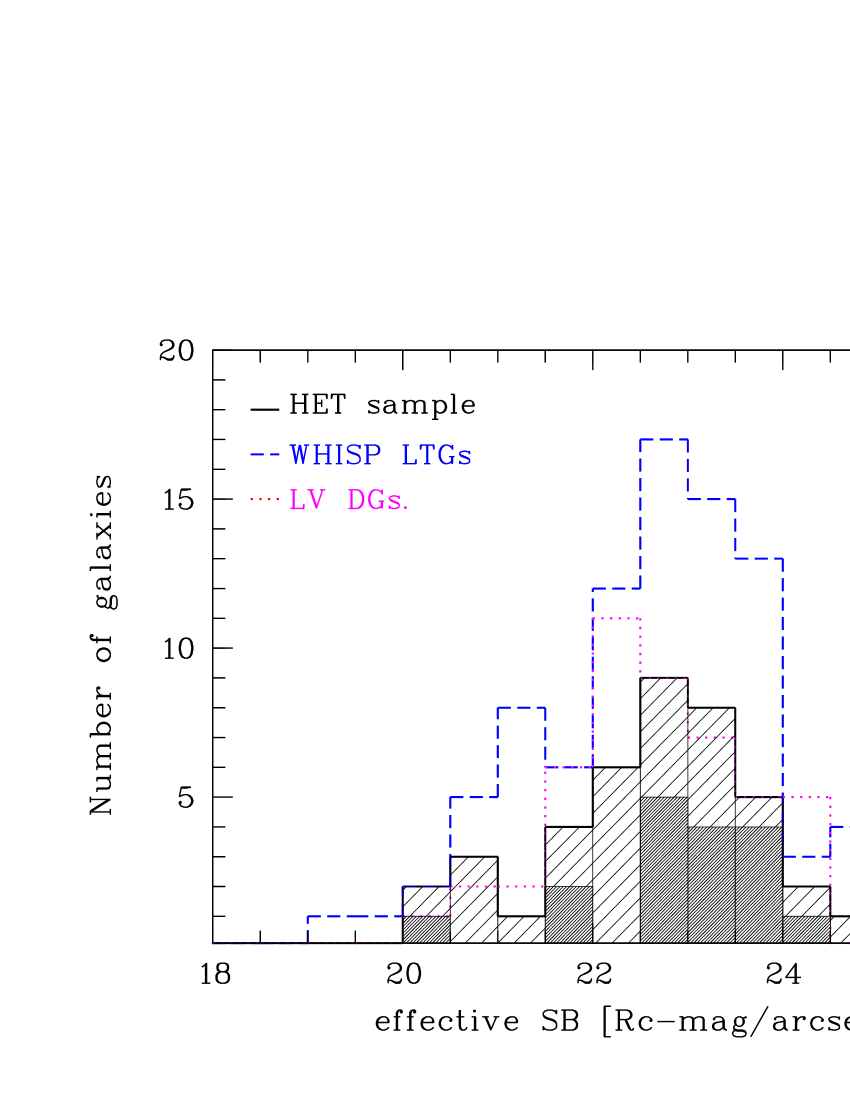
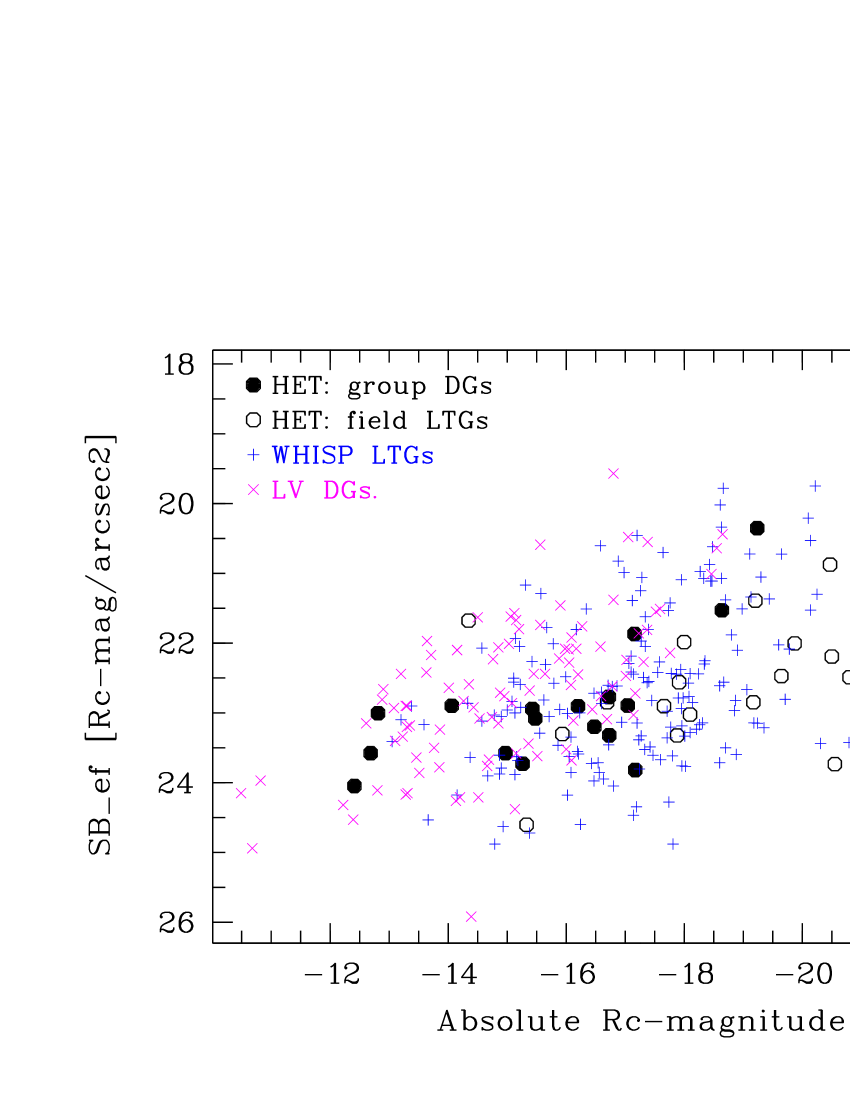
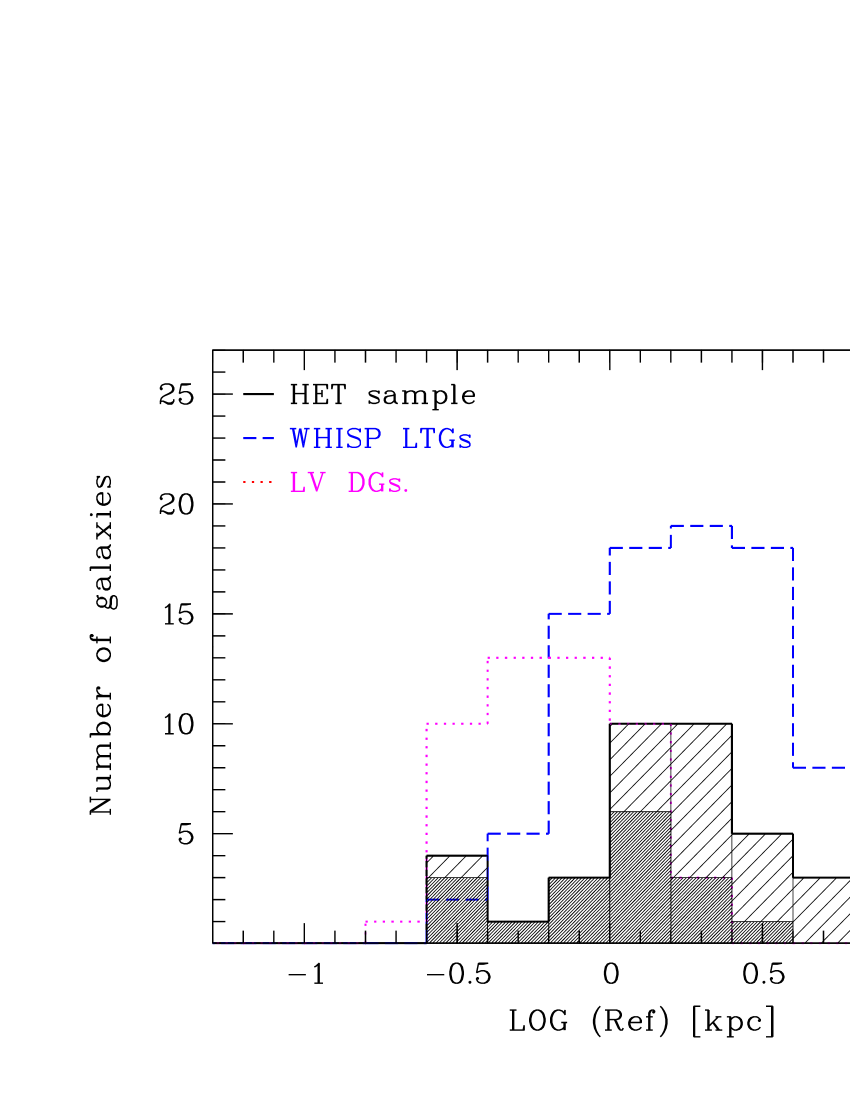
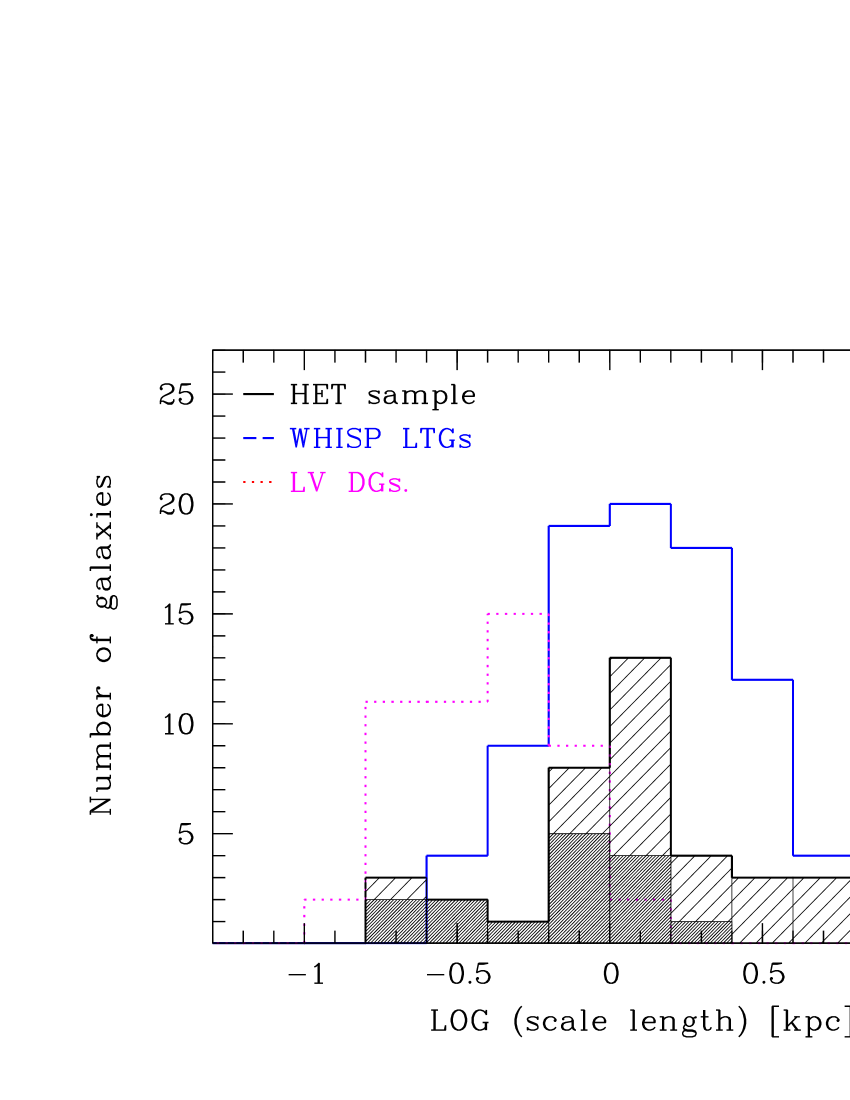
Next, we analyse the relations of effective and exponential disk model and colour characteristics with the total luminosity, i.e. the photometric scaling relations. In order to put the photometric properties of the studied galaxies into a wider context, we compare our data with two representative samples of nearby (mostly late-type and/or dwarf) galaxies: (1) with the Westerbork HI survey of 171 spiral and irregular galaxies (WHISP project of Swaters & Balcells [2002]), and (2) with a combined sample of the 98 Local Volume (LV) late-type dwarf galaxies (LV-DGs) from Parodi et al. ([2002]), and Sharina et al. ([2008]). Since the data in the comparison samples are given in the Johnson-Cousins , we have converted the SDSS , and (AB-magnitudes) into the Johnson-Cousins (Vega-magnitudes) using the transformation equations given in the Cross et al. ([2004]).
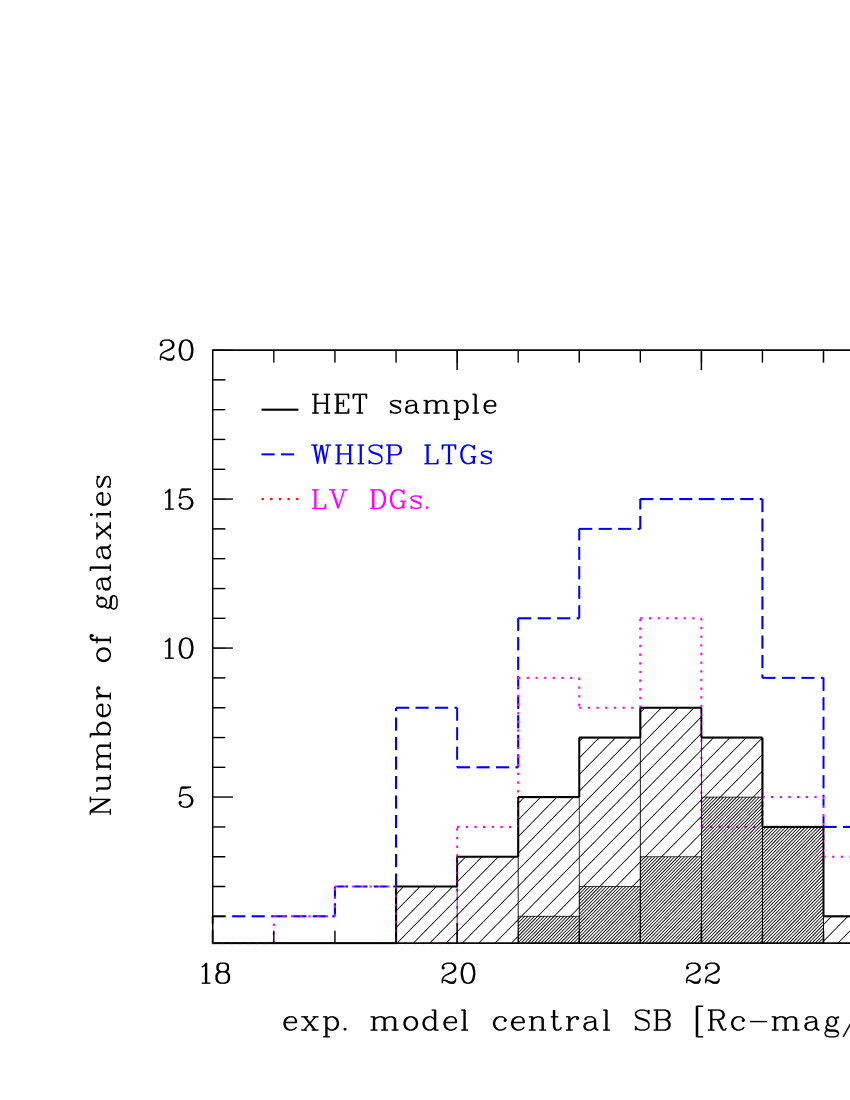
In the Figs. 7 - 11 we show the histograms of the effective and exponential disk parameters and colours as well as their scaling relations with the absolute magnitude . In the Table 8 we compare the mean and median values of the SB, colour and linear scale characteristics of our HET sample and of both reference samples. The photometric characteristics of the HET group DGs (absolute magnitudes, colours, linear scale) fit nicely into the range, defined by both (local) comparison samples, except the disk central SBs of the HET DGs being, as a mean, 0.5 mag fainter. The HET ’field’ (bkg) galaxies are a random sample of (late-type) disk galaxies: their disk central SB 22.0 (median value) is close to that of the canonical Freeman’s disks 21.75 Bmag arcsec-2 (Freeman [1970]); their mean colours and are typical for the Scd - Im galaxies (Fukugita et al. [1996]), and their mean disk scale length of = 3.7 kpc being very close to the average disk scale length of non-interacting disk galaxies in the SDSS of 3.792.05 kpc, as given in Fathi et al. ([2010]).
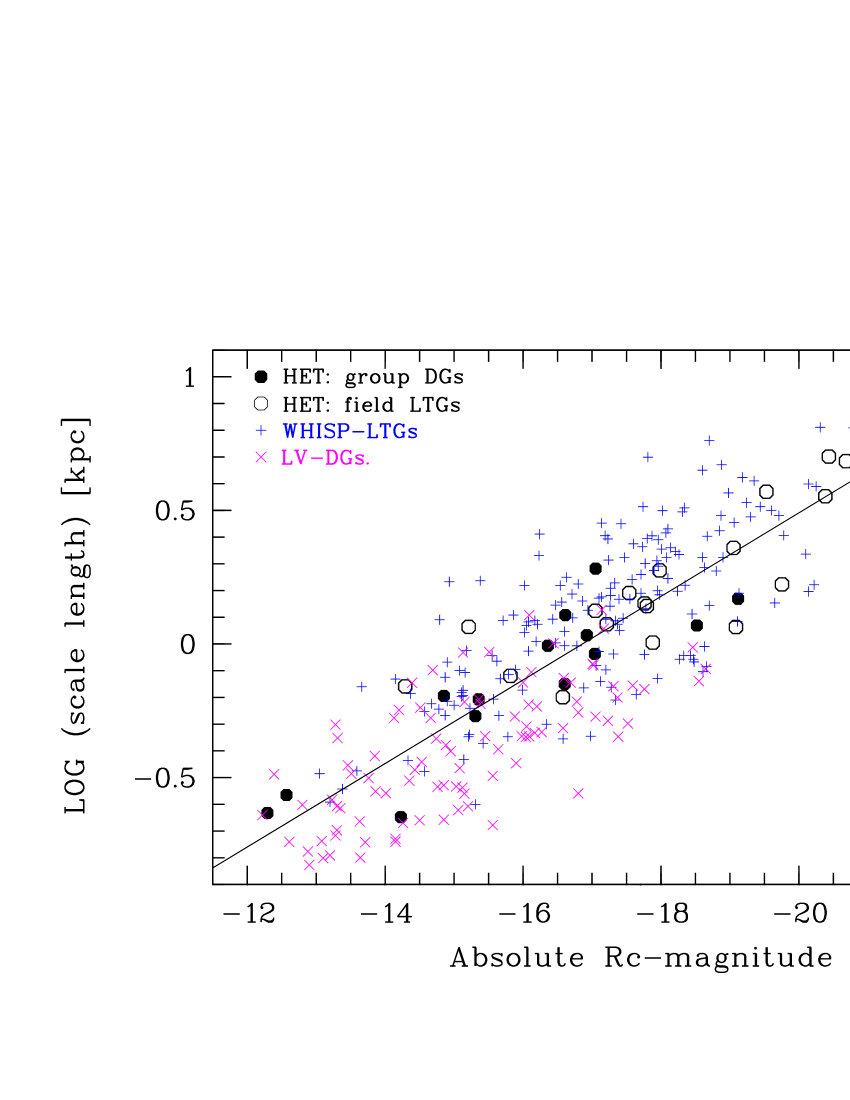
The photometric scaling relations are useful tools, e.g. when evaluating the formation scenarios of galaxies and/or addressing the question of the environmental influence on the evolution of galaxies. Several global and local properties of disk galaxies, e.g. the nearly exponential stellar density and light profiles, and their correlations are a natural consequence of the inside-out disk formation scenario under the assumption of constancy of spin parameter in time and angular momentum conservation during the gas collapse within hierarchically growing dark matter halos. (Avila-Reese & Firmani. [2000]). Their models predict the following relation between the luminosity and the Holmberg’ radius (equal to ).
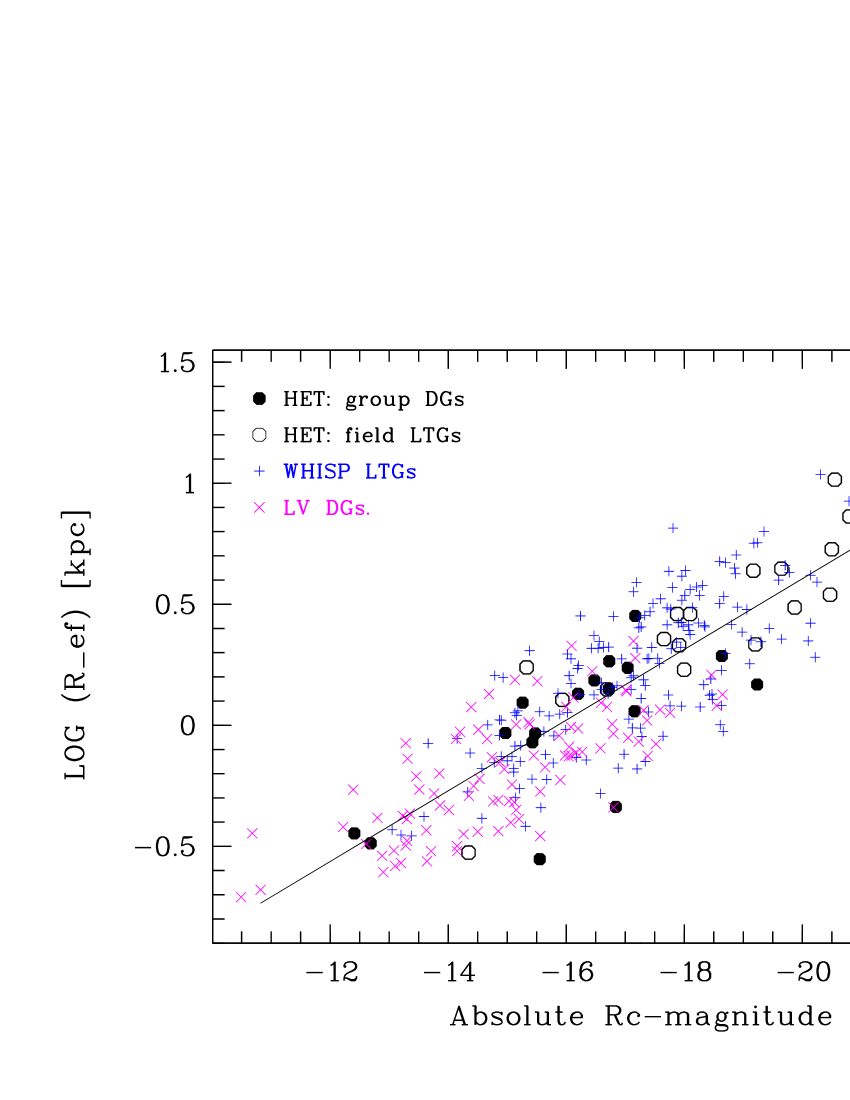
The newly observed galaxies fit nicely the distribution of the local LTGs in the and planes (Fig. 10, 11). In the plane the galaxies of the combined data-set of galaxies of our and the reference samples are distributed in a narrow stripe with a well defined slope of (), which is similar to the relation predicted in the model of Avila-Reese & Firmani ([2000]). Sharina et.al. ([2008]) determined for their LV sample a relation of , which is consistent with the central SB constancy of Freeman’s disks. Actually, the disk central SB slightly increases with increasing luminosity in the combined data-set (Fig. 10), as . This slope is valid for the dwarf galaxies in the range , too, however with a large scatter. The scatter in SBs at a given luminosity certainly reflects contributions by photometry errors, but also may be influenced by physical mechanisms of the disk formation (Sharina et al. [2008], Dalcanton et al. [1997]). Large scatter renders the correlation uncertain and brings different authors to different conclusions about its reality. For example, Sharina [2008] found a (strong) correlation of , valid both for the disk central SB () and for the effective SB (). This correlation is consistent with relation, valid for the LG DGs (Dekel & Silk [1986]) and corresponds to the gas outflow model from the DGs (Larson 1974). On the other hand, Carrasco et al. ([2001]) found no correlation in the plane, and a weak correlation in the plane. They conclude that correlations in these two planes may be produced by selection effects.
As evident in Figs 9 and 11 our combined data-set shows a strong correlation between the linear scale () and total luminosity in the form . A statistically significant correlation between the SB and luminosity could be traced in Figs 8 and 10 too, despite of large scatter, and it results in a similar luminosity- radius relation (as ).
6 Summary and conclusions
The results of the given study can be summarised as follows:
- we have selected a small sample of five X-ray dim, late-type dominated,
and reasonably isolated groups of galaxies in and around the Virgo
super-cluster, at the distances where dwarf galaxies could have been
distinguished.
- we have selected about 60 dwarf galaxy candidates in these groups
based on their SB and colour characteristics and on their morphology.
The follow up spectroscopy of the 55 highest priority candidates
with the HET LRIS has resulted in 48 new redshift determinations. The
new data have shown that 17 galaxies are true group members, 2 are
DGs located in a newly detected foreground group; 28 galaxies
are late-type galaxies in the background of studied groups.
We conclude a nearly 55% success rate in morphological
classification of dwarf galaxies.
- 19 galaxies (i.e. 50% of all detections) with sufficiently
high S/N ratios show emission line ratios typical for star-forming
HII dwarfs;
- detailed surface photometry of the 38 studied galaxies on the
SDSS , and frames has revealed several cases of
large differences (up to 3 mag), when comparing newly derived magnitudes
with those in SDSS photometric catalogue, caused by poor object
de-blending (detection) and shredding by automatic pipeline reduction of
large, very LSB galaxies;
- photometric effective parameters () and exponential
disk model parameters () of the studied galaxies fit
nicely to the distribution of corresponding characteristics of the
Local Volume dIrr’s and of the late-type galaxies of the WHISP sample,
defining a narrow/tight scaling relation between the exponential
scale length (also ) and luminosity
(or ). Our studied galaxies show a shallower
dependency between the central (and also effective) SB and luminosity
than galaxies in two comparison samples. This is mainly caused be our
target selection criteria - selecting preferentially LSB galaxies.
- the dwarf members of the groups show positive colour gradients, e.g.
getting redder to their rims. This might be indicative for a outside-in
dying out of the star formation activity contrary to what is discussed
for the star formation history of large disk galaxies.
Acknowledgements
We are grateful to the anonymous referee whose comments and suggestions were most helpful in improving the paper. It is a pleasure to acknowledge the support by the Resident Astronomers of the Hobby-Eberly Telescope (HET) which made the observations possible despite the many hardly visible low surface objects involved in the program. We especially acknowledge the efficient and very helpful on-line discussion with the ’RAs’ during the execution of our targets within the general queue scheduling of the HET. The Hobby-Eberly Telescope is a joint project of the University of Texas at Austin, the Pennsylvania State University, Stanford University, Ludwig-Maximilians-Universität München, and Georg-August-Universität Göttingen. The HET is named in honor of its principal benefactors, William P. Hobby and Robert E. Eberly. The Marcario Low Resolution Spectrograph is named for Mike Marcario of High Lonesome Optics who fabricated several optics for the instrument but died before its completion. The LRS is a joint project of the Hobby-Eberly Telescope partnership and the Instituto de Astronomá de la Universidad Nacional Autonoma de Mexico. The research of JV has been supported by the Estonian Science Foundation grants 6106 and 7765, by the Estonian Ministry for Education and Science research project SF0060067s08, and by the European Structural Funds grant for the Centre of Excellence ”Dark Matter in (Astro)particle Physics and Cosmology” TK120. This study has made use of the NASA/IPAC Extragalactic Database (NED) which is operated by the Jet Propulsion Laboratory, California Institute of Technology, under contract with the National Aeronautics and Space Administration, the STScI Digitized Sky Survey (DSS), and the Sloan Digital Sky Survey (SDSS).
References
- [2000] Avila-Reese, V., & Firmani, C. 2000, RMxAA, 36, 23
- [2006] Barazza, F.D., Shardha, J., Rix, H.-W., Barden, E., Bell, E.F., Caldwell, J.A.R., McIntosh, D.H., Meisenheimer, K., Peng, C.Y., & Wolf, C. 2006, ApJ, 643, 162
- [1992] Barnes, J. E., & Hernquist, L. 1992, ARA&A, 30, 705
- [2007] Belokurov, V., Zucker, D.B., Evans, N.W., etal. 2007, ApJ, 654, 897
- [1996] Bertin, E., & Arnouts, A. 1996, A&A, 117, 393
- [1994] Binggeli, B. 1994, in Panchromatic View of Galaxies. Their Evolutionary Puzzle, eds. G. Hensler, C. Theis, & J.S. Gallagher, Gif-sur-Yvette:Edition Frontiers, 173
- [2005] Blanton, M.R., Schlegel, D.J., Strauss, M.A., et al. 2005, AJ, 129, 2562
- [2007] Blanton, M.R., & Roweis, S. 2007, AJ, 133, 734.
- [1998] Bremnes, T., Binggeli, B., & Prugniel, P. 1998, A&AS, 129, 313
- [1999] Bremnes, T., Binggeli, B., & Prugniel, P. 1999, A&AS, 137, 337
- [2000] Bremnes, T., Binggeli, B., & Prugniel, P. 2000, A&AS, 141, 211
- [2013] Bretherton, C.F., Moss, C., & James, P.A. 2013, A&A, 553, 67
- [1985] Bretschinger, E. 1985, ApJS, 58, 39
- [1997] Carlberg, R.G., Yee, H.K.C., & Ellington, E. 1997, ApJ, 478, 462
- [2001] Carrasco, E.R., Mendes de Oliveira, C., Infante, L., & Bolte, M. 2001, AJ, 121, 148
- [2012] Chernin, A.D., Teerikorpi, P., Valtonen, M.J., Dolgachev, V.P., Domozhilova, L.M., & Byrd, G.G. 2012, A&A, 539, A4
- [2009] Chiboucas, K., Karachentsev, I.D., & Tully, R.B. 2009, AJ, 137, 3009
- [2010] Chilingarian, I.V., Melchior, A.L., & Zolotukhin, I.Yu. 2010, MNRAS, 405, 1409
- [2006] Cortese, L., Gavazzi, G., Boselli, A., Franzetti, P., Kennicutt, R.C., O’Neil, K., & Sakai, S. 2006, A&A, 453, 847
- [2009] Cote, S., Draginda, A., Skillman, E.D., & Miller, B.W. 2009, AJ, 138, 1037
- [2009] Crnojevic, D., Grebel, E.K., & Koch, A. 2009, AN, 330, 1001
- [2004] Cross, N.J.G., Driver, S.P., Liske, J. et al. 2004, MNRAS, 349, 576
- [1997] Dalcanton, J.J, Spergel, D., & Summers, F. 1997, ApJ, 482, 659
- [1986] Dekel, A., & Silk, J. 1986, ApJ,303, 39
- [2010] D’Onghia, E., & Lake, G. 2008, ApJ, 686, L1
- [2009] Eigenthaler, P., & Zeilinger, W.W. 2010, A&A, 511, 12E
- [1974] Einasto, J., Saar, E., & Chernin, A.D. 1974, Nature, 252, 111
- [1975] Einasto, J., Kaasik, A., Kalamees, P., & Vennik, J. 1975, A&A, 40, 161
- [1994] Fairall, A.P., Paverd, W.R., & Ashley, R.P. 1994, in ”Unveiling Large-Scale Structures Behind the Milky Way”, eds. C. Balkowski & R.C. Kraan-Korteweg, ASP Conf. Ser. 67, 21
- [2008] Fardal, M. A., Babul, A., Guhathakurta, P., Gilbert, K. M., & Dodge, C. 2008, ApJ, 682, L33
- [2010] Fathi, K., Allen, M., Boch, T., Hatziminaoglou, E., & Peletier, R.F. 2010, MNRAS, 406, 1595
- [2013] Fossati, M., Gavazzi, G., Savorgnan, G., Furnagalli,M., Boselli, A., Gutierrez, L., Hernandez Toledo, H., Giovanelli, R., & Haynes, M.P. 2013, A&A, 553, 91
- [1970] Freeman, K. 1970, ApJ, 160, 81
- [1995] Fukugita, M., Shimasaku, K., & Ichikawa, T. 1995, PASP, 107, 945
- [1996] Fukugita, M., Ichikawa, T., Gunn, J.E., Doi, M., Shimasaku, K., & Schneider, D.P. 1996, AJ, 111, 1748
- [2010] Gallagher, J.S. 2010, ASPC, 423, 3
- [1993] Garcia, A.M. 1993, A&AS, 100, 47
- [2006] Geha, M., Blanton, M.R., Masjedi, M., & West, A.A. 2006, ApJ, 653, 240
- [2003] Grebel, E.K., Gallagher, III J.S., & Harbeck, D. 2003, AJ, 125, 1926
- [1988] Grosbol, P., Banse, K., Guirao, C., Ponz, J.D., & Warmels, R.H. 1988, ESO Messenger, ESO, Garching, 54 , 59
- [2005] Grützbauch, R., Kelm, B., Focardi, P., Trinchieri, G., Rampazzo, R., & Zeilinger, W.W. 2005, AJ, 129, 1832
- [2011] Hartwick, F.D.A. 2011, AJ, 141, 198
- [1986] Haynes, M.P., & Giovanelli, R. 1986, ApJ, 306L, 55
- [2008] Henriques, B.M., Bertone, S., & Thomas, P.A. 2008, MNRAS, 383, 1649
- [1999] Henriksen, M., & Cousineau, S. 1999, ApJ, 511, 595
- [1998] Hill, G.J., Nicklas, H.E., MacQueen, P.J., Tejada, C., Cobos, D., Francisco, J., & Mitsch, W. 1998, SPIE, 3355, 375
- [1986] Horne, K. 1986, PASP, 98, 609
- [2004] Hunter, D.A. & Elmegreen, B.G. 2004, AJ, 128, 2170
- [2001] Ibata, R., Irwin, M., Lewis, G.F., & Stolte, A. 2001, ApJ, 547, L133
- [2001] Ibata, R., Irwin, M., Lewis, G., Ferguson, A.M.N., & Tanvir, N. 2001, Nature, 412, 49
- [2000] Jerjen, H., Binggeli, B., & Freeman, K.C. 2000, AJ, 119, 593
- [1995] Johnston, K.V., Spergel, D.N., & Hernquist, L. 1995, ApJ, 451, 598
- [1999] Karachentseva, V.E., Karachentsev, I.D., & Richter, G.M. 1999, A&AS, 135, 221
- [1999] Karachentsev, I.D., Makarov, D.I., & Huchtmeier, W.K. 1999, A&AS, 139, 97
- [2002] Karachentsev, I.D., Sharina, M.E., Makarov, D.I., et al. 2002, A&A, 389, 812
- [2002] Karachentsev, I.D., Nasonova, O.G., & Courtois, H.M. 2013, MNRAS, 429, 2264
- [2008] Kewley, L. J., & Ellison, S. L., 2008, ApJ 681, 1183
- [1996] Kinney, A.L., Calzetti, D., Bohlin, R.C., McQuade, K., Storchi-Bergmann, T. & Schmitt, H.R., 1996, ApJ, 467, 38
- [1999] Klypin, A., Kravtsov, A.V., Valenzuela, O., & Prada, F. 1999, ApJ, 522, 82
- [2004] Kniazev, A.Y., Grebel, E.K., Pustilnik, S.A., Pramskij, T.F., Kniazeva, T.F., Prada, F., & Harbeck, D. 2004, AJ, 127, 704
- [2009] Kotulla, R., Fritze, U., Weilbacher, P. & Anders, P. 2009, MNRAS, 396, 462
- [1999] Lake, G., & Moore, B. 1999, in Proc. of the IAU Symp. 186: Galaxy Interactions at Low and High Redshift, eds. J.E. Barnes, & D.B. Sanders, 393
- [2012] Lisker, T. 2012, AN, 333, 405
- [2013] Lisker, T., Weinmann, S.M., Janz, J., & Meyer, H.T. 2013, MNRAS, 432, 1162
- [1993] Lorenz, H., Richter, G.M., Capaccioli, M., & Longo, G. 1993, A&A, 277, 321
- [2005] Mahdavi, A., Trentham, N., & Tully, R.B. 2005, AJ, 130, 1502
- [1993] Mamon, G. A. 1993, in: Gravitational Dynamics and the N-body Problem, eds. F. Combes & E. Athanassoula, Obs. de Paris, 188 [arXiv:astro-ph/9308032]
- [2007] Mamon, G. A. 2007, in Proc. of the ESO workshop: Groups of Galaxies in the Nearby Universe, eds. I. Saviane, V. Ivanov, & J. Borissova, ESO Astrophysics Symposia, 203 [arXiv:astro-ph/0607482]
- [1990] Massey, P., Gronwall, C., 1990, ApJ, 358, 344
- [2000] Mayer, L., Governato, F., & Colpi, M. 2000, ASP Conf. Ser., 215, 42
- [1998] Moore, B., Lake, G., & Katz, N. 1998, ApJ, 495, 139
- [2003] Mulchaey, J.S., Davis, D.S., Mushotzky, R.F., & Burstein, D. 2003, ApJS, 145, 39
- [1990] Oke, J.B., 1990, AJ, 99, 1621
- [2004] Osmond, J.P.F. & Ponman, T.J. 2004, MNRAS, 350, 1511
- [2007] Panter, B., Jimenez, R., Heavens, A.F., & Charlot, C. 2007, MNRAS, 378, 1550
- [2002] Parodi B.R., Barazza F.D., Binggeli B., 2002, A&A, 388, 29
- [1996] Patterson, R.J., & Thuan, T.X. 1996, ApJS, 107, 103
- [2002] Popescu, C. C., Hopp, U., & Rosa, M. R., 1999, A&A, 350, 414
- [2002] Ramella, M., Geller, M.J., Pisani, A., & da Costa, L.N. 2002, AJ, 123, 2976
- [1998] Ramsey, L.W., Adams, M.T., Barnes, T.G., Booth, J.A., et al. 1998, SPIE, 3352, 34
- [2003] Rines, K., Geller, M.J., Kurtz, M.J., & Diaferio, A. 2003, AJ, 126, 215
- [1986] Sandage, A. 1986, ApJ, 307, 1
- [2008] Sharina M.E., Karachentsev I.D., Dolphin A.E., et al. 2008, MNRAS, 384, 1544
- [2007] Shetrone, M., Cornell, M.E., Fowler, J.R., et al. 2007, PASP, 119, 556
- [1993] Skillman, E.D., Kennicutt, R.C., 1993 ApJ, 411, 655
- [2010] Smith, B., Bastian, N., Higdon, S.J.U., & Higdon J.H. (eds.): ’Galaxy Wars: Stellar Populations and Star Formation in Interacting Galaxies’, ASP Conference Series Vol. 423, proceedings of a conference held 19-22 July 2009 at East Tennessee State University, Johnson City, Tennessee, USA, San Francisco, Astronomical Society of the Pacific, 2010
- [2002] Smith, J.A., Tucker, D.L., Kent, S., et al. 2002 ApJ, 123, 2121
- [2002] Swaters, R.A., & Balcells, M. 2002, A&A, 390, 863
- [2008] Tago, E., Einasto, J., Saar, E., Tempel, E., Einasto, M., Vennik, J., & Müller, V. 2008, A&A, 479, 927
- [2010] Tanaka, M., Chiba, M., Komiyama, Y., Guhathakurta, P., Kalirai, J.S., & Iye, M. 2010, ApJ, 708, 1168
- [2008] Teerikorpi, P., Chernin, A.D., Karachentsev, I.D., & Valtonen, M.J., 2008, A&A, 483, 383
- [2009] Tolstoy, E. & Hill, V. & Tosi, M. 2009, ARAA, 47, 371
- [1972] Toomre, A., & Toomre, J. 1972, ApJ, 178, 623
- [2001] Trentham, N., Tully, R.B., & Verheijen, M.A.W. 2001, MNRAS, 325,385
- [2009] Trentham, N., Tully, R.B. 2009 MNRAS, 398, 722
- [1982] Tully, R.B. 1982, ApJ, 257, 389
- [1987] Tully, R.B., & Fisher, J.R. 1987, Nearby Galaxies Atlas, (Cambridge Univ. Press 1987)
- [1988] Tully, R.B. 1988, Nearby Galaxies Catalogue, (Cambridge University Press 1988)
- [2009] Tully, R.B., & Trentham, N. 2008 AJ, 135, 1488
- [1994] Vader, J.P., & Chaboyer, B. 1994, AJ, 108, 1209
- [2001] van Zee, L. 2001, AJ, 121, 2003
- [1987] Veilleux, S., & Osterbrock, D. E., 1987, ApJS, 63, 295
- [1984] Vennik, J. 1984, TarTO, 73, 1
- [1996] Vennik, J., Richter, G.M., Thänert, W., & Biering, C. 1996, AN, 317, 289
- [2007] Vennik, J., & Tago, E. 2007, in Groups of Galaxies in the Nearby Universe, ed. I. Saviane, V. Ivanov, & J. Borissova, ESO Astrophysics Symposia, 119
- [2008] Vennik, J., & Hopp, U. 2008, A&A, 481, 79
- [1991] Warmels, R.H. 1991, The ESO-MIDAS System, in Astronomical Data Analysis Software and Systems I , PASP Conf. Series, Vol. 25, p. 115.
- [2013] Wetzel, A.R., Tinker, J.L., Conroy, C., & Bosch, van den F.C. 2013, MNRAS, 439, 2687
- [1997] Weinberg, M.D. 1997, ApJ, 478, 435
- [1999] White, R.A., Bliton, M., Bhavsar, S.P., Bornmann, P., Burns, J.O., Ledlow, M.J., & Loken, C. AJ, 118, 2014
- [2007] Whiting, A.B., Hau, G.K.T., Irwin, M., & Verdugo, M. 2007, AJ, 133, 715
- [2006] Wright, E.L. 2006, PASP, 118, 1711

| Galaxy | R.A. | DEC | set-up | date | Exp.-time | remarks |
| 2000 | 2000 | [sec] | ||||
| UGC 378 | 00:37:59.0 | +48:11:53.0 | g1_2.0 | 2008 08 06 | 2400 | |
| NGC 278-kkh4 | 01:05:49.9 | +45:30:53.6 | g1_2.0 | 2008 09 30 | 2700 | second exposure 2008 10 02 |
| NGC 278-kk6 | 00:37:28.6 | +48:10:25.1 | g1_2.0 | 2008 09 24 | 1200 | only one exposure |
| IC 65-dw1 | 01:00:10.1 | +47:34:01 | g2_1.0 | 2005 11 20 | 3000 | |
| IC 65-dw2 | 01:00:07.7 | +47:56:05 | g2_1.0 | 2007 11 09 | 2400 | |
| -”- | g2_2.0 | 2007 09 14 | 1200 | |||
| IC 65-dw3 | 01:01:16.1 | +47:44:33 | g2_2.0 | 2007 09 13 | 1800 | |
| IC 65-dw4 | 01:01:44.4 | +47:52:06 | g2_2.0 | 2007 09 08 | 1200 | |
| PGC 3574 | 00:59:56.8 | +47:47:10 | g2_1.0 | 2005 11 20 | 1968 | |
| PGC 3684 | 01:01:45.3 | +47:54:08 | g2_1.0 | 2005 01 25 | 3000 | |
| NGC 524SW-16 | 01:25:08.1 | +09:36:27.0 | g2_2.0 | 2008 01 31 | 1200 | |
| NGC 524SW-18 | 01:24:51.7 | +09:06:50.0 | g2_2.0 | 2008 01 14 | 1200 | |
| NGC 691-E | 01:50:51.2 | +21:45:54 | g1_2.0 | 2008 12 31 | 2400 | |
| NGC 697-dw1 | 01:49:52.8 | +22:26:35.8 | g1_2.0 | 2008 10 02 | 2400 | |
| NGC 697-dw2 | 01:48:50.3 | +22:06:50.0 | g1_2.0 | 2008 10 30 | 2400 | |
| NGC 697-dw3 | 01:47:48.3 | +22:08:31.9 | g1_2.0 | 2008 10 07 | 2400 | |
| NGC 697-A | 01:51:49.8 | +22:18:34 | g1_2.0 | 2009 01 22 | 2400 | |
| NGC 697-B | 01:51:43.9 | +22:20:00 | g1_2.0 | 2009 01 24 | 2400 | |
| NGC 697-C | 01:52:22.4 | +22:10:07 | g1_2.0 | 2010 01 06 | 2011 | only one exposure |
| -”- | g1_2.0 | 2010 01 19 | 2400 | |||
| NGC 697-D | 01:50:26.4 | +21:57:05 | g1_2.0 | 2009 01 26 | 2400 | |
| NGC 697-F | 01:51:31.1 | +22:45:40 | g1_2.0 | 2009 12 11 | 2400 | |
| NGC 697-G | 01:50:20.3 | +22:25:53 | g1_2.0 | 2010 02 08 | 2149 | |
| NGC 697-J | 01:48:13.3 | +22:02:30 | g1_2.0 | 2010 01 17 | 2400 | |
| NGC 697-H | 01:51:56.4 | +22:41:42 | g1_2.0 | 2009 12 14 | 2400 | |
| NGC 772-gal1 | 01:58:58.5 | +18:57:46 | g1_2.0 | 2009 12 12 | 2400 | one slit with NGC 772-gal2 |
| NGC 772-gal2 | 01:59:07.0 | +18:57:40 | g1_2.0 | 2009 12 12 | 2400 | one slit with NGC 772-gal1 |
| NGC 972-kdg17 | 02:31:00.4 | +27:57:25.7 | g1_2.0 | 2008 10 06 | 2300 | |
| NGC 5033-15 | 13:14:20.7 | +36:34:11.0 | g2_2.0 | 2008 01 14 | 2400 | |
| NGC 5033-30N | 13:10:57.5 | +36:48:59.0 | g2_2.0 | 2008 02 07 | 2400 | |
| NGC 5033-30S | 13:10:57.5 | +36:48:59.0 | g2_2.0 | 2008 02 07 | 2400 | |
| NGC 5033NE-Adw | 13:17:07.6 | +37:57:34 | g1_2.0 | 2008 12 21 | 2400 | |
| NGC 5033WW-LSB | 13:04:22.5 | +36:29:40 | g1_2.0 | 2009 01 25 | 2400 | |
| NGC 5033S-dw1 | 13:14:23.2 | +35:43:41 | g1_2.0 | 2009 01 29 | 2400 | |
| NGC 5033-23 | 13:11:06.5 | +37:10:40 | g1_2.0 | 2009 02 01 | 2400 | |
| NGC 5112-MAPS | 13:23:05.9 | +39:09:25 | g1_2.0 | 2009 02 02 | 2400 | |
| NGC 5112-dw1 | 13:22:13.0 | +38:44:55 | g1_2.0 | 2009 02 27 | 2400 | |
| NGC 5112-dw2 | 13:21:58.4 | +38:50:54 | g1_2.0 | 2009 02 28 | 2400 | |
| NGC 6278-kkr31 | 16:58:33.5 | +23:12:20 | g1_2.0 | 2009 02 02 | 2200 | |
| NGC 6278-A | 17:01:31.4 | +22:44:41 | g1_2.0 | 2009 03 02 | 2400 | |
| NGC 6278-5 | 17:00:33.2 | +22:51:58 | g1_2.0 | 2009 03 04 | 2450 | |
| NGC 6278-C | 17:00:39.4 | +23:03:08 | g1_2.0 | 2009 03 05 | 2400 | |
| NGC 6962-B10 | 20:46:56.8 | +00:12:37 | g1_2.0 | 2010 07 20 | 2400 | |
| NGC 6962-Ec1 | 20:50:18.4 | +00:45:20.0 | g1_2.0 | 2010 06 06 | 2400 | |
| NGC 6962-L02 | 20:47:01.3 | +00:26:56 | g1_2.0 | 2010 07 13 | 1896 | |
| NGC 6962-L08 | 20:48:04.9 | +00:35:13.0 | g1_2.0 | 2010 05 20 | 2400 | |
| NGC 6962-L12 | 20:47:22.3 | +00:21:42.0 | g1_2.0 | 2008 11 04 | 2400 | |
| NGC 6962-N02 | 20:48:23.7 | +00:23:00.0 | g1_2.0 | 2008 06 05 | 2400 | |
| NGC 6962-N06 | 20:48:29.1 | +00:05:41 | g1_2.0 | 2010 06 11 | 2400 | |
| NGC 6962-N16 | 20:46:32.1 | +00:33:18.0 | g1_2.0 | 2008 06 11 | 2400 | |
| NGC 6962-N19 | 20:51:53.6 | +00:20:13 | g1_2.0 | 2010 06 16 | 2280 | |
| NGC 6962-N20 | 20:46:49.9 | +00:39:44.0 | g1_2.0 | 2008 10 27 | 1801 | |
| NGC 6962-SE14 | 20:50:55.8 | -00:11:07.3 | g1_2.0 | 2010 06 14 | 2400 |
| Nr | Galaxy | ID-SDSS | v⊙ | spec | morph | Group | remarks | |
| [km s-1] | ||||||||
| (1) | (2) | (3) | (4) | (5) | (6) | (7) | (8) | (9) |
| 1 | UGC 378 | 4493 | 22 | HII | Sc | bkg | Z/Z⊙ 0.3 ? | |
| 2 | NGC 278-kkh4 | J010549.63+453057.6 | 3339 | 48 | HII | Irr | bkg | very low SB |
| 3 | NGC 278-kk6 | 4715 | 47 | HII | bkg | with UGC 378? | ||
| 4 | IC 65-dw1 | 568 | 11 | HII | dIrr | N278 | A1000+47341) | |
| 5 | IC 65-dw2 | 2736 | 14 | HII | dIrr | IC65 | A1000+47561) | |
| 6 | IC 65-dw3 | 2756 | 16 | HII | dIrr | IC65 | A0101+47441) | |
| 7 | IC 65-dw4 | 565 | 17 | HII | dIrr | N278 | A0101+47521) | |
| 8 | PGC 3574 | 14090 | 100 | abs | S0 | bkg | ||
| 9 | PGC 3684 | 5718 | 18 | HII/abs | E: | bkg | ||
| 10 | NGC 524SW-16 | J012508.08+093628.2 | 4618 | 100 | abs | S… | bkg | poor signal |
| 11 | NGC 524SW-18 | J012451.77+090649.3 | - | 300 | no HII | S… | too faint | |
| 12 | NGC 691-E | J015050.97+214553.2 | 20959 | 30 | HII/abs | S0/a | bkg | a) |
| 13 | NGC 697-dw1 | J014952.94+222634.4 | 9834 | 44 | HII | Scd: | bkg | b) |
| 14 | NGC 697-dw2 | J014850.16+220650.9 | 2997 | 30 | HII | dSph: | N697 | bright knot in SE |
| 15 | NGC 697-dw3 | J014748.40+220831.9 | 2940 | 28 | HII | S… | N697 | |
| 16 | NGC 697-A | J015150.07+221831.3 | 2901 | 50 | HII | Scd | N697 | bright knot in NW |
| 17 | NGC 697-B | J015144.23+221957.3 | 3314 | 50 | abs | S0-a | N697 | post-STB? |
| 18 | NGC 697-C | J015222.40+221007.0 | 2647 | 45 | HII | Irr | N697 | 2010 01 06 |
| 2664 | 45 | HII | N697 | 2010 01 19 | ||||
| 19 | NGC 697-C Back | J015223.01+221010.2 | 68598 | 46 | HII | S… | bkg | 2010 01 06 |
| 68587 | 166 | HII | bkg | 2010 01 19 | ||||
| 20 | NGC 697-C Back2 | 252909 | HII | bkg | 2010 01 19 | |||
| 21 | NGC 697-D | J015027.14+215702.5 | 26945 | 30 | HII | S0-a | bkg | |
| 22 | NGC 697-F | J015131.10+224540.2 | 14032 | 56 | HII | S… | bkg | |
| 23 | NGC 697-G | J015020.28+222553.5 | 9621 | 83 | HII | S-Irr | bkg | b), bright eccentric patch |
| 24 | NGC 697-J | J014813.29+220233.6 | 37520 | 114 | abs | E-S0 | bkg | |
| 25 | NGC 697-H | J015156.41+224142.1 | 9913 | 4 | HII | S-Irr | bkg | b) |
| 26 | NGC 772-gal1 | J015858.60+185740.2 | 19905 | 230 | abs | E | bkg | a), LEDA 212884 |
| 27 | NGC 772-gal2 | J015907.21+185736.4 | 19204 | 140 | abs | E-S0 | bkg | a) |
| 28 | NGC 972-kdg17 | 1464 | 26 | HII | N972 | |||
| 29 | NGC 5033-15 | J131420.58+363407.0 | 1175 | 20 | HII | dIrr | N5033 | DR9: cz=1737 |
| 30 | NGC 5033-30N | J131058.75+364943.8 | 1365 | 300 | abs | dIrr | N5033 | |
| 31 | NGC 5033-30S | J131058.38+364811.3 | 81716 | 150 | HII | S-Irr | bkg | bright knot in SE |
| 32 | NGC 5033NE-Adw | J131704.86+375708.8 | 366 | 24 | HII | S0-a | field? | PGC 046257 |
| 33 | NGC 5033WW-LSB | J130419.75+362925.9 | - | 300 | no HII | Scd | too faint | |
| 34 | NGC 5033S-dw1 | J131422.85+354340.7 | 867 | 25 | HII | Irr | N5033 | 2nd bright knot in NE |
| 35 | NGC 5033-23 | J131106.51+371041.1 | - | 300 | no HII | Irr | too faint, 3 more knots | |
| 36 | NGC 5112-MAPS | J132303.79+390939.3 | 2391 | 25 | HII | Irr | bkg | many knots |
| 37 | NGC 5112-dw1 | J132212.86+384456.1 | - | 300 | no HII | S… | too faint | |
| 38 | NGC 5112-dw2 | J132157.87+385052.9 | 790 | 19 | HII | S-Irr | N5033 | |
| 39 | NGC 6278-kkr31 | J165833.31+231223.0 | - | 300 | no HII | Irr | too faint and knotty | |
| 40 | NGC 6278-A | J170131.42+224441.4 | 10611 | 32 | HII | Sbc | bkg | |
| 41 | NGC 6278-5 | J170033.18+225157.5 | - | 300 | no HII | S… | cz=2725(NED) | |
| 42 | NGC 6278-C | J170039.43+230308.4 | 16983 | 20 | HII/AGN | Sbc | bkg | |
| 43 | NGC 6278-C246 | 32359 | 19 | HII/AGN | bkg | |||
| Table 4, continued | ||||||||
|---|---|---|---|---|---|---|---|---|
| (1) | (2) | (3) | (4) | (5) | (6) | (7) | (8) | (9) |
| 44 | NGC 6962-B10 | J204656.97+001238.4 | 7958 | 50 | HII | Sb-c | bkg | 2nd bright knot in SW |
| 45 | NGC 6962-Ec1 | J205018.39+004519.6 | 15526 | 68 | HII | S… | bkg | |
| 46 | NGC 6962-L02 | J204701.32+002656.2 | - | 60 | no HII | S0-a | too faint | |
| 47 | NGC 6962-L08 | J204804.85+003513.1 | 4616 | 50 | HII | Scd | N6962 | |
| 48 | NGC 6962-L12 | J204722.3+002142 | 4456 | 300 | abs | S… | N6962 | no object in SDSS! |
| 49 | NGC 6962-N02 | J204823.71+002300.5 | 3751 | 25 | HII | Sbc: | N6962 | 2nd bright knot in NW |
| 50 | NGC 6962-N06 | J204829.07+000540.7 | 6638 | 50 | HII | S-Irr | bkg | |
| 51 | NGC 6962-N16 | J204632.08+003317.6 | 4156 | 6 | HII | S0-a | N6962 | asym., several knots in NE |
| 52 | NGC 6962-N19 | J204535.66+004332.0 | 38723 | 200 | HII | S… | bkg | |
| 53 | NGC 6962-N20 | J204649.90+003944.4 | 4358 | 24 | HII | S-Im | N6962 | DR9: z=0.01368 (STB) |
| 54 | NGC 6962SE-14a | J205055.83-001107.2 | 60047 | 30 | HII/abs | Sab | bkg | |
| 55 | NGC 6962Se-14b | J205056.07-001108.5 | 57214 | 61 | HII | S… | bkg |
1) galaxy name in Vennik & Hopp (2008)
a) NGC691-E, NGC772-gal1, and NGC772-gal2 seem to belong to a common background structure
b) NGC697-dw1, NGC697-G, and NGC697-H indicate - together with 3 NED galaxies - a background group at 9794 km/s, see text for details.
| Nr | ||||||||||
| [Mpc] | [mag] | [mag] | [mag] | [mag] | [mag arcsec-2] | [arcsec(kpc)] | ||||
| (1) | (2) | (3) | (4) | (5) | (6) | (7) | (8) | (9) | (10) | (11) |
| 2 | 49.9 | 18.48.15 | -15.01 | 0.050.23 | 0.15.34 | 24.00 | 25.32 | 23.72 | 7.4(1.7) | 4.9(1.2) |
| 12 | 312.7 | 17.490.12 | -19.98 | 0.490.18 | 0.260.21 | 21.88 | 23.25 | 21.85 | 5.5(7.3) | 3.6(4.8) |
| 13 | 143.6 | 17.270.07 | -18.51 | 0.350.10 | 0.160.12 | 22.75 | 23.59 | 21.81 | 6.7(4.3) | 3.5(2.3) |
| 14 | 44.0 | 17.250.09 | -15.97 | 0.440.11 | 0.260.11 | 22.49 | 24.46 | 22.92 | 8.8(1.8) | 6.1(1.3) |
| 15 | 43.2 | 16.720.02 | -16.46 | 0.400.02 | 0.130.02 | 22.97 | 24.81 | 23.38 | 13.8(2.8) | 9.3(1.9) |
| 16 | 42.6 | 18.450.08 | -14.70 | 0.450.09 | 0.140.11 | 22.98 | 24.19 | 22.67 | 4.6(0.9) | 3.1(0.6) |
| 17 | 48.6 | 17.140.08 | -16.30 | 0.530.09 | 0.290.10 | 21.21 | 23.39 | 22.31 | 5.0(1.1) | 4.0(0.9) |
| 18 | 39.0 | 18.210.07 | -14.74 | 0.370.10 | 0.180.10 | 22.92 | 23.92 | 4.6(0.8) | ||
| 21E1 | 407.3 | 18.150.05 | -19.90 | 0.300.07 | 0.360.07 | 21.71 | 22.91 | 21.29 | 3.2(5.3) | 2.2(3.6) |
| 21W2 | 407.3 | 17.590.09 | -20.46 | 0.460.13 | 0.240.12 | 22.40 | 23.93 | 22.39 | 6.7(11.2) | 4.7(7.9) |
| 22 | 206.4 | 17.300.04 | -19.28 | 0.100.06 | 0.250.11 | 21.07 | 23.42 | 22.16 | 4.9(4.4) | 4.1(3.7) |
| 22SE3 | (206.4) | 19.330.07 | (-17.2) | -0.26: | 0.37: | 22.39 | 23.72 | 22.08 | 2.2(2.0) | 1.5(1.3) |
| 22SW4 | (206.4) | 20.100.07 | (-16.5) | 0.560.10 | 0.490.12 | 22.97 | 23.82 | 22.48 | 1.7(1.6) | 1.3(1.2) |
| 23 | 140.4 | 18.430.07 | -17.31 | 0.300.09 | 0.200.09 | 22.60 | 23.34 | 21.92 | 3.3(2.1) | 2.2(1.4) |
| 24 | 580.4 | 17.420.05 | -21.40 | 0.500.07 | 0.280.06 | 20.87 | 23.02 | 21.22 | 4.9(11.0) | 3.0(6.6) |
| 25 | 144.7 | 18.200.05 | -17.60 | 0.210.06 | 0.160.09 | 22.61 | 23.74 | 22.23 | 4.4(2.9) | 2.9(1.9) |
| 26 | 296.1 | 15.390.08 | -21.97 | 0.810.11 | 0.440.09 | 18.16 | 22.35 | 5.7(7.2) | ||
| 27 | 285.2 | 16.200.14 | -21.08 | 0.740.18 | 0.370.17 | 18.86 | 23.04 | 5.5(6.7) | ||
| 29 | 17.3 | 16.820.01 | -14.37 | 0.290.01 | 0.140.01 | 23.24 | 24.52 | 23.02 | 11.2(0.9) | 7.7(0.6) |
| 30 | 20.0 | 17.770.07 | -13.71 | 0.360.10 | 0.320.12 | 23.96 | 25.79 | 24.00 | 11.8(1.1) | 7.2(0.7) |
| 31 | 1379.3 | 18.610.16 | -22.09 | 0.410.20 | -0.060.23 | 22.85 | 24.35 | 22.77 | 7.0(29.0) | 4.7(19.4) |
| 32 | 5.9 | 15.170.01 | -13.68 | 0.350.01 | 0.170.01 | 21.45 | 22.95 | 21.87 | 10.3(0.3) | 7.8(0.2) |
| 34 | 12.9 | 18.620.08 | -11.93 | 0.430.10 | 0.020.11 | 22.40 | 24.79 | 23.47 | 5.2(0.3) | 4.4(0.3) |
| 36 | 34.7 | 17.170.02 | -15.53 | 0.130.03 | 0.04 | 22.74 | 24.04 | 22.40 | 7.7(1.3) | 4.6(0.8) |
| 38 | 12.0 | 18.610.08 | -11.78 | 0.320.13 | 0.030.28 | 23.15 | 24.90 | 23.39 | 6.2(0.4) | 4.0(0.2) |
| 40 | 155.6 | 18.620.10 | -17.34 | 0.350.13 | 0.170.20 | 21.29 | 23.09 | 21.24 | 2.4(1.7) | 1.4(1.0) |
| 42 | 251.8 | 18.360.03 | -18.64 | 0.260.04 | 0.240.03 | 21.04 | 22.10 | 20.25 | 2.0(2.2) | 1.1(1.2) |
| 44 | 116.7 | 19.100.05 | -16.24 | 0.170.07 | -0.030.08 | 22.54 | 23.49 | 20.98 | 2.6(1.4) | 1.2(0.6) |
| 45 | 229.8 | 19.400.04 | -17.41 | 0.180.08 | 0.040.20 | 23.09 | 23.94 | 21.72 | 2.9(2.9) | 1.4(1.4) |
| 47 | 68.0 | 18.450.02 | -15.71 | 0.440.08 | 0.270.16 | 23.15 | 24.45 | 22.98 | 4.8(1.5) | 3.1(1.0) |
| 48 | 65.7 | 17.810.07 | -16.28 | 0.440.10 | 0.270.12 | 22.55 | 24.19 | 22.41 | 5.6(1.7) | 3.5(1.1) |
| 49 | 55.6 | 15.910.11 | -17.82 | 0.490.15 | 0.260.15 | 21.26 | 22.88 | 21.12 | 7.3(1.9) | 4.5(1.2) |
| 50 | 97.3 | 18.100.11 | -16.84 | 0.480.15 | 0.310.17 | 22.69 | 24.21 | 22.95 | 5.0(2.3) | 3.4(1.5) |
| 51 | 61.4 | 15.580.01 | -18.36 | 0.540.01 | 0.290.01 | 20.13 | 21.89 | 21.92 | 5.1(1.5) | 5.1(1.5) |
| 52 | 601.4 | 19.040.05 | -19.85 | 0.380.08 | 0.290.10 | 22.81 | 24.21 | 22.22 | 4.5(10.3) | 2.2(5.0) |
| 53 | 64.3 | 18.060.08 | -15.98 | 0.420.13 | 0.160.15 | 22.69 | 23.86 | 21.67 | 4.7(1.4) | 2.3(0.7) |
| 54 | 974.2 | 19.070.09 | -20.87 | 0.500.10 | 0.290.09 | 21.59 | 22.87 | 20.95 | 2.6(8.7) | 1.3(4.4) |
| 55 | 923.1 | 20.420.03 | -19.40 | 0.180.04 | 0.290.04 | 21.09 | 22.26 | 20.29 | 1.0(3.1) | 0.5(1.7) |
1 Eastern part (knot) of the NGC 697-D, J015027.14+215702.5;
2 Western part (knot) of the NGC 697-D, J015026.32+215706.0
3 LSB object to the SE of NGC 697-F, J015131.80+224535.1 (redshift uncertain);
4 LSB object to the SW of NGC 697-F, J015130.89+224534.0 (redshift uncertain)
| sample | |||||||||
|---|---|---|---|---|---|---|---|---|---|
| [Mpc] | [mag] | [mag] | [mag] | [mag arcsec-2] | [kpc] | [kpc] | |||
| (1) | (2) | (3) | (4) | (5) | (6) | (7) | (8) | (9) | (10) |
| group-DGs | 18 | 3821 | -15.31.9 | 0.42.07 | 0.19.09 | 22.61.60 | 23.39.98 | 0.79.50 | 1.16.69 |
| (medians) | 42 | -15.3 | 0.43 | 0.17 | 22.55 | 23.54 | 0.7 | 1.2 | |
| field-LTGs | 23 | 498964 | -18.92.1 | 0.35.20 | 0.21.13 | 21.81.89 | 23.14.92 | 3.74.2 | 5.95.9 |
| (medians) | 208 | -19.3 | 0.35 | 0.24 | 21.85 | 23.18 | 1.9 | 3.9 | |
| sample | ||||||||
|---|---|---|---|---|---|---|---|---|
| [Mpc] | [mag] | [mag] | [mag arcsec-2] | [kpc] | [kpc] | |||
| group DGs | 18 | 3821 | -14.61.7 | 0.94.15 | 22.00.64 | 22.761.04 | 0.79.50 | 1.16.69 |
| (medians) | 42 | -14.9 | 0.98 | 22.16 | 23.00 | 0.7 | 1.2 | |
| field LTGs | 23 | 498964 | -18.72.1 | 0.92.32 | 21.14.89 | 22.601.03 | 3.74.2 | 5.95.9 |
| (medians) | 208 | -19.3 | 0.89 | 21.15 | 22.56 | 1.9 | 3.9 | |
| LV DGs | 98 | 5.82.3 | -14.21.6 | 0.91.23 | 21.531.10 | 22.681.07 | 0.45.26 | 0.76.43 |
| (medians) | 5.4 | -14.2 | 0.90 | 21.56 | 22.67 | 0.4 | 0.7 | |
| WHISP LTGs | 173 | 12.19.0 | -16.21.5 | 1.02.57 | 21.391.12 | 22.591.15 | 1.651.16 | 2.111.53 |
| (medians) | 9.0 | -16.4 | 0.98 | 21.49 | 22.79 | 1.4 | 1.7 | |