Confirmation of a cluster of galaxies hidden behind the Galactic bulge using the VVV Survey
Abstract
Context. and X-ray observations detected a new cluster of galaxies, Suzaku J17593450, at a redshift z . It is located behind the Milky Way, and the high Galactic dust extinction renders it nearly invisible at optical wavelengths.
Aims. We attempt here to confirm the galaxy cluster with near-infrared imaging observations, and to characterize its central member galaxies.
Methods. Images from the VVV survey were used to detect candidate member galaxies of Suzaku J17593450 within the central region of the cluster, up to 350 from the X-ray peak emission. Color-magnitude and color-color diagrams and morphology criteria allowed us to select the galaxies among the numerous foreground sources.
Results. Fifteen candidate cluster members were found very close to a modeled red-sequence at the redshift of the cluster. Five members are extremely bright, and one is possibly a cD galaxy. The asymmetry in the spatial distribution of the galaxies respect to the X-ray peak emission is an indicator of that this cluster is still suffering a virialization process.
Conclusions. Our investigation of Suzaku J17593450 demonstrates the potential of the VVV Survey to study the hidden population of galaxies in the Zone of Avoidance.
Key Words.:
Surveys - Galaxy: Bulge- galaxies: clusters: individual1 Introduction
Clusters of galaxies are the largest gravitationally bound systems in the Universe. Their number density and clustering strongly depend on cosmological parameters providing potential means to constrain the underlying cosmological model (Bahcall et al. 2003; Gladders et al. 2007; Rozo et al. 2010). Clusters also harbour a large fraction of all galaxies and provide an outstanding environment that promotes their chemical evolution and morphological transitions. Consequently, the detection of new galaxy clusters enhances the possibility to unravel important clues about structure, galaxy formation and evolution.
The thermal X-ray emission from the intracluster medium is a reliable tracer of galaxy clusters (Gursky et al. 1972). The detection of galaxy clusters using X-ray emission from hot gas is a popular technique (Romer et al. 2001; Pierre et al. 2006; Finoguenov et al. 2007). Mori et al. (2013) used this method to identify a rich galaxy cluster, Suzaku J17593450, behind the Milky Way bulge from and observations. The spatial extent of the X-ray emission with a nearly circular shape and a radius of arcmin, and a bolometric X-ray luminosity of ()=4.31044 erg s-1 suggests that Suzaku J17593450 is a new cluster of galaxies, at redshift z . The peak of the surface brightness is located at = or =, and the total mass estimate was 2.21014 with an estimated core radius of arcmin. A precovery observation is available from the ROSAT Bright Source Catalogue (Voges et al. 1999).
Previous optical, near-infrared (NIR), X-ray and H1 radio surveys have detected voids, galaxy clusters and superclusters at low Galactic latitude (Woudt et al. 2004; Kraan-Korteweg & Lahav 2000). Recently, a new NIR ESO Public Survey called VISTA Variables in Vía Láctea (VVV; Minniti et al. 2010; Saito et al. 2012) became available. Although the main scientific goals of VVV are to study the galaxy structure (Gonzalez et al. 2011, 2012), the hidden stellar clusters (Minniti et al. 2011; Borissova et al. 2011), and the nearby stars (Beamín et al. 2013; Ivanov et al. 2014), its exquisite depth and angular resolution make it an excellent tool to find and study extragalactic objects in the Zone of Avoidance. For example, Amores et al. (2012) identified 204 new galaxy candidates from the VVV photometry of 1.636 square degrees near the Galactic plane, increasing by more than an order of magnitude the surface density of known galaxies behind the Milky Way.
In this work, we report a NIR VVV identification of member galaxies in the new Suzaku J17593450 galaxy cluster. Color-magnitude and color-color diagrams of the sources in the cluster field were used to select candidate cluster members. We also identified the red-sequence formed by cluster ellipticals and S0 galaxies. The presence of such red-sequence in the color-magnitude diagram is a clear sign of the existence of structure due to early-type cluster galaxy members occupying a well defined region in the color space (Visvanathan & Sandage 1977). Therefore, the red-sequence has been used as a galaxy clusters detection method (Gladders & Yee 2000) whose slope is related with the cluster redshift (Gladders et al. 1998; Lopez-Cruz, Barkhouse & Yee 2004; Stott et al. 2009).
The layout of the paper is as follow: The observational data are described in section 2. In section 3 the results of the analysed data are shown. The discussion and conclusions are presented in sections 4 and 5, respectively. Throughout the paper, we use the following cosmological parameters: =, =0.315, and =0.685 (Planck Collaboration et al. 2013).
2 Observational Data
2.1 The VVV Survey
VVV is a new Galactic NIR ESO public survey with the 4.1-m ESO VISTA (Visual and Infrared Survey Telescope for Astronomy; Emerson et al. 2004, 2006; Emerson & Sutherland 2010) telescope, located at Cerro Paranal in Chile. It is equipped with a wide field NIR camera VIRCAM (VISTA InfraRed CAMera; Dalton et al. 2006). The instrument has 1.65 field of view, and it is sensitive over =0.9-2.4 m wavelength range. VIRCAM has 16 Raytheon VIRGO 20482048 HgCdTe science detectors, with a mean pixel scale of 0.34 arcsec px-1. Each individual detector covers 694694 arcsec2 on the sky and offset exposures are taken in order to obtain contiguous coverage.
The VVV footprint covers a total of 520 square degrees on the sky, nearly equally split between the Milky Way bulge and the inner Southern disk. The survey has two components: (i) bands, and (ii) up to 80 multi-epoch observations spread over approximately 7-8 years, for variability and proper motion studies. More details can be found in Minniti et al. (2010) and Saito et al. (2012). The observations were processed within the VISTA Data Flow System (VDFS) pipeline at the Cambridge Astronomical Survey Unit (CASU; Lewis, Irwin & Bunclark 2010).
For our analysis the bands were omitted due to the larger extinction at these bands. The characteristics of the single epoch images in J, H and filters used in this work are summarized in Table 1. Finally, for the band, we have built a deep image of the field combining 30 different epochs. This last was possible since multi-epoch observations were obtained, only for the band, for the variability goal of the VVV survey.
| Filter | Exp.Time | NDIT | Jitters | Seeing |
|---|---|---|---|---|
| sec | number | number | arcsec | |
| J | 6 | 2 | 2 | 0.9 |
| H | 4 | 1 | 2 | 0.8 |
| 4 | 1 | 2 | 0.8 |
2.2 Source Catalog
It is well known that galactic morphology is correlated with the local density of galaxies (Dressler 1980) . Therefore, in galaxy clusters, there is also a correlation between morphology and the projected distance from the cluster center. In this sense Whitmore & Gilmore (1991) found that most of the variation occurs within 0.5 Mpc of the cluster center and that the effect is strongest in clusters with dominant galaxies, with the percentage of ellipticals rising from 18% at 600 kpc from the cluster center to 65% at distances of 100 kpc. Accordantly, Treu et al. (2003) fount that only within the central 200 kpc the E+S0 component of galaxy clusters become the dominant component.
Related with the identification of the red sequence, in order to reduce the relative contamination of field galaxies, Gladders et al. (1998) used only the inner 0.5 projected radius of the cluster centers to derived the slope of the red sequence for a sample of 50 galaxy clusters, spanning a redshift range . Likewise, Stott et al. (2009) consider galaxies within 0.6 Mpc radius of the cluster center limiting the contamination from field galaxies for the study of the evolution of the red sequence slope.
In order to minimize the contamination of field sources and to identified red-sequence elliptical galaxies, in this work we concentrated on the very central region around the X-ray surface brightness peak of Suzaku J17593450, which falls on VVV tile d261. We restricted our analysis to the inner of the cluster center that correspond to 1.5 core radius according to the model adopted for Mori et al. (2013) to fit the X-ray profile of the surface brightness in the keV band.
Although CASU generates photometric catalogues for all VVV data, we preferred to create a new one, using SExtractor (Bertin & Arnouts 1996), because it is better suited to treat extended sources. We run SExtractor in double-image mode, with the Ks deep image as a reference because of its better quality and lower susceptibility to extinction. An object was considered detected if the flux exceeded at least twice the local background noise level, and spanned over at least ten connected pixels on the VVV images. The main entries in our final photometric catalog are:
i) magnitudes in three pixels radius apertures. This is recommended to represent the flux for all the objects in the field of the VIRCAM and to calculate colors. The aperture correction was applied to these magnitudes considering the apcor111http://casu.ast.cam.ac.uk/surveys-projects/vista/technical/catalogue-generation parameter available in the header of the fits images. This correction, useful for point sources, also work well as a first order seeing correction for faint galaxies.
ii) total magnitudes. For these we used the MAGAUTO from SExtractor which is based by Kron’s algorithm (Kron 1980).
iii) star-galaxy separation parameters: CLASSSTAR and half-light radius parameter, .
2MASS-based CASU-estimated zero points were used to flux calibrate the images. For the extinction correction we used the high resolution extinction map of the Milky Way from Gonzalez et al. (2012). This reddening map has a resolution of 2 arcmin and it is available via a web based tool BEAM (Bulge Extinction and Metallicity) calculator222http://mill.astro.puc.cl/BEAM/calculator.php. This tool provides a lower limit for the mean extinction, and the E(J-) for a given set of coordinates and radius of the region. Finally, we adopted the Nishiyama et al. (2009) extinction law obtaining the mean values of , and . For this analysis we used only objects with =11-15.5 mag to avoid saturated or too faint stars and blended objects.
Our final catalog contains 1308 sources in the central region of the X-ray emission. The photometric calibration was cross-checked comparing the magnitudes of the point sources with those of the matching CASU sources. The average precision of our magnitudes respect to the CASU ones is in the three bands.
3 Results
3.1 Star-Galaxy Separation
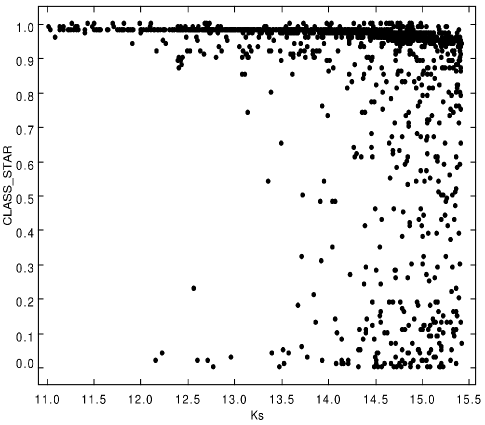
Our star-galaxy classification was based on the SExtractor’s stellarity index CLASSSTAR since the stars lie in a sequence near CLASSSTAR, and galaxies near CLASSSTAR. The two sequences merge for fainter sources, and Bertin & Arnouts (1996) showed that the stellarity index is strongly seeing dependent in this regime. In Fig. 1 we show the relation between the CLASSSTAR parameter and the total magnitude for our dataset. Taking into account the presence of the two sequences, we removed star-like sources from our catalog adopting a conservative limit of CLASSSTAR0.5.
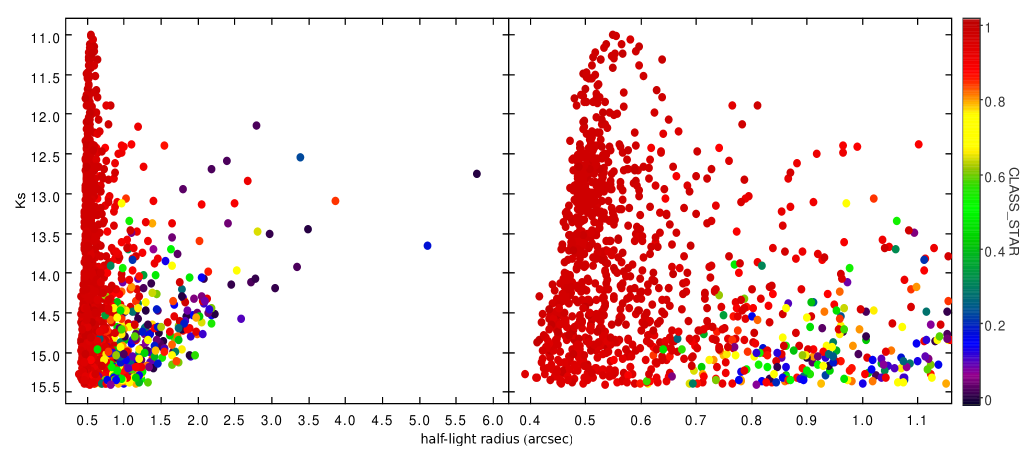
The size versus magnitude diagram is another useful tool in order to perform star-galaxy separation. For this purpose we used the half-light radius parameter, . that measures the radius that encloses 50 % of the object’s total flux. For objects larger than the seeing, is independent of magnitude, placing the extended objects in a well-separated region of the diagram. The left panel of Fig. 2 shows the half-light radius versus total magnitude for the whole sample of sources detected in the central region around the X-ray peak emission. The points are color-codded according to the stellarity parameter CLASSSTAR (the bar on the right) to underline the consistency of the two methods: the majority of the objects with CLASSSTAR1 approximately populate the stellar locus at 0.7 arcsec (which corresponds to 2 pixel radius) while that sources with CLASSSTAR0.5 tend to have larger as can be observed in the right panel of Fig. 2.
Combining the two methods, we define as galaxy candidates those objects with CLASSSTAR0.5 and 0.7 arcsec, obtaining a sample of 187 galaxy-like sources. Many of these objects could be unresolved double or multiple stars, because of the extreme crowding in the Milky Way bulge. So, in the next section, colors are used to improve the galaxy candidate selection method mainly for those galaxies belonging to galaxy clusters.
3.2 Red-Sequence Galaxies
Galaxy clusters contain well-defined, highly regular population of elliptical and lenticular galaxies, that form a structure in their color-magnitude diagrams, known as red-sequence (Gladders & Yee 2000). This alternative approach to identify cluster of galaxies has been proven to be highly successful by numerous authors (Gladders & Yee 2000; Lopez-Cruz, Barkhouse & Yee 2004; Söchting et al. 2006) and we used it for a suitable identification of cluster members.
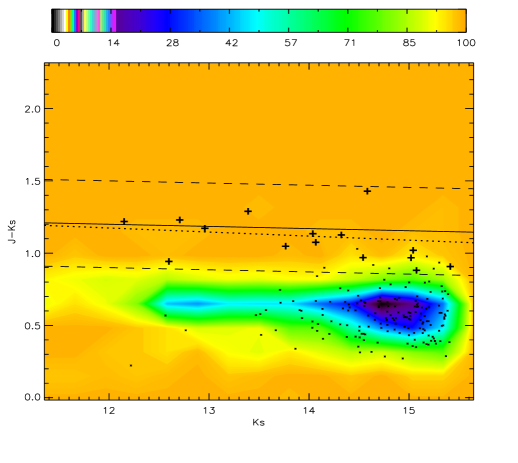
To further strengthen the identification of the galaxy cluster member candidates we used a color selection criteria based on a red-sequence model derived from Bruzual & Charlot (2003). The adopted model uses the Padova 94 (Fagotto et al. 1994a, b) evolutionary tracks and the Chabrier (2003) initial mass function with a passively evolving, instantaneus-burst stellar population with a redshift formation of . The obtained mean red-sequence model is shown in Fig. 3 (black solid line) where the versus color-magnitude diagram of our field is shown. It was computed averaging the models for different metallicities at the redshift of the galaxy cluster, .
Based on the aforementioned, we defined as cluster member those galaxies within (dashed lines in Fig. 3) from the adopted red-sequence model in the color-magnitude diagram. It is important to emphasize that color gradients could vary from one galaxy to another, so to obtain unbiased colors of the galaxy candidates we used fixed aperture magnitudes for all filters. This color cut yielded 22 final galaxy candidates.
The density map in the color-magnitude diagram of Fig. 3 represents the whole sample of objects in the central region of the X-ray peak emission. On the other hand the points in the figure indicate those source satisfying the CLASSSTAR0.5 and 0.7 arcsec criteria. From this figure is possible to observe two well defined region in the color-magnitude diagram: one horizontal sequence at 1.0 (shown by the color density map) corresponding to the stellar sequence of galactic stars, probably with types later than G5 and earlier than K5 (Finlator et al. 2000), and the other one corresponding to the objects defined as galaxy candidates located mainly in the region close to the modeled red sequence (cross symbols). The candidate galaxies in the region of the red-sequence could have an appearance corresponding to early type objects such as elliptical and lenticular galaxies.
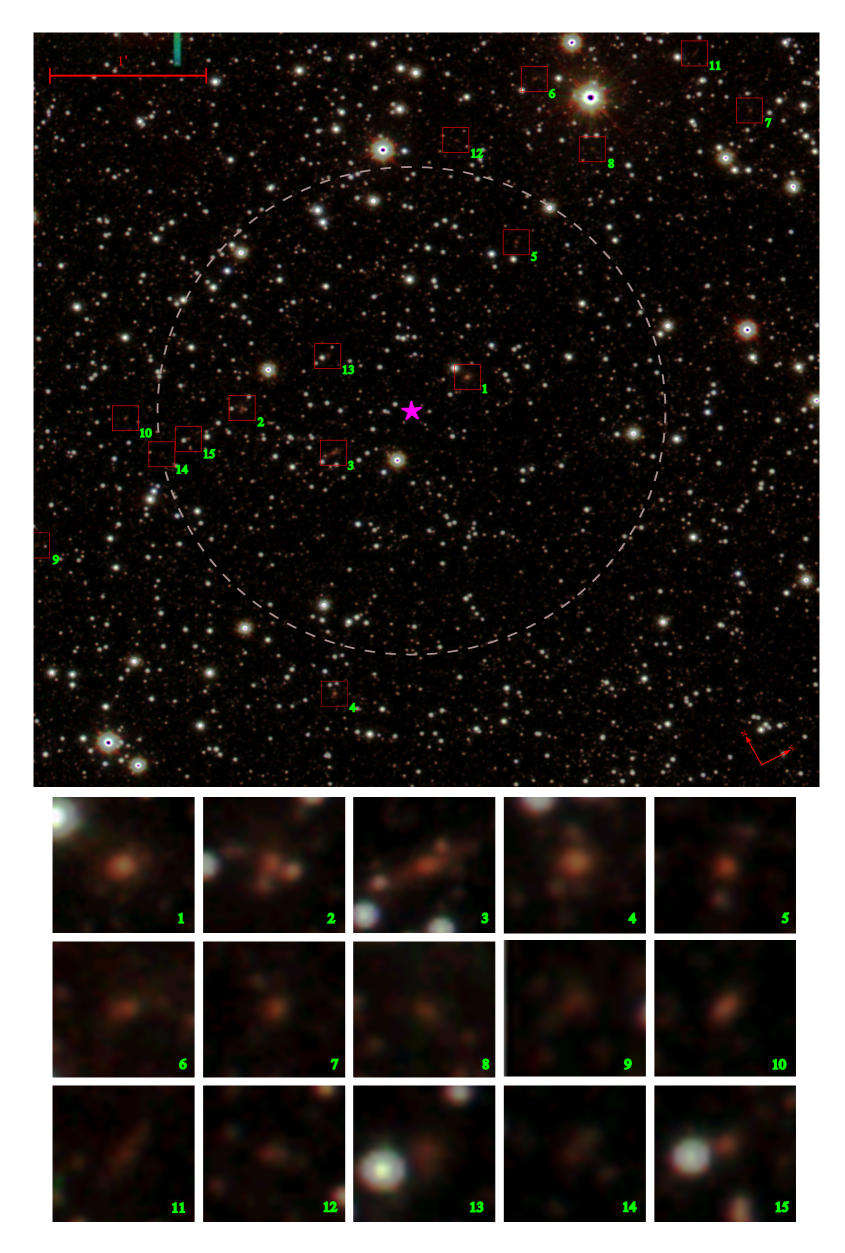
Next, we inspected visually these galaxy candidates on a false-color multiband image (built from J, H, Ks frames) using Aladin (Bonnarel et al. 2000), to identify extended sources with the typical galactic features: color, sizes and ellipticity. We verified the galactic features of 15 candidates whereas 7 remained unclassified, typically because they were too faint and an objective classification is not possible. Moreover, from these 15 objects we classified them in two categories: Type I sources as those with clear galaxy features resulting 12 candidate galaxies in this category; and Type II the remaining sources with not completely clear features expected for galaxies. The visually confirmed galaxies belonging to the red-sequence can be seen in Fig. 3 (cross symbols).
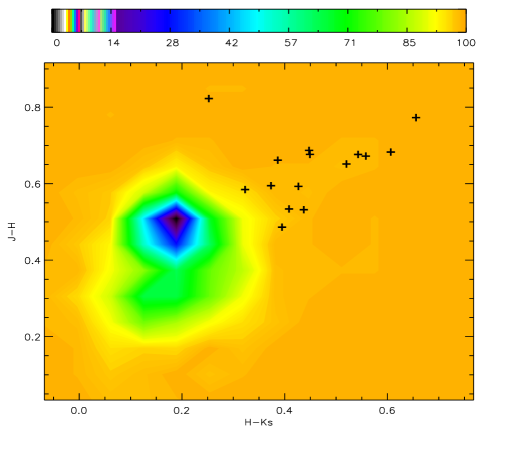
The cluster member galaxy candidates are, indeed, red in all colors, as can be seen from the color-color diagram shown in Fig. 4 (crosses) clearly, they occupy a different locus than the foreground stars. This is consistent with the results of Amores et al. (2012) who visually identify galaxies behind the Galactic plane in the VVV survey, and used color-color diagrams to confirm the galaxy-star separation.
Finally, the Fig. 5 shows a false-color multiband (J, H, Ks) image, centered in the X-ray peak emission, where the five brightest galaxies can be found very close to this peak. From this image, it is possible to observe that galaxy cluster member candidates show redder colors, with respect to the foreground stars, and extended morphology characteristic of galaxies. Besides, the area corresponding to core radius according to the model adopted for Mori et al. (2013) to fit the X-ray profile of the surface brightness is shown.
Table 2 lists the cluster galaxy candidate parameters ordered by total magnitude. The list includes an identification number, coordinates, aperture and total magnitudes and classification.
Although we can not estimate the real contamination of background galaxies without redshift measurements, the fact that the restriction of the analysis to the central region of the galaxy cluster favors elliptical and S0 galaxies with typical red colors, minimizes the background galaxy contamination. For instance, the red sequence has been used as an efficient method to detect galaxy clusters, at optical and infrared wavelengths, with a contamination of less than 5% (Gladders & Yee 2000). More recently, Barkhouse et al. (2006) uses the red sequence to improve the Voronoi tessellation and percolation technique reducing significantly the contamination.
| ID | RA(J2000) | DEC(J2000) | J() | H() | () | J | H | class | |
|---|---|---|---|---|---|---|---|---|---|
| hh:mm:ss.ss | dd:mm:ss.ss | mag | mag | mag | mag | mag | mag | ||
| 1 | 17:59:19.44 | -34:50:18.7 | 15.19 0.03 | 14.52 0.02 | 13.98 0.02 | 13.00 0.02 | 12.50 0.02 | 12.12 0.02 | I |
| 2 | 17:59:12.98 | -34:49:48.5 | 15.30 0.03 | 14.76 0.02 | 14.36 0.02 | 13.39 0.02 | 12.95 0.02 | 12.62 0.02 | I |
| 3 | 17:59:14.75 | -34:50:19.9 | 15.64 0.04 | 14.97 0.03 | 14.41 0.03 | 13.40 0.02 | 13.06 0.02 | 12.71 0.02 | I |
| 4 | 17:59:10.97 | -34:51:42.2 | 15.50 0.03 | 14.85 0.02 | 14.33 0.02 | 13.70 0.02 | 13.27 0.02 | 12.96 0.02 | I |
| 5 | 17:59:22.85 | -34:49:42.0 | 16.21 0.06 | 15.53 0.04 | 14.92 0.04 | 14.12 0.03 | 13.77 0.03 | 13.39 0.03 | I |
| 6 | 17:59:25.91 | -34:48:49.5 | 16.21 0.05 | 15.55 0.04 | 15.16 0.04 | 14.91 0.06 | 14.30 0.05 | 13.77 0.04 | I |
| 7 | 17:59:31.11 | -34:49:39.5 | 16.28 0.06 | 15.60 0.04 | 15.15 0.04 | 14.58 0.04 | 14.22 0.04 | 14.04 0.05 | I |
| 8 | 17:59:26.33 | -34:49:24.0 | 16.53 0.07 | 15.70 0.05 | 15.45 0.05 | 14.69 0.04 | 13.99 0.03 | 14.07 0.05 | I |
| 9 | 17:59:05.36 | -34:49:56.9 | 16.73 0.08 | 16.05 0.06 | 15.60 0.06 | 15.24 0.06 | 14.63 0.05 | 14.32 0.05 | II |
| 10 | 17:59:09.71 | -34:49:30.0 | 15.94 0.05 | 15.40 0.04 | 14.97 0.04 | 15.35 0.05 | 14.82 0.05 | 14.54 0.05 | I |
| 11 | 17:59:30.54 | -34:49:10.0 | 17.01 0.10 | 16.24 0.07 | 15.58 0.06 | 15.58 0.07 | 15.14 0.07 | 14.58 0.06 | I |
| 12 | 17:59:22.85 | -34:48:56.2 | 16.47 0.06 | 15.88 0.05 | 15.51 0.05 | 15.62 0.06 | 15.22 0.06 | 15.02 0.07 | II |
| 13 | 17:59:16.07 | -34:49:45.6 | 16.18 0.05 | 15.59 0.04 | 15.16 0.04 | 16.05 0.06 | 15.45 0.05 | 15.04 0.05 | I |
| 14 | 17:59:10.11 | -34:49:49.2 | 16.53 0.07 | 16.05 0.06 | 15.65 0.06 | 15.53 0.07 | 15.28 0.08 | 15.07 0.09 | II |
| 15 | 17:59:11.06 | -34:49:48.5 | 16.55 0.07 | 15.97 0.06 | 15.65 0.06 | 16.42 0.07 | 16.01 0.06 | 15.41 0.06 | I |
4 Discussion
The analysis reported in the previous sections demonstrated that the field of Suzaku J17593450 contains multiple galaxy candidates that show the colors and magnitudes cluster members, including the brightest galaxy, with 12.1, and four other prominent objects in the magnitude range 12.5 13.5. Brough et al. (2002) indicates that the brightest cluster galaxies (BCGs) in clusters with X-ray luminosity (0.3-3.5 keV)1.91044erg s-1 have apparent magnitudes around 12 mag, consistent with our measurements. Moreover, the apparent magnitude of the BCG is consistent with an absolute magnitude of 25.6, if we assume that this galaxy is a member of a galaxy cluster at redshift =0.13, also in agreement with Brough et al. (2002). These results reinforce the assumption that the red-sequence detected indeed corresponds to the new galaxy cluster, reported by Mori et al. (2013).
Considering the visual appearance of the BCG corresponding to a very luminous elliptical galaxy, half magnitude brighter than the second brightest galaxy, the large diffuse halo, and the proximity to the X-ray emission peak (25 arcsec) we could speculate that this is a cD galaxy.
In addition to the modeled red-sequence, we also calculated the red-sequence slope using only the visually confirmed galaxies brighter than 14.1, corresponding to galaxies 2 magnitudes fainter than the brightest one to minimizing the contamination which is more likely for the faintest galaxies. This empiric red-sequence is shown in Fig. 3 (dotted line) showing a good agreement with the modeled one. It is important to highlight that a random selection of galaxies at different redshifts will not form a coherent red sequence (Gladders & Yee 2000), therefore the projection effect would not affect significantly this selection criteria. Anyway spectroscopic measurement of the redshifts of the newly identified cluster members will be extremely useful to confirm these results. The obtained value of the slope, is consistent with that found by Stott et al. (2009) for three galaxy clusters at 0.13.
It is worth mentioning that the detected candidates to galaxy cluster member have an asymmetric spatial distribution with respect to the position of the X-ray peak emission. Instead, the galaxies are preferentially located on one side of the X-ray peak emission. In this sense, Forman & Jones (1982) and Jones & Forman (1984) propose a two-dimensional classification scheme for the X-ray morphology of the intracluster gas which represents a sequence of cluster evolution. Moreover, the presence or absence of a central, dominant galaxy in the cluster is considered in the classification scheme of Forman & Jones (1982). The authors classify the clusters as being early if the overall X-ray surface brightness distribution is irregular or evolved if it is regular. In addition, clusters containing a central dominant galaxies are classified as X-ray dominant (XD) while those without such a galaxy are classified as non-X-ray dominant (nXD). The nXD clusters have larger X-ray core radii and there is no strong X-ray emission associated with any individual galaxy in these systems. That is, the galaxy cluster could be X-ray dominant or non-X-ray dominant for the regular or irregular X-ray surface brightness.
As it was mentioned, in this particular case, the cluster has a regular X-ray morphology without a central dominant galaxy in the X-ray peak emission. So, Suzaku J17593450 can be classified as a regular nXD cluster. Several galaxy clusters have a similar characteristic i.e. A1656 (Abramopoulos, Chanan & Ku 1981), A576 (White & Silk 1980), A2255, A2256 (Forman & Jones 1982) and CA0340-538 (Ku et al. 1983). This feature indicates that the galaxy cluster is still evolving and suffering dynamical processes. In the same sense Mori et al. (2013) found that, even with a approximately circular X-ray morphology, the peak position of the surface brightness is slightly shifted from the center of the circular emission in the south-east direction suggesting that the cluster dynamical relaxation has not taken place yet.
5 Conclusions
Summarizing, we used VVV Survey data to obtain deep NIR photometry of objects in the vicinity of the recently identified galaxy cluster Suzaku J17593450 at =0.13. At least fifteen galaxies were detected within a projected distance of 350 from the central peak of the X-ray peak emission, and five of them are extremely bright.
All these cluster member candidates have the typical colors and magnitudes of galaxies at redshift =0.13. The candidate BCG is more than half magnitude brighter than the next brightest galaxy candidate, indicating that it may be a cD galaxy. These results lead us to conclude that Suzaku J17593450 is indeed an obscured galaxy cluster at =0.13. Spectroscopic observations are needed to measure the redshifts of the newly identified cluster members, and to study their stellar populations in detail.
Acknowledgements.
We would like to thanks to anonymous referee for the comments that helped to improve the paper. GC, SA and FD acknowledge the support from CONICET through grant PIP 2012-2014, GI 11220110100298. Support for MH has been provided by the BASAL Center for Astrophysics and Associated Technologies PFB-06, the FONDAP Center for Astrophysics N. 15010003, and the Ministry for the Economy, Development and Tourism’s Programa Iniciativa Científica Milenio through grant P07-021-F, awarded to The Milky Way Millenium Nucleus. DM is supported by Project IC120009 Millennium Institute of Astrophysics (MAS) of Iniciativa Científica Milenio del Ministerio de Economía, Fomento y Turismo, by the Basal Center for Astrophysics and Associated Technologies (CATA) PFB-06, and by Fondecyt Project No. 1130196. GV acknowledge the support from Agencia Nacional de Promoción Científica y Tecnológica, PICT 2010 Bicentenario N°0680.References
- Abramopoulos, Chanan & Ku (1981) Abramopoulos, F., Chanan, G. A. & Ku, W.H.M., 1981, ApJ, 248, 429.
- Amores et al. (2012) Amores, E., Sodre, L., Minniti, D. et al. 2012, AJ, 144, 127.
- Bahcall et al. (2003) Bahcall, N.A., Dong, F., Bode, P. et al. 2003, ApJ, 585, 182.
- Barkhouse et al. (2006) Barkhouse, W. A. et al. , 2006, ApJ, 645, 955.
- Beamín et al. (2013) Beamín, J.C., Minniti, D., Gromadzki, M., et al. 2013, A&A, 557, L8.
- Bertin & Arnouts (1996) Bertin, E. & Arnouts, S. 1996,A&AS, 117, 393.
- Bonnarel et al. (2000) Bonnarel, F., Fernique, P., Bienaymé, O., Egret, D., Genova, F., Louys, M., Ochsenbein, F., Wenger, M., Bartlett, J. G., 2000, A&AS, 143, 33.
- Borissova et al. (2011) Borissova, J., Bonatto, C., Kurtev, R., et al. 2011, A&A, 532, 131.
- Brough et al. (2002) Brough, S., Collins, C.A., Burke, D.J., Mann, R.G.& Lynam, P.D. 2002, MNRAS329, 53.
- Bruzual & Charlot (2003) Bruzual G. & Charlot S., 2003, MNRAS, 344, 1000.
- Chabrier (2003) Chabrier G., 2003, PASP, 115, 763.
- Dalton et al. (2006) Dalton, G.B., Caldwell, M., Ward, A.K. et al. 2006, SPIE, 6269, 30.
- Dressler (1980) Dressler, A. 1980, ApJ, 236, 351.
- Emerson et al. (2004) Emerson, J.P., McPherson, A.M., Sutherland, W.J. et al. 2006, The Messenger, 126, 41.
- Emerson et al. (2006) Emerson, J.P., Sutherland, W.J., McPherson, A.M. et al. 2004, The Messenger, 117, 27.
- Emerson & Sutherland (2010) Emerson, J.P.& Sutherland, W.J. 2010, Proc. SPIE, 7733.
- Finoguenov et al. (2007) Finoguenov. A., Guzzo, L., Hasinger, G. et al. 2007, ApJS, 172, 182.
- Finlator et al. (2000) Finlator, K. et al. 2000, AJ, 120, 2615.
- Fagotto et al. (1994a) Fagotto F., Bressan A., Bertelli G. & Chiosi C., 1994, A&AS 104, 365.
- Fagotto et al. (1994b) Fagotto F., Bressan A., Bertelli G. & Chiosi C., 1994, A&AS 105, 29.
- Forman & Jones (1982) Forman W. & Jones C., 1982, ARA&A, 20, 547.
- Gladders et al. (1998) Gladders, M.D., Lopez-Cruz, O., Yee, H.C.K & Kodama T., 1998, ApJ, 501, 571.
- Gladders & Yee (2000) Gladders, M.D. & Yee, H.K.C., 2000, AJ,120, 2148.
- Gladders et al. (2007) Gladders, M.D., Yee, H.K.C., Majumdar, S., Barrientos, L.F., Hoekstra, H., Hall, P.B., & Infante, L., 2007, ApJ, 655, 128.
- Gonzalez et al. (2011) Gonzalez O.A., Rejkuba, M., Zoccali M., Valenti E.& Minniti D. 2011 A&A, 534, 3.
- Gonzalez et al. (2012) Gonzalez, O.A., Rejkuba, M., Zoccali, M., Valenti, E., Minniti, D., Schultheis, M., Tobar, R. & Chen, B. 2012, A&A, 543, 13.
- Gursky et al. (1972) Gursky, H., Levinson, R., Kellogg, E., Murray, S., Tananbaum, H., Giacconi, R., & Cavaliere, A., 1972, ApJ, 173, 99.
- Ivanov et al. (2014) Ivanov, V.D., Minniti, D., Hempel, M., et al. 2014, A&A, 560, 21.
- Jones & Forman (1984) Jones C. & Forman W., 1984, ApJ, 276, 38.
- Kraan-Korteweg & Lahav (2000) Kraan-Korteweg R.C. & Lahav O. 2000, A&ARv, 10, 211.
- Kron (1980) Kron R.G., 1980, ApJ, 43, 305.
- Ku et al. (1983) Ku, W.H.M., Abramopoulos, F., Nulsen, P.E.J., Fabian, A.C., Stewart, G.C., Chincarini, G.L. & Tarenghi, M., 1983, MNRAS, 203, 253.
- Lewis, Irwin & Bunclark (2010) Lewis J.R., Irwin, M. & Bunclark, P. 2010, ASPC, 434, 91.
- Lopez-Cruz, Barkhouse & Yee (2004) Lopez-Cruz, O., Barkhouse, W.A. & Yee H.K.C., 2004, ApJ, 644, 759.
- Minniti et al. (2010) Minniti, D., Lucas, P.W., Emerson P.J., et al. 2010, New A, 15, 433.
- Minniti et al. (2011) Minniti, D., Hemoel, M., Toledo, I. et al. 2011, A&A, 527, 81.
- Mori et al. (2013) Mori, H., Maeda, Y., Furuzawa, A., Haba Y. & Ueda Y. 2013, PASJ, 65, 102.
- Nishiyama et al. (2009) Nishiyama, S., Tamura, M., Hatano, H. et al. 2009, ApJ, 696, 1407.
- Pierre et al. (2006) Pierre, M., Pacaud, F., Duc, P.A. et al. , 2006, MNRAS, 372, 591.
- Planck Collaboration et al. (2013) Planck Collaboration, Ade, P.A.R., Aghanim, N., et al. , 2013, arXiv:1303.5076.
- Romer et al. (2001) Romer, A.K., Viana, P.T.P., Liddle, A.R. & Mann R.G., 2001, ApJ, 547, 594.
- Rozo et al. (2010) Rozo E., Wechsler R.H., Rykoff, E.S. et al. , 2010, ApJ, 708, 645.
- Saito et al. (2012) Saito, R.K., Hempel, M., Minniti, D. et al. 2012, A&A, 537, A107.
- Söchting et al. (2006) Söchting, I.K., Huber, M.E., Clowes, R.G. & Howell, S.B. 2006, MNRAS, 369, 1334.
- Stott et al. (2009) Stott, J.P., Pimbblet, K.A., Edge, A.C., Smith, G.P. & Wardlow, J.L., 2009, MNRAS, 394, 2098.
- Treu et al. (2003) Treu, T., Ellis, R.S., Kneib, J.P., et al. , 2003, ApJ, 591, 53
- Whitmore & Gilmore (1991) Whitmore, B.C., & Gilmore, D.M., 1991, ApJ, 367, 64.
- White & Silk (1980) White, S.D.M. & Silk, J., 1980, ApJ, 241, 864.
- Woudt et al. (2004) Woudt, P.A., Kraan-Korteweg, R.C., Cayatte, V., Balkowski, C.& Felenbok, P. 2004,A&A, 415, 9.
- Visvanathan & Sandage (1977) Visvanathan, N. & Sandage, A., 1977, ApJ, 216, 214.
- Voges et al. (1999) Voges, W., Aschenbach, B., Boller, Th., et al. 1999, A&A, 349, 389