Optical-phonon resonances with saddle-point excitons in twisted-bilayer graphene
Abstract
Twisted-bilayer graphene (tBLG) exhibits van Hove singularities in the density of states that can be tuned by changing the twisting angle . A -defined tBLG has been produced and characterized with optical reflectivity and resonance Raman scattering. The -engineered optical response is shown to be consistent with persistent saddle-point excitons. Separate resonances with Stokes and anti-Stokes Raman scattering components can be achieved due to the sharpness of the two-dimensional saddle-point excitons, similar to what has been previously observed for one-dimensional carbon nanotubes. The excitation power dependence for the Stokes and anti-Stokes emissions indicate that the two processes are correlated and that they share the same phonon.
KEYWORDS: graphene, Raman scattering, optical reflectivity
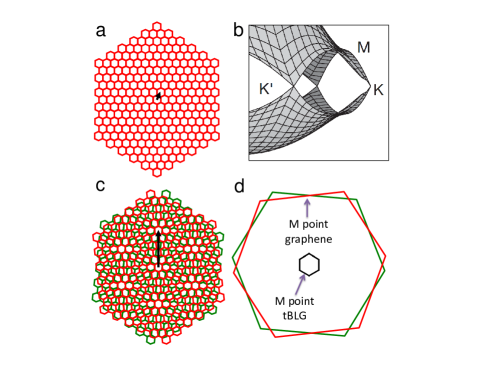
Saddle points in the electron dispersion of two-dimensional systems generate logarithmic diverging van-Hove singularities (vHs) in the density of states (DOS) vHs . In single-layer graphene (Fig. 1a), the vHs occur at the M point for both the valence () and conduction () bands (Fig. 1b), and consequently in the joint density of sates (JDOS) for optical properties. The JDOS vHs falls into the ultra-violet frequency region in graphene raman-book , as well as the related peak in the optical conductivity (), which is redshifter from the JDOS vHs due to excitonic effects heinz-Mpoint .
Twisted-bilayer graphene (tBLG) are formed by adding a twist angle between two graphene layers on top of each other mele2010 ; morell10 ; li2010 ; jorio2013 . The expansion of the real lattice parameter when building a superstructured tBLG (see arrow in Fig. 1c) generates a shrinking of the reciprocal space (Fig. 1d), thus bringing the Dirac (K and K′) points close together and moving them closer to the M saddle point. Consequently, the vHs will shift in energy, thereby redshifting the JDOS vHs to visible frequencies and even into the far-infrared, depending on the twisting angle . This effect has been measured in tBLG using scanning tunneling spectroscopy li2010 and it has been explored using Raman spectroscopy jorio2013 ; ni2009 ; gupta2010 ; carozo2011 ; righi2011 ; havaner2012 ; kim2012 ; sato2012 ; campos-delgado2013 ; carozo2013 .
Up to date, the studied tBLGs have been produced randomly, i.e. without controlling the twist angle . Furthermore, the generated 2D vHs have been directly measured only by scanning tunneling spectroscopy li2010 , which is limited to energies near the Fermi level and is usually more invasive and less accurate than optical measurements. Here we report the production and optical characterization of a tBLG with a previously selected angle, chosen specifically to explore Stokes and anti-Stokes resonance Raman scattering effects. By mode-engineering the system to work in resonance with the anti-Stokes line, we observe a quadratic power dependence of the anti-Stokes process. This power dependence is indicative of Stokes-induced anti-Stokes scattering in which the phonon generated by the Stokes scattering is consumed by the anti-Stokes process.
Resonance Raman studies show that the peak in the optical conductivity is given by , with obtained experimentally carozo2013 . By choosing , we expect . Our tBLG sample was prepared from mechanically-exfoliated single-layer graphene flakes with well-defined edges (see Fig. 2a,b). After a first graphene flake had been transferred on top of a solid SiO2 surface, a second flake is put down, rotated with respect to the first by an angle . Then the tBLG was transferred onto a 500 nm thick SiNx membrane perforated with holes of 10 m diameter (see optical image in Fig. 2c and schematics in Fig. 2d). Notice that while well-defined edges are a sufficient indication of armchair or zigzag atomic structures, they cannot be differentiated optically, and the procedure here has 50% chance of generating a () angle, rather than the wanted . We also fabricated a reference sample with by directly depositing a mechanically exfoliated AB-stacked bilayer graphene (AB-BLG). All experiments were performed in the freely suspended region of the graphene tBLG, that is, in the holes of the SiNx membrane. This excludes any substrate-related background scattering and artifacts.
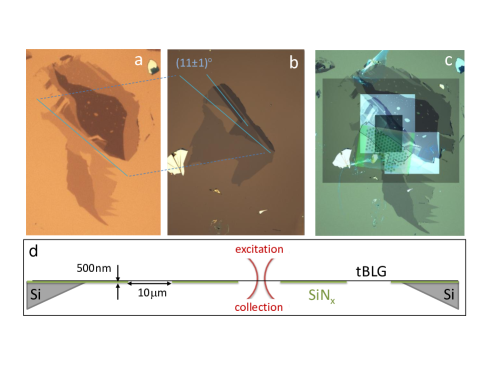
Figure 3 shows the reflectivity of the tBLG shown in Fig. 2c, measured with a supercontinuum laser and normalized to the response of the AB-BLG. The tBLG reflectivity peak is observed at , in excellent agreement with the prediction for carozo2013 . The asymmetric reflectivity lineshape observed in the ultra-violet for graphene has been identified as a result of the convolution between a well-defined (excitonic) transition with a continuum density of electronic states, which results in a Fano resonance feature heinz-Mpoint . The asymmetric lineshape shown in Fig. 3 is fully consistent with this picture, showing that many-body effects leading to the formation of two-dimensional saddle-point excitons are persistent, remaining in the modified structure of tBLG.

Having properly characterized the energy of the saddle-point exciton (), we can now explore different phenomena in the resonance Raman scattering. Figure 4 shows the anti-Stokes and Stokes G band Raman spectra for AB-BLG (a,b) and tBLG (c,d). In Fig. 4a,c the samples were excited with the HeNe laser at eV ( nm), while in Fig. 4b,d the samples were excited with a frequency doubled YAG laser at eV ( nm). These two laser energies are marked in Fig. 3 by the vertical dashed lines. Notice that the two lasers are off resonance with respect to the saddle-point exciton, being blue- or red-shifted from by approximately the G band phonon energy ( eV).

In the AB-BLG case (Fig. 4a,b), the Stokes and anti-Stokes signals do not change significantly when changing the excitation laser energy. The spectra obtained with eV and eV are similar (see Fig. 4a,b), and the ratio is basically unchanged. However, in the case of tBLG, the spectra change significantly when changing the excitation laser energy. Figure 4c shows a Stokes signal 10 times stronger than the average signal obtained from the AB-BLG. Figure 4d, on the other hand, shows an anti-Stokes signal 10 times stronger than in the AB-BLG. The ratio thus changes by two orders of magnitude when changing the measurements with eV and eV. This result happens because, while the eV laser leads to a resonance with the anti-Stokes photon emission, the eV laser rise to a resonance with the Stokes photon emission. Similar results were observed in one-dimensional (1D) carbon nanotubes agsf2001 , where sharp resonances are characteristics of the 1D band structure jorio2001 . Interestingly, similar effect can be observed in a two-dimensional graphene system due to the sharp saddle-point exciton resonance.
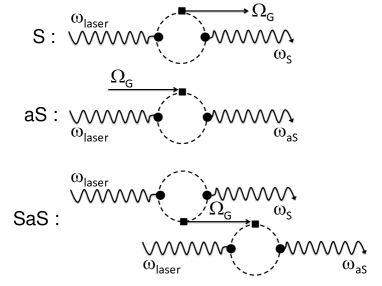
Notice that in Figure 4d, the anti-Stokes G band signal intensity is close to the Stokes intensity. Although similar result has been observed in carbon nanotubes before agsf2001 ; jorio2001 , an important question remains: where do these high energy G band phonons, which are being annihilated in the highly efficient resonant anti-Stokes emission, come from? To answer this question, we refer to the Feynman diagrams shown in Figure 5. The S diagram shows the Stokes Raman scattering event where a phonon and a Stokes-shifted Raman photon are generated. The aS diagram shows the anti-Stokes Raman scattering process, where one existing phonon is annihilated, generating the anti-Stokes shifted Raman photon. The aS process depends on the previous existence of the phonon in the lattice. In the case of graphene, eV is much higher then the thermal (room temperature) energy. The last diagram in Figure 5, which we call here the Stokes-anti-Stokes (SaS) event, describes a non-linear process where a phonon created by the Stokes process is subsequently annihilated in the anti-Stokes process. The Stokes and anti-Stokes photons emerging from the SaS event can be correlated and, as discussed by D. N. Klyshko klyshko , the character of this correlation can be continuously varied from purely quantum to purely classical. In order to observe the SaS scattering, we need to efficiently consume photo-generated phonons in the anti-Stokes process. Otherwise, the phonons will decohere via scattering. We also need high energy optical phonons that are unlikely to be populated at room temperature. These constrains are achieved in our -defined tBLG system.
To differentiate the anti-Stokes signal originated from the SaS event from that produced by the usual aS process, we analyze the excitation laser power () dependence of the anti-Stokes Raman intensity (). Considering both the aS and SaS events in Fig. 5 separately, assumes the form:
| (1) |
where and are constants and is the temperature dependent Bose-Einstein phonon distribution function. In the thermal regime, the dependence of on reflects the material temperature through . In the regime where the SaS event dominates, is proportional to .
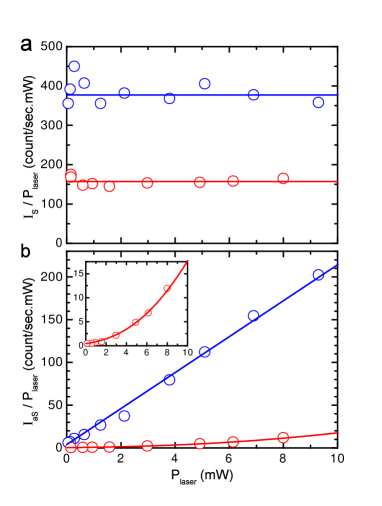
Figure 6 shows the power dependence of the Stokes (a) and anti-Stokes (b) signals from the tBLG (blue) and from the AB-BLG (red), when excited with eV. The intensities are normalized by the excitation laser power. Figure 6a shows that the Stokes signal scales linearly with excitation power for both samples, which is indicative for the spontaneous scattering regime. However, the anti-Stokes Raman signals of the two samples show markedly different behaviors (Fig. 6b).
The anti-Stokes intensity of the tBLG excited at eV shows a quadratic power dependence within the measured range (0-10 mW, blue data in Fig. 6b). The data can be accurately fitted by Eq. 1 considering constant at K, with W-1s-1 and W-2s-1. For comparison, the power-normalized anti-Stokes intensity from the AB-BLG reference standard shows a much less pronounced enhancement within the measured range (see red data in Fig. 6b), with a clear non-linear power dependence behavior (see inset). The AB-BLG data can be fit with W-1s-1, assuming that the temperature depends linearly on the excitation laser power as , with mW-1K and . According with this latest equation, for ,mW the AB-BLG temperature crosses 600∘C. The AB-BLG sample burns for laser powers above 12 mW, while the tBLG stands much higher powers, evidencing the cooling process induced by the efficient anti-Stokes resonant emission. It is important to comment, however, that the presence of some heating in the tBLG or the SaS event in the AB-BLG reference sample cannot be ruled out from the results shown here, since a relatively small non-zero temperature increase for tBLG or term for AB-BLG can be added to the fitting curves without significantly compromising the fitting qualities.
The SaS process has been measured in diamond Lee2012 . The experiments were carried out in the femtosecond pump regime, where the extremely high number of photons per pulse significantly enhances the SaS probability. It is surprising that our results indicate the observation of the SaS event in graphene with a significantly low power from a CW laser. Lee et al. Lee2012 demonstrated the quantum nature of the SaS correlation in bulk diamond at room temperature by measuring a non-classical SaS second-order time correlation function . This type of measurement has to be developed in graphene, so that the correlation nature of the SaS event, as proposed by D. N. Klyshko klyshko and observed for bulk diamond Lee2012 , could be explored.
We expect the SaS event also to play a role in other low dimensional materials, like in carbon nanotubes. Steiner et al. steiner2007 observed laser-induced phonon cooling in single-wall carbon nanotubes by introducing them into an external optical cavity. They discussed how this scheme can be used to remove high energy hot phonons, which play an important role in the thermal and electrical properties of low-dimensional structures steiner2009 ; barreiro2009 . Here we designed a system that can perform like a cooling system, but the nanostructure itself is the cavity. Because of the M-point engineering scheme used to build the tBLG, the resonance can be tuned to work at any selected wavelength from the far-infrared up to the ultra-violet, in the amplifying or cooling mode, just by changing the tBLG angle . Also, multiple twisted bilayer graphenes can be stacked (separated for example by hexagonal-BN) to enhance the efficiency further.
Finally, since Raman spectroscopy is established as an important tool to study and characterize nanostructures, our findings indicate that the SaS event has to be considered when using this technique to extract structural and transport properties of low-dimensional structures. In future work it will be interesting to study changes of the phonon (G band) linewidth and frequency as a function of detuning (), which may change the influence of the Kohn anomaly piscanec effects in the G band properties.
I Acknowledgement
The authors strongly acknowledge valuable discussions with Dr. P. Bharadwaj and L. G. Cançado. A.J. acknowledges Inmetro for the background developed in tBLG, CAPES and ETH for financing his visit to ETH Zurich. L.N. thanks financial support by the Swiss National Science Foundation (SNF) through grant 200021-14 6358. A.V. thanks the Engineering and Physical Sciences Research Council (EPSRC) for financial support through grants EP/G035954/1 and EP/K009451/1.
References
- (1) Hove, L. V. The occurrence of singularities in the elastic frequency distribution of a crystal. Phys. Rev. B 1953, 89(6), 1189.
- (2) Jorio, A.; Dresselhaus, M. S.; Saito, R. Raman Spectroscopy in Graphene Related Systems (Wiley-VCH, 2011).
- (3) Mak, K. F.; Shan, J.; Heinz, T. F. Seeing many-body effects in single- and few-layer graphene: observation of two-dimensional saddle-point excitons. Phys. Rev. Lett. 2011, 106, 046401.
- (4) Mele, E. J. Commensuration and interlayer coherence in twisted bilayer graphene. Phys. Rev. B 2010, 81, R161405.
- (5) Suárez Morell, E.; Correa, J. D.; Vargas, P.; Pacheco, M.; Barticevic, Z. Flat bands in slightly twisted bilayer graphene: Tight-binding calculations, Phys. Rev. B 2010, 82, R121407.
- (6) Li, G.; Luican, A.; Lopes dos Santos, J. M. B.; Castro Neto, A. H.; Reina, A.; Kong, J.; Andrei, E. Y. Observation of Von Hove singularities in twisted graphene layers. Nature Phys. 2010, 6, 109.
- (7) Jorio, A.; Cançado, L. G. Raman spectroscopy of twisted bilayer graphene. Solid State Comm. 2013, 175-176, 3.
- (8) Ni, Z. et al. G-band Raman double resonance in twisted bilayer graphene: Evidence of band splitting and folding. Phys. Rev. B 2009, 80, 125404.
- (9) Gupta, A. K.; Tang, Y.; Crespi, V. H.; Eklund, P. C. Nondispersive Raman D band activated by well-ordered interlayer interactions in rotationally stacked bilayer graphene. Phys. Rev. B 2010, 82, 241406.
- (10) Carozo, V. et al. Raman signature of graphene superlattices. Nano Lett. 2011, 11, 4527.
- (11) Righi, A. et al. Graphene Moiré patterns observed by umklapp double-resonance Raman scattering. Phys. Rev. B 2011, 84, 241409.
- (12) Havener, R. W.; Zhuang, H.; Brown, L.; Hennig, R. G.; Park, J. Angle-resolved Raman imaging of interlayer rotations and interactions in twisted bilayer graphene. Nano Lett. 2012, 12, 3162.
- (13) Kim, K. et al., Raman spectroscopy study of rotated double-layer graphene: misorientation-angle dependence of electronic structure. Phys. Rev. Lett. 2012, 108, 246103.
- (14) Sato, K.; Saito, R.; Cong, C.; Yu, T.; Dresselhaus, M. S. Zone folding effect in Raman G-band intensity of twisted bilayer graphene. Phys. Rev. B 2012, 86, 125414.
- (15) Campos-Delgado, J.; Cançado, L. G.; Achete, C. A.; Jorio, A.; Raskin, J.-P. Raman scattering study of the phonon dispersion in twisted bilayer graphene. Nano Research 2013, 6, 269.
- (16) Carozo, V. et al., Resonance effects on the Raman spectra of graphene superlattices. Phys. Rev. B 2013, 88, 085401.
- (17) Souza Filho, A. G.; Jorio, A.; Hafner, J. H.; Lieber, C. M.; Saito, R.; Pimenta, M. A.; Dresselhaus,G.; Dresselhaus, M. S. Electronic transition energy for an isolated () single-wall carbon nanotube obtained by anti-Stokes/Stokes resonant Raman intensity ratio. Phys. Rev. B 2001, 63, 241404(R)
- (18) Jorio, A.; Souza Filho, A. G.; Dresselhaus, G.; Dresselhaus, M. S.; Saito, R.; Hafner, J. H.; Lieber, C. M.; Matinaga, F. M.; Dantas, M. S. S.; Pimenta, M. A. Joint density of electronic states for one isolated single-wall carbon nanotube studied by resonant Raman scattering. Phys. Rev. B 2001, 63, 245416.
- (19) Klyshko, D. N. Photons and Nonlinear Optics (Gordon and Breach Science Publishers, New York, 1988).
- (20) Lee, K. C. et al. Macroscopic non-classical states and terahertz quantum processing in room-temperature diamond. Nature Photon. 2012, 6, 41.
- (21) Steiner, M.; Qian, H.; Hartschuh, A.; Meixner, A. J. Controlling Nonequilibrium Phonon Populations in Single-Walled Carbon Nanotubes. Nano Lett. 2007, 7(8), 2239.
- (22) Steiner, M. et al. Phonon populations and electrical power dissipation in carbon nanotube transistors. Nature Nanotech. 2009, 4, 320.
- (23) Barreiro, A.; Lazzeri, M.; Moser, J.; Mauri, F.; Bachtold, A. Transport properties of graphene in the high-current limit. Phys. Rev. Lett. 2009, 103, 076601.
- (24) Piscanec, S.; Lazzeri, M.; Mauri, F.; Ferrari, A. C.; Robertson, J. Kohn Anomalies and Electron-Phonon Interactions in Graphite. Phys. Rev. Lett. 2004, 93, 185503.