The census of complex organic molecules in the solar type protostar IRAS16293-2422
Abstract
Complex Organic Molecules (COMs) are considered crucial molecules, since they are connected with organic chemistry, at the basis of the terrestrial life. More pragmatically, they are molecules in principle difficult to synthetize in the harsh interstellar environments and, therefore, a crucial test for astrochemical models. Current models assume that several COMs are synthesised on the lukewarm grain surfaces (30–40 K), and released in the gas phase at dust temperatures 100 K. However, recent detections of COMs in 20 K gas demonstrate that we still need important pieces to complete the puzzle of the COMs formation. We present here a complete census of the oxygen and nitrogen bearing COMs, previously detected in different ISM regions, towards the solar type protostar IRAS16293-2422. The census was obtained from the millimeter-submillimeter unbiased spectral survey TIMASSS. Six COMs, out of the 29 searched for, were detected: methyl cyanide, ketene, acetaldehyde, formamide, dimethyl ether, and methyl formate. The multifrequency analysis of the last five COMs provides clear evidence that they are present in the cold (30 K) envelope of IRAS16293-2422, with abundances 0.03–2 . Our data do not allow to support the hypothesis that the COMs abundance increases with increasing dust temperature in the cold envelope, as expected if COMs were predominately formed on the lukewarm grain surfaces. Finally, when considering also other ISM sources, we find a strong correlation over five orders of magnitude, between the methyl formate and dimethyl ether and methyl formate and formamide abundances, which may point to a link between these two couples of species, in cold and warm gas.
1 Introduction
Complex Organic Molecules (COMs), namely organic molecules with more than six atoms (Herbst & van Dishoeck, 2009), have been discovered since more than four decades (Ball et al., 1971; Rubin et al., 1971; Solomon et al., 1971; Brown et al., 1975; Blake et al., 1987). Since some COMs have a prebiotic relevance, they immediately rise a great interest and several models were developed to explain why and how these molecules are formed in space. Those models were based on this two-step process: (i) “mother” (or first generation) species were created during the cold star formation process and frozen into the grain mantles; (ii) “daughter” (or second generation) species were synthesised via gas phase reactions from mother species in the warm ( K) regions where the grain mantles sublimate (Millar et al., 1991; Charnley et al., 1992; Caselli et al., 1993). This two-step paradigm, has enjoyed a great success for about a decade, until new observations towards low mass hot corinos (Ceccarelli et al., 2000; Cazaux et al., 2003) and Galactic Center molecular clouds (Requena-Torres et al., 2007) challenged the assumption that COMs are formed by gas phase reactions. At the same time, new laboratory experiments and theoretical computations revisited and ruled out some gas phase reactions crucial in those models (Horn et al., 2004; Geppert et al., 2007). The attention then moved towards the possibility that grains could act as catalysers and that COMs could form on their surfaces at lukewarm (30–40 K) temperatures (Garrod et al., 2009). However, grain surface chemistry is even more difficult to understand than gas phase chemistry, both from a theoretical and experimental point of view. Let us take the example of methanol, one of the simplest COMs. It is supposed to form on the grain surface via successive hydrogenation of frozen CO (Tielens & Hagen, 1982; Taquet et al., 2012). However, while laboratory experiments claim that this is the case (e.g. (Watanabe & Kouchi, 2002; Pirim et al., 2010)), theoretical quantum chemistry computations show that the first and last steps towards the CH3OH formation have large (tens of kCal) energy barriers impossible to surmount in the cold ( K) cloud conditions (Woon, 2002; Marenich & Boggs, 2003; Goumans et al., 2008), where the CO hydrogenation is supposed to occur. To add confusion, recent observations have revealed that some COMs (notably acetaldehyde, methyl formate and dimethyl ether) are found in definitively cold ( K) regions (Öberg et al., 2010; Bacmann et al., 2012; Cernicharo et al., 2012), challenging the theory of grain surface formation of COMs.
In this context, we examined the millimeter-submillimeter spectral survey obtained towards the solar type protostar IRAS16293-2422 (hereinafter IRAS16293; Caux et al. 2011) with the goal to extract the line emission from all oxygen and nitrogen bearing COMs already detected in the ISM, and to estimate their abundances across its envelope. Our emphasis here is on the abundances in the cold ( K) region of the envelope, to provide astrochemical modellers with the first systematic survey of COMs in cold gas.
2 Source description
IRAS16293 is a solar type Class 0 protostar in the Ophiuchus star forming region, at a distance of 120 pc (Loinard et al., 2008). It has a bolometric luminosity of 22 L☉ (Crimier et al., 2010). Given its proximity and brightness, it has been the target of numerous studies that have reconstructed its physical and chemical structure. Briefly, IRAS16293 has a large envelope that extends up to 6000 AU and that surrounds two sources, named I16293-A and I16293-B in the literature, separated by (600 AU; Wootten (1989); Mundy et al. (1992)). I16293-A sizes are , whereas I16293-B is unresolved at a scale of (Zapata et al., 2013). I16293-A itself is composed of two sources, each one emitting a molecular outflow (Mizuno et al., 1990; Loinard et al., 2013). I16293-B possesses a very compact outflow (Loinard et al., 2013) and is surrounded by infalling gas (Pineda et al., 2012; Zapata et al., 2013). From a chemical point of view, IRAS16293 can be considered as composed of an outer envelope, characterised by low molecular abundances, and a hot corino, where the abundance of many molecules increases by orders of magnitude (Ceccarelli et al., 2000; Schöier et al., 2002; Coutens et al., 2013). The transition between the two regions occurs at 100 K, the sublimation temperature of the icy grain mantles. In the hot corino, several abundant COMs have been detected (Cazaux et al. 2003).
3 The data set
3.1 Observations
We used the data from The IRAS16293 Millimeter And Submillimeter Spectral Survey (TIMASSS: http://www-laog.obs.ujf-grenoble.fr/heberges/timasss/; Caux et al. 2011). Briefly, the survey covers the 80-280 and 328-366 GHz frequency intervals and it has been obtained at the IRAM-30m and JCMT-15m telescopes. The data are publicly available on the TIMASSS web site. Details on the data reduction and calibration can be found in Caux et al. (2011). We recall here the major features, relevant for this work. The telescope beam depends on the frequency and varies between 9 and 30. The spectral resolution varies between 0.3 and 1.25 MHz, corresponding to velocity resolutions between 0.51 and 2.25 km/s. The achieved rms is between 4 and 17 mK. Note that it is given in a 1.5 km/s bin for observations taken with a velocity resolution 1.5km/s, and in the resolution bin for larger velocity resolutions. The observations are centered on IRAS16293B at (2000.0) = 16h 32m 22s.6, (2000.0)= -24 28 33 Note that the A and B components are both inside the beam of observations at all frequencies.
3.2 Species identification
We searched for lines of all the oxygen and nitrogen bearing COMs already detected in the ISM (as reported in the CDMS database: http://www.astro.uni-koeln.de/cdms/molecules), they are listed in Tab. 1. At this scope, we used the list of identified lines in Caux et al. (2011) and double-checked for possible blending and misidentifications. This was obtained via the publicly available package CASSIS (http://cassis.irap.omp.eu), and the CDMS (Müller et al., 2005) and JPL (Pickett et al., 1998) databases. References to the specific articles on the laboratory data of the detected species are Guarnieri & Huckauf (2003); Kleiner et al. (1996); Neustock et al. (1990); Maeda et al. (2008). In case of doubt on the line identification or in case of presence of important residual baseline effects, we did not consider the relevant line. Except for those few () cases, we used the line parameters (flux, linewidth, rest velocity) in Caux et al. (2011). With these tight criteria, we secured the detection of six COMs: ketene (H2CCO: 13 lines), acetaldehyde (CH3CHO: 130 lines), formamide (NH2CHO: 17 lines), dimethyl ether (CH3OCH3: 65 lines), methyl formate (HCOOCH3: 121 lines) and methyl cyanide (CH3CN: 38 lines). For comparison, Cazaux et al. (2003) detected 5 CH3CHO lines, 7 CH3OCH3 lines, and 20 CH3CHO lines. We do not confirm the Cazaux et al. (2003) detection of acetic acid (CH3COOH) and formic acid (HCOOH), where these authors reported the possible detection of 1 and 2 lines respectively, none of them in the TIMASSS observed frequency range.
4 Analysis and results
4.1 Model description
Our goal is to estimate the abundance of the detected COMs across the envelope of IRAS16293, with particular emphasis on the cold envelope (see Introduction). For that, we used the Spectral Line Energy Distribution (SLED) of the detected COMs, and the package GRAPES (GRenoble Analysis of Protostellar Envelope Spectra), based on the code described in Ceccarelli et al. (1996, 2003). Briefly, GRAPES (i) computes the species SLED from a spherical infalling envelope with a given structure; (ii) it solves locally the level population statistical equilibrium equations in the beta escape formalism, consistently computing the line optical depth by integrating it over the solid angle at each point of the envelope; (iii) the predicted line flux is then integrated over the whole envelope after convolution with the telescope beam. The abundance of the considered species is assumed to vary as a function of the radius with a power law in the cold part of the envelope and to jump to a new abundance in the warm part. The transition between the two regions is set by the dust temperature, to simulate the sublimation of the ice mantles, and occurs at . It holds:
| (1) |
GRAPES allows us to run large grids of models varying the four parameters, , , and , and to find the best fit to the observed fluxes.
This code has disadvantages and advantages with respect to other codes. The first and obvious disadvantage is that the spherical assumption just holds for the large scale (: see Crimier et al. 2010) envelope of IRAS16293. At small scales, the presence of the binary system (§2) makes the spherical symmetry assumption wrong. Consequently, the GRAPES code is, by definition, unable to correctly estimate the emission from the two sources I16293-A and I16293-B separately. The derived inner envelope abundance, therefore, is likely a rough indication of the real abundance of the species towards I16293-A and I16293-B. The other disavantage of GRAPES is that it relies on the analysis of the SLED and not on the line profiles. Since the majority of the TIMASSS spectra have a relatively poor spectral resolution ( km/s), this is appropriate in this case. The great advantage of GRAPES, and the reason why we used it here, is that it is very fast, so that a large multi-parameter space can be explored.
In the specific case of this work, we used the physical structure of the envelope of IRAS16293 as derived by Crimier et al. (2010), which is based on single dish and interferometric continuum observations. Collisional coefficients are only available for methyl cyanide, and not for the other five detected COMs. Since methyl cyanide is a top symmetric molecule, it represents a “particular case” with respect to the other detected COMs, so that, in order to have an homogeneous dataset, we decided to analyse here only the latter molecules, and assume LTE for their level populations. The analysis of the CH3CN molecule will be the focus of a future article. Since the density of the IRAS16293 envelope is relatively high (e.g. cm-3 at a radius of 870 AU, equivalent to in diameter), we expect that the abundances derived in the LTE approximation are only moderately underestimated.
4.2 Results
For each of the five analysed COMs, we run a large grid of models with the following strategy. We explored the – parameter space (in general we obtained grids of more than 20x20) for equal to -1, 0 and +1, and varied from 10 to 120 K by steps of 10 K. Note that we first started with a 3 or 4 orders of magnitude range in and respectively to find a first approximate solution and then we fine-tuned the grid around it. In total, therefore, we run more than models for each species. The results of the best fit procedure are reported in Tab. 1. Figure 1 shows the example of acetaldehyde. Note that the lines are predicted to be optically thin by the best fit models of all five molecules.
| Species | Formula | Xin | Xout | DF | Radius | Size | ||
|---|---|---|---|---|---|---|---|---|
| [] | [] | [K] | [AU] | [] | ||||
| Detected COMs | ||||||||
| Ketene | H2CCO | 0.01 | 0.3 | 20 | 10 | 0.63 | 1800 | 31 |
| Acetaldehyde | CH3CHO | 0.3 | 10.2 | 70 | 127 | 0.79 | 127 | 2 |
| Formamide | NH2CHO | 0.06 | 0.03 | 80 | 14 | 0.69 | 100 | 2 |
| Dimethyl ether | CH3OCH3 | 41 | 21 | 50 | 62 | 0.72 | 240 | 4 |
| Methyl formate | HCOOCH3 | 0.9 | 0.3 | 50 | 118 | 0.78 | 240 | 4 |
| Undetected COMs | ||||||||
| Ethylene oxide | c-C2H4O | |||||||
| Vinyl alcohol | H2CCHOH | |||||||
| Ethanol | C2H5OH | |||||||
| Formic acid | HCOOH | |||||||
| Propynal | HC2CHO | |||||||
| Cyclopropenone | c-H2C3O | |||||||
| Acrolein | C2H3CHO | |||||||
| Acetone | CH3COCH3 | |||||||
| Propanal | CH3CH2CHO | |||||||
| Glycolaldehyde | CH2(OH)CHO | |||||||
| Ethyl methyl ether | C2H5OCH3 | |||||||
| Ethyleneglycol | (CH2OH)2 | |||||||
| Ethyl formate | C2H5OCHO | |||||||
| Methylamine | CH3NH2 | |||||||
| Methylisocyanide | CH3NC | |||||||
| Etheneimine | H2CCNH | |||||||
| Cyanoacetylene+ | HC3NH+ | |||||||
| Vinyl cyanide | C2H3CN | |||||||
| Ethyl cyanide | C2H5CN | |||||||
| Aminoacetonitrile | H2NCH2CN | |||||||
| Cyanopropyne | CH3C3N | |||||||
| n-Propyl cyanide | n-C3H7CN | |||||||
| Cyanopentadiyne | CH3C5N | |||||||
-
•
Note: The first two columns report the species name and formula. Third, fourth and fifth columns report the values of the inner and outer abundances and (with respect to H2), and . Columns 6 and 7 report the degrees of freedom and the minimum reduced . The last two columns report the radius and the sizes (diameter) at which the abundance jump occurs. The error bars are at 2 level confidence. The top half table lists the detected species, the bottom half table the upper limit on the abundances of undetected COMs (see text).


First, we did not find a significant difference in the best fit value if is -1, 0 or +1, in any of the five COMs, so that Tab.1 reports the values obtained with =0 only. Second, the is different in the five COMs: it is K for ketene, K for acetaldehyde and formamide, and K for dimethyl ether and methyl formate. Third, the abundance in the outer envelope ranges from to : acetaldehyde and dimethyl ether have the largest values, formamide the lowest, and ketene and methyl formate intermediate values. Fourth, the abundance jumps by about a factor 100 in all COMs except ketene, which remains practically constant (when the errors are considered). Note that we find a warm envelope abundance of acetaldehyde, dimethyl ether and methyl formate about 10 times smaller than those quoted by Cazaux et al. (2003). The difference mostly derives from a combination of different (assumed 100 K in Cazaux et al.(2003)), which implies different emitting sizes, and a different H2 column density. As also emphasised by Cazaux et al. (2003), their hot corino sizes and H2 column density were best guessed and, consequently, uncertain, whereas in the present work they are self-consistently estimated from the molecular lines.
Finally, for the undetected species we derived the upper limits to the abundance in the outer (assuming N(H2)=8 cm-2, diameter=, T=20 K) and inner (assuming N(H2)=3 cm-2, diameter=, T=60 K) envelope listed in Tab. 1.
5 Discussion
The analysis of outer and inner abundances of the five detected COMs leads to three major considerations and results.
1. COMs in the cold envelope:
The first important result of this analysis is the presence of COMs in
the cold part of the envelope, with an abundance approximately
constant. This is the first time that we have unambiguous evidence
that also the cold outer envelope of (low mass) protostars can host
COMs.
Bacmann et al. (2012) reported the detection of acetaldehyde, dimethyl ether and
methyl formate with abundances around (with an uncertainty
of about one order of magnitude) towards a cold ( K)
pre-stellar core. Öberg et al. (2010); Cernicharo et al. (2012) reported the detection of the same
molecules in B1-b, a low mass protostar where the temperature of the
emitting gas is estimated 12–15 K (but no specific analysis to
separate possible emission from warm gas has been carried out in this
case), with similar abundances. In the cold envelope of IRAS16293,
these COMs seem to be slightly more abundant, with abundances around
, possibly because the gas is slightly warmer.
If the dust surface chemistry dominated the formation of COMs in the
outer envelope, the COM abundance would increase with increasing dust
temperature, namely decreasing radius in the cold envelope.
However, our analysis does not show a definitively better
for the solution corresponding to =-1, so that it cannot
support this hypothesis. These new measurements add evidence that
COMs, at least the ones studied here, are possibly formed also in cold
conditions in addition to the warm grain surfaces, as predicted by
current models (see Introduction).
2. Comparison with other objects:
Additional information on the formation (and destruction) routes of
the detected COMs can be gained by the comparison of the COM
abundances in galactic objects with different conditions (temperature,
density and history) and Solar System comets. We consider here the
abundances normalised to that of methyl formate, a molecule which has
been detected in all objects that we want to compare. Figure
2 graphically shows this comparison.
Ketene seems to be the most sensitive species in distinguishing two
groups of objects: “cold” objects, formed by the cold and Galactic
Center clouds, and the outer envelope of IRAS16293, and “warm”
objects, constituted by the IRAS16293 hot corino (the only hot corino
where the five COMs of this study have been detected so far) and the
massive hot cores. In the first group, ketene has an abundance larger
than 0.1 with respect to methyl formate. In the second group,
the relative abundance is lower than 0.1.
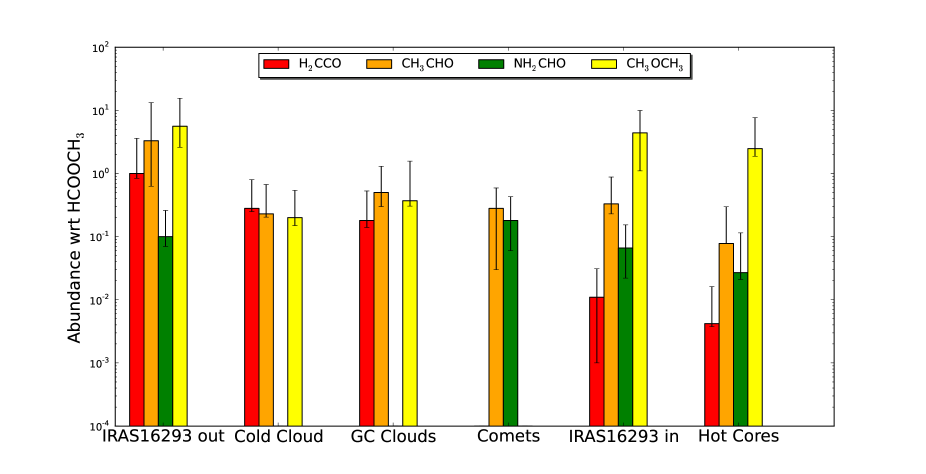
Finally, comets are definitively different from the hot cores, which are often compared with in the literature (see also the discussion in Caselli & Ceccarelli 2012).
3. Correlations vs methyl formate.
Figure 3 shows the abundance of dimethyl ether,
formamide, acetaldehyde and ketene as a function of the abundance
of methyl formate in different ISM sources.


The linear correlation between the methyl formate and dimethyl ether is striking (Pearson correlation coefficient equal to 0.95 and power law index equal to 1.0). It covers almost five orders of magnitude, so that it persists even considering the dispersion of the measurements and the uncertainty linked to the determination of the absolute abundances mentioned above. This linear correlation, previously observed over a smaller range (e.g.Brouillet et al. (2013)), gives us an important and remarkable message: probably the precursor of methyl formate and dimethyl ether is either the same (Brouillet et al., 2013) or one of the two is the precursor of the other, an hypothesis that has not been invoked in the literature so far. We can not rule out other explanations, but they seem less likely at this stage. The bottom line is that such a link between these two species must be the same in cold and warm gas. This does not favour a formation mechanism of these two COMs on the grain surfaces for, according to the existing models, the mechanism does not work at low temperatures. Current chemical networks (e.g. KIDA at http://kida.obs.u-bordeaux1.fr and UMIST at http://www.udfa.net) do not report reactions linking the two species. Also the recent article by Vasyunin & Herbst (2013), which proposes new reactions for explaining the Bacmann et al. (2012) and Cernicharo et al. (2012) observations, does not suggest a link between methyl formate and dimethyl ether. We suggest here that those networks are missing this important piece.
Similar analysis and conclusion (Pearson correlation coefficient equal to 0.92 and power law index equal to 0.8) apply to the methyl formate and formamide. On the contrary, the correlation between methyl formate and acetaldehyde or ketene is poorer (Pearson correlation coefficient equal to 0.66 and 0.62, power law index equal to 0.5 and 0.4, respectively).
6 Conclusions
We searched for all oxygen and nitrogen bearing COMs observed in the
ISM, towards the envelope of IRAS16293. We detected six COMs: methyl
cyanide, ketene, acetaldehyde, formamide, dimethyl ether, and methyl
formate. We report the analysis of the last five species. A
specific analysis of methyl cyanide emission will be presented in a
subsequent paper. For each species, several lines covering a large
upper level energy range (up to 150 K) are detected. This allows us to
disentangle the emission originating in the cold and warm envelope,
respectively, and where the transition between the two occurs. The
main results of this study can be summarised in three points:
1- The five analysed COMs are all present in the cold envelope of
IRAS16293. Acetaldehyde and dimethyl ether have the largest
abundances, , slightly larger than the values found in
other cold objects (Bacmann et al. 2012; Cernicharo et
al. 2012). These new measurements add support to the idea that a
relatively efficient formation mechanism for these COMs must exist in
the cold gas phase.
2- When considering the abundance of the five analysed COMs,
the ketene abundance relative to methyl formate is different in cold and
hot objects. Besides, comets are different from the hot
cores.
3- There is a remarkable correlation between the abundance of
methyl formate and that of dimethyl ether and formamide. The
correlation spans over five orders of magnitude. This may
suggest that both dimethyl ether and formamide have
a progenitor common with methyl formate, and that the mechanism
of their formation is gas phase reactions. We suggest that
the current chemical networks still miss important pieces.
References
- Bacmann et al. (2012) Bacmann, A., Taquet, V., Faure, A., Kahane, C., & Ceccarelli, C. 2012, A&A, 541, L12
- Ball et al. (1971) Ball, J. A., Gottlieb, C. A., Lilley, A. E., & Radford, H. E. 1971, IAU Circ., 2350, 1
- Blake et al. (1987) Blake, G. A., Sutton, E. C., Masson, C. R., & Phillips, T. G. 1987, ApJ, 315, 621
- Brouillet et al. (2013) Brouillet, N., Despois, D., Baudry, A., et al. 2013, A&A, 550, A46
- Brown et al. (1975) Brown, R. D., Crofts, J. G., Godfrey, P. D., et al. 1975, ApJ, 197, L29
- Caselli et al. (1993) Caselli, P., Hasegawa, T. I., & Herbst, E. 1993, ApJ, 408, 548
- Caux et al. (2011) Caux, E., Kahane, C., Castets, A., et al. 2011, A&A, 532, A23
- Cazaux et al. (2003) Cazaux, S., Tielens, A. G. G. M., Ceccarelli, C., et al. 2003, ApJ, 593, L51
- Ceccarelli et al. (2000) Ceccarelli, C., Castets, A., Caux, E., et al. 2000, A&A, 355, 1129
- Ceccarelli et al. (1996) Ceccarelli, C., Hollenbach, D. J., & Tielens, A. G. G. M. 1996, ApJ, 471, 400
- Ceccarelli et al. (2003) Ceccarelli, C., Maret, S., Tielens, A. G. G. M., Castets, A., & Caux, E. 2003, A&A, 410, 587
- Cernicharo et al. (2012) Cernicharo, J., Marcelino, N., Roueff, E., et al. 2012, ApJ, 759, L43
- Charnley et al. (1992) Charnley, S. B., Tielens, A. G. G. M., & Millar, T. J. 1992, ApJ, 399, L71
- Coutens et al. (2013) Coutens, A., Vastel, C., Cabrit, S., et al. 2013, A&A, 560, A39
- Crimier et al. (2010) Crimier, N., Ceccarelli, C., Maret, S., et al. 2010, A&A, 519, A65
- Garrod et al. (2009) Garrod, R. T., Vasyunin, A. I., Semenov, D. A., Wiebe, D. S., & Henning, T. 2009, ApJ, 700, L43
- Geppert et al. (2007) Geppert, W. D., Vigren, E., Hamberg, M., et al. 2007, in European Planetary Science Congress 2007, 613
- Goumans et al. (2008) Goumans, T. P. M., Catlow, C. R. A., & Brown, W. A. 2008, The Journal of Chemical Physics, 128,
- Guarnieri & Huckauf (2003) Guarnieri, A., & Huckauf, A. 2003, Naturforsch, 58, 275
- Herbst & van Dishoeck (2009) Herbst, E., & van Dishoeck, E. F. 2009, ARA&A, 47, 427
- Horn et al. (2004) Horn, A., Møllendal, H., Sekiguchi, O., et al. 2004, ApJ, 611, 605
- Kleiner et al. (1996) Kleiner, I., Lovas, F. J., & Godefroid, M. 1996, Journal of Physical and Chemical Reference Data, 25, 1113
- Loinard et al. (2008) Loinard, L., Torres, R. M., Mioduszewski, A. J., & Rodríguez, L. F. 2008, ApJ, 675, L29
- Loinard et al. (2013) Loinard, L., Zapata, L. A., Rodríguez, L. F., et al. 2013, MNRAS, 430, L10
- Maeda et al. (2008) Maeda, A., De Lucia, F. C., & Herbst, E. 2008, Journal of Molecular Spectroscopy, 251, 293
- Marenich & Boggs (2003) Marenich, A., & Boggs, J. 2003, The Journal of Chemical Physics, 107, 2343
- Millar et al. (1991) Millar, T. J., Herbst, E., & Charnley, S. B. 1991, ApJ, 369, 147
- Mizuno et al. (1990) Mizuno, A., Fukui, Y., Iwata, T., Nozawa, S., & Takano, T. 1990, ApJ, 356, 184
- Müller et al. (2005) Müller, H. S. P., Schlöder, F., Stutzki, J., & Winnewisser, G. 2005, Journal of Molecular Structure, 742, 215
- Mundy et al. (1992) Mundy, L. G., Wootten, A., Wilking, B. A., Blake, G. A., & Sargent, A. I. 1992, ApJ, 385, 306
- Neustock et al. (1990) Neustock, W., Guarnieri, A., & G, D. 1990, Naturforsch, 45, 702
- Öberg et al. (2010) Öberg, K. I., Bottinelli, S., Jørgensen, J. K., & van Dishoeck, E. F. 2010, ApJ, 716, 825
- Pickett et al. (1998) Pickett, H. M., Poynter, R. L., Cohen, E. A., et al. 1998, J. Quant. Spec. Radiat. Transf., 60, 883
- Pineda et al. (2012) Pineda, J. E., Maury, A. J., Fuller, G. A., et al. 2012, A&A, 544, L7
- Pirim et al. (2010) Pirim, C., Krim, L., & Laffon, C. 2010, The Journal of Chemical Physics, 114, 3320
- Requena-Torres et al. (2007) Requena-Torres, M. A., Martin-Pintado, J., Martin, S., & Amo-Baladron, A. 2007, ATNF Proposal, 939
- Rubin et al. (1971) Rubin, R. H., Swenson, Jr., G. W., Benson, R. C., Tigelaar, H. L., & Flygare, W. H. 1971, ApJ, 169, L39
- Schöier et al. (2002) Schöier, F. L., Jørgensen, J. K., van Dishoeck, E. F., & Blake, G. A. 2002, A&A, 390, 1001
- Solomon et al. (1971) Solomon, P. M., Jefferts, K. B., Penzias, A. A., & Wilson, R. W. 1971, ApJ, 168, L107
- Taquet et al. (2012) Taquet, V., Ceccarelli, C., & Kahane, C. 2012, A&A, 538, A42
- Tielens & Hagen (1982) Tielens, A. G. G. M., & Hagen, W. 1982, A&A, 114, 245
- Watanabe & Kouchi (2002) Watanabe, N., & Kouchi, A. 2002, ApJ, 571, L173
- Woon (2002) Woon, D. E. 2002, ApJ, 571, L177
- Wootten (1989) Wootten, A. 1989, ApJ, 337, 858
- Zapata et al. (2013) Zapata, L. A., Loinard, L., Rodríguez, L. F., et al. 2013, ApJ, 764, L14