Efficacy of high frequency switched-mode stimulation in activating Purkinje cells
Abstract
This paper investigates the efficacy of high frequency switched-mode neural stimulation. Instead of using a constant stimulation amplitude, the stimulus is switched on and off repeatedly with a high frequency (up to 100kHz) duty cycled signal. By means of tissue modeling that includes the dynamic properties of both the tissue material as well as the axon membrane, it is first shown that switched-mode stimulation depolarizes the cell membrane in a similar way as classical constant amplitude stimulation.
These findings are subsequently verified using in vitro experiments in which the response of a Purkinje cell is measured due to a stimulation signal in the molecular layer of the cerebellum of a mouse. For this purpose a stimulator circuit is developed that is able to produce a monophasic high frequency switched-mode stimulation signal.
The results confirm the modeling by showing that switched-mode stimulation is able to induce similar responses in the Purkinje cell as classical stimulation using a constant current source. This conclusion opens up possibilities for novel stimulation designs that can improve the performance of the stimulator circuitry. Care has to be taken to avoid losses in the system due to the higher operating frequency.
1 Introduction
Traditional functional electrical stimulation typically uses a current source with constant amplitude and pulsewidth to recruit neurons in the target area. Early stimulator designs consisted of relatively simple programmable current source implementations. Over the years numerous modifications have been proposed to improve important aspects such as power efficiency, safety and size. Most stimulators however, still use constant current at the output.
Several implementations have investigated the use of alternative stimulation waveforms in an attempt to improve the performance. Some implementations focus on improving the efficiency of the activation mechanism in the neural tissue [10], [17]. Others focus on increasing the performance of the stimulator itself, of which several studies have proposed the use of high frequency stimulation waveforms. In [7] a \SI250kHz pulsed waveform is used to decrease the size of the coupling capacitors. Two of these waveforms are subsequently added in antiphase to reconstruct a conventional stimulation waveform. In [1] a \SI10MHz forward-buck and reverse-boost converter is used to increase the power efficiency of the stimulator by using inductive energy recycling. External capacitors are used to low-pass filter the switched signal and reconstruct a conventional waveform.
In [14] and [15] it was hypothesized that it is possible to apply a high-frequency signal to the electrodes directly: it will be filtered by the tissue- and membrane properties. This gives rise to a new class of stimulator circuits that can benefit from the power and size advantages mentioned above, while the reconstruction step can be eliminated. In this paper the electrophysiological feasibility of such circuits is investigated both theoretically as well as experimentally by determining whether a high frequency stimulation signal can indeed induce neural recruitment in a similar fashion as during classical constant current stimulation.
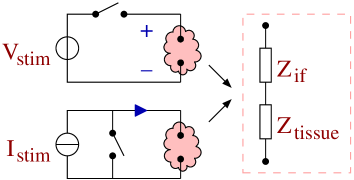
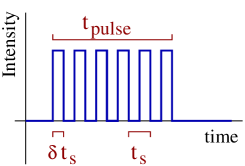
The high frequency stimulation pattern that is used to stimulate the tissue is assumed to be square shaped. The schematic circuit diagrams of both voltage and current based stimulation are depicted in Figure 1a. A fixed value for or is used, while the stimulation intensity is controlled by driving the switch with a Pulse Width Modulated (PWM) signal; this is referred to as switched-mode operation. In Figure 1b a sketch is given of the monophasic stimulation pulse resulting from either of the circuits. The switch is operated with duty cycle and switching period . This results in an average stimulation intensity or for voltage and current based stimulation respectively.
It is important to note that in this work the term ’high frequency’ refers to the frequency of the pulses that make up a single stimulation waveform. It does not refer to the repetition rate at which the stimulation cycles are repeated. Furthermore, this work investigates the electro-physiological feasibility of switched-mode stimulator circuits; it does not aim to design a stimulation waveform that improves the activation mechanism itself with respect to classical constant current stimulation.
The organization of this paper is as follows. In Section 2 the tissue and the cell membrane are modeled with frequency dependent parameters. These models are used to analyse the response of the membrane voltage to the high frequency stimulation signal. In Section 3 the experimental setup is discussed, consisting of a prototype high frequency stimulator in combination with an in vitro patch clamp recording setup. Finally in Section 4 and 5 the measurement results are presented and discussed.
2 Theory
A high frequency (switched) signal that is injected via the electrodes will be filtered by the tissue. First the tissue material properties influence the transient voltage over and current through the tissue. Subsequently the electric field in the tissue and the properties of the cell membrane will determine the transient shape of the membrane voltage, which is ultimately responsible for the actual activation or inhibition of the neurons. These two processes will be discussed separately.
2.1 Tissue material properties
In Figure 1a the tissue is modeled with an interface impedance and a tissue impedance . For current based stimulation is independent of . For voltage based stimulation with the voltage over . In this study non polarizable Ag/AgCl electrodes will be used for which and therefore [8].
The tissue voltage and current are related to each other via the resistive and reactive properties of the tissue. In [4] the capacitive and resistive properties of the tissue are measured for a wide range of frequencies and human tissue types. The resistivity and permittivity of grey matter as a function of the frequency are plotted in Figure 2a. This plot has been obtained by calculating the relative permittivity and conductivity based on the equation for the relative complex permittivity from [4]:
| (1) | |||||
| (2) |
Here is the permittivity of free space. As can be seen neural tissue shows strong dispersion for . To find the relation between the tissue voltage and current the values of and need to be converted to impedance. Given the impedance is:
| (3) |
Here is a constant that sets the absolute value of the impedance, which depends among other things on the electrode geometry. It is possible to normalize the impedance, such that by using:
| (4) |
Here Equations 1 and 2 are substituted for and is the conductance of the tissue at . From this it follows that to normalize the transfer such that . The Bode plots of this normalized impedance is given in Figure 2b.
This plot can now be used to obtain the shape for and and, if the impedance of the tissue is known for a certain frequency, it can be scaled to obtain the correct absolute values.
As an example, a \SI100μA, \SI200kHz, switched current signal is supplied to an electrode system that has an impedance of at \SI1kHz. The tissue voltage is now found by solving , which is plotted in Figure 3a. Indeed the tissue voltage is filtered and in the next section it will be seen that this is important for determining the activation of the neurons.


2.2 Tissue membrane properties
After the transient intensities of the tissue voltage and current have been determined by the stimulation protocol and the tissue impedance, it can be investigated how these quantities influence the neurons. Analogous to [16] the activation of the neurons is considered in the axons, for which the membrane voltage is determined using the cable equations. For these equations first the potential in the tissue as a function of the distance from the electrode is needed. When the electrode is considered to behave as a point source at the origin, the tissue potential has a dependence assuming quasi-static conditions [16]: , where is the distance from the electrode.
In [2] the influence on the tissue potential due to high frequency components in the stimulation signal was analyzed. It was found that the propagation effect was neglegible and that only the complex permittivity as discussed in the previous section was significant. To incorporate these properties, the potential can be determined in the frequency domain by substituting with the complex permittivity, leading to:
| (5) |
By transforming this potential back to the time domain, the transient of the potential at any distance from the point source, is obtained. Since the current is divided by the complex permittivity and since there are no propagation effects, the transient shape of the potential is proportional to as obtained in Figure 3: it is just scaled as a function of the distance.
Next can be used as an input for an axon model to determine the response of the membrane voltage. The electrical parameters that are used for the axon model are summarized in Table I [16] [13]. In the following section the response of both myelinated and unmyelinated axons is considered. In both sections the fiber diameter is chosen to be small (), based on the axon diameter of unmyelinated Purkinje cells, which will be used later in the in vitro experiments [12].
| Symbol | Description | Value |
|---|---|---|
| Axoplasm resistivity | \SI54.7Ω⋅cm | |
| Extracellular resistivity | \SI0.3kΩ⋅cm | |
| Nodal membrane capacitance/unit area | \SI2.5μF/cm^2 | |
| Nodal gap width | \SI1.5\microm | |
| Ratio of internode spacing to fiber diameter | 100 | |
| Ratio of axon diameter to fiber diameter | 0.6 | |
| Sodium conductance/unit area | \SI120mS/cm^2 | |
| Sodium reversal voltage | \SI115mV | |
| Potassium conductance/unit area | \SI36mS/cm^2 | |
| Potassium reversal voltage | \SI-12mV | |
| Leakage conductance/unit area | \SI0.3mS/cm^2 | |
| Leakage voltage | \SI10.61mV |
2.2.1 Myelinated axons
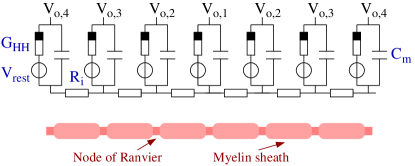
For a myelinated axon the model in Figure 4a is used. The myelinated parts of the axon do not have ionic channels and are therefore modeled using the intracellular resistance , in which represents the internode spacing and the axon diameter. At the nodes of Ranvier the membrane is characterized by the membrane capacitance , the rest potential and the nonlinear conductance . The current through this conductance is given by the Hodgkin Huxley equations [6].
The membrane voltage at node can be found by solving the following equation that follows directly from Kirchhoff’s laws [16]:
| (6) |
Here is the voltage due to the electric field at node that follows from Equation 5 and is the current density given by the Hodgkin Huxley equations:
| (7a) | ||||
| (7b) | ||||
| (7c) | ||||
| (7d) | ||||
The conducances , and as well as the voltage , and are constants, while and depend on the membrane voltage via:
| (8a) | ||||||||
| (8b) | ||||||||
The response of the membrane potential due to the high frequency electric field can now be found by solving the differential equations above. This is done in Matlab by using the classical Runge-Kutta method (RK4). A step size of \SI1μs is chosen during the high frequency stimulation interval, while after the stimulation pulse a step size of \SI10μs is used.
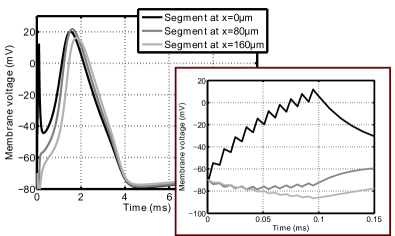
The switched-voltage stimulation scheme of Figure 3b was chosen first with , , , and . An axon with the center node at a distance was considered. For this axon , , the nodes of Ranvier are spaced \SI80μm apart and a total of 9 nodes were simulated.
The resulting membrane voltage is depicted in Figure 5a. First, the effect of the switched-mode stimulation can clearly be seen in the staircase transient shape of the membrane voltage. Furthermore it can be seen that the increase in the membrane voltage also leads to an action potential in the axon. This shows that according to the models, switched-mode stimulation can induce activation in the axons. Finally, this action potential is able to travel along the axon, as is shown by the response of the other nodes of Ranvier in the same Figure. A very similar result can be obtained when using switched-current stimulation.
In Figure 5b the effect of the duty cycle is shown. The dark line shows the response for and the light line is the response for . The latter setting is not able to induce an action potential anymore, which shows that is an effective way of controlling the stimulation intensity. The response is compared with a classical constant voltage stimulation with and is indicated with the dashed lines. Indeed an equivalent response is found.
2.2.2 Unmyelinated axons
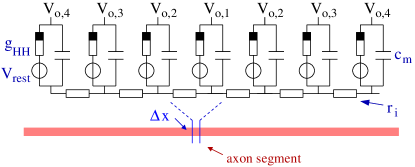
For unmyelinated axons the model as depicted in Figure 4b is used. The axon is now divided into segments of length with each segment containing an intracellular resistance per unit length: , the capacitance per unit area , the resting potential and the ionic conductance per unit area . Again a differential equation can be found that solves the membrane voltage [9]:
| (9) |
An unmyelinated axon is considered at a distance . The axon is divided into 501 segments of and has an outer diameter . For unmyelinated axons a higher stimulation intensity is needed in order to get effective stimulation. A voltage-mode stimulation signal with and is used.
The same solving strategy is chosen to solve Equation 9. The membrane potential is depicted in Figure 5c and looks very similar to the myelinated response. Also in this case the action potential is able to travel along the axon as shown by the response of segments that are further down the axon. Note that the propagation speed is much lower than in the myelinated case, which is a well known property.
Figure 5d shows the effect of varying : frequencies of \SI10kHz, \SI50kHz and \SI100kHz are used. As can be seen both the membrane voltage after the stimulation pulse and the response of the tissue do not depend on .
The simulation results show that switched-mode stimulation is able to induce the same sort of activation as classical stimulation in both myelinated as well as unmyelinated axons. The duty cycle is used to control the stimulation intensity in exactly the same way as the amplitude for classical stimulation. Note that compared to the tissue material properties the membrane time constant is much larger and is therefore dominant in the filtering process.
3 Methods
In order to verify whether the proposed high frequency stimulation scheme is able to induce neuronal recruitment by using the tissue filtering properties, an in vitro experiment is performed.
3.1 Recording protocol
The in vitro recordings were performed in brain slices from the vermal cerebellum of C57Bl/6 inbred mice using a method similar to [5]. In short, mice were decapitated under isoflurance anesthesia and subsequently the cerebellum was removed and parasagittaly sliced to preserve the Purkinje cell dendritic trees (\SI250μm thickness) using a Leica vibratome (VT1000S). Slices were kept for at least 1 hour in Artificial CerebroSpinal Fluid (ACSF) containing the following (in \SImM): 124 NaCl, 5 KCl, 1.25 Na2HPO4, 2MgSO4, 2CaCl2, 26 NaHCO and 20D-glucose, bubbled with 95% O2 and 5% CO2 at 34∘C. \SI0.1mM picrotoxin was added to the ACSF to block the inhibitory synaptic transmission from the molecular layer interneurons. This allows recordings of post-synaptic responses in the Purkinje cells due to stimulation of the granular cell axons.
Experiments were carried out under a constant flow of oxygenated ACSF at a rate of approximately \SI2.0ml/min at 321∘C. The Purkinje cells were visualized using an upright microscope (Axioskop 2 FS plus; Carl Zeiss) equipped with a 40x water-immersion objective.
The stimulus electrode is an Ag-AgCl electrode in a patchpipette pulled from borosilicate glass (outer diameter \SI1.65mm and inner diameter \SI1.1mm) and is filled with ACSF. This electrode has an impedance and is stimulated using a monophasic cathodic stimulation protocol. The electrode is placed in the extracellular space of the molecular layer in the cerebellum lateral to where the dendritic tree of the Purkinje cells is assumed to be. We aimed to evoke neurotransmitter release from granule cell axons only and to avoid direct depolarization of the Purkinje cell dendritic tree. Although we cannot exclude that we completely avoided this latter confounding factor, this commonly used experimental approach is sufficient to compare the activation mechanisms of the classical and high frequency stimulation waveforms.
The response to the stimulus is recorded by whole cell patch-clamping Purkinje cells in the voltage-clamp mode using electrodes (same pipettes as the stimulus electrodes) filled with (in mM): 120 K-Gluconate, 9 KCl, 10 KOH, 3.48 MgCl2, 4 NaCl, 10 HEPES, 4 Na2ATP, 0.4 Na3GTP and 17.5 sucrose, pH 7.25. The membrane voltage is kept at \SI-65mV with a holding current smaller than \SI-500pA (recorded using an EPC 10 double patch clamp amplifier and Pulse 8.80 software, HEKA electronics).
Two different kinds of stimulation are performed and the responses of the Purkinje cell are compared to each other. First of all classical stimulation is applied using a monophasic constant current source. For this purpose a Cygnus Technology SIU90 isolated current source is used. The amplitude of the current is varied to see the effect of stimulation intensity on the response of the Purkinje cell. The stimulation protocol consisted of two consecutive stimulation pulses with a duration of each and an interpulse interval of \SI25ms.
Second, switched-mode stimulation is performed, also using two pulses with and an interpulse interval of \SI25ms. If the Purkinje cell shows a similar response for varying during switched mode as it does for varying amplitude during classical stimulation, it can be concluded that switched-mode stimulation is indeed able to mimic classical stimulation.
3.2 Stimulator design
The circuit used for switched-mode stimulation is depicted in Figure 6. As can be seen a switched-voltage stimulation scheme is applied: transistor connects the electrode to the stimulation voltage , or and is switched with a PWM signal of which the duty cycle determines the stimulation intensity.
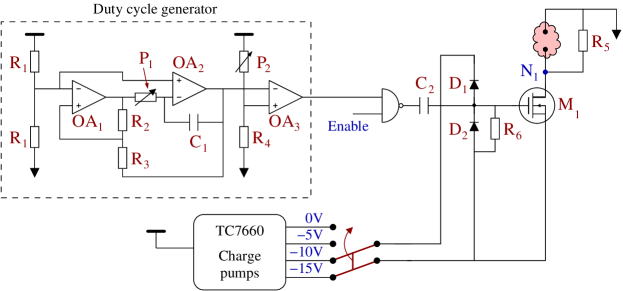
The PWM signal is generated using the duty cycle generator circuit. Opamps and generate a triangular signal of which the frequency can be tuned using potentiometer . Subsequently the duty cycle is set using potentiometer at the input of comparator .
The circuit is controlled using an Arduino Uno microcontroller platform, which also supplies the circuit with a +5V supply voltage. The total circuit is isolated from ground by connecting the arduino using the USB of a laptop that is operated from its battery. Capacitor and clamps and are used to level convert the 0-5V logic signal from the duty cycle generator to a to signal to drive the gate of . Resistor is used to discharge the gate of to in steady state.
Because of the high electrode impedance, any parasitic capacitance that is connected to node will prevent the electrode voltage to discharge during the interval of a switching period. This will influence the average voltage over the tissue and the relation between and the stimulation intensity. To prevent this effect, resistor is placed in parallel with the tissue, which allows the parasitic capacitance to discharge quickly. This resistor does consume power and reduces the power efficiency of the system dramatically. However, the power efficiency is not a design objective for this specific experiment: the only goal is to show the effectiveness of the high frequency stimulation. Without the stimulation would still be effective, but the electrode voltage would not have the desired switched-mode shape. The whole circuit is implemented on a Printed Circuit Board (PCB).
4 Results
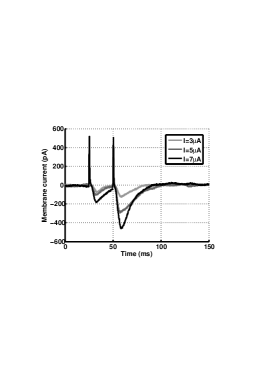
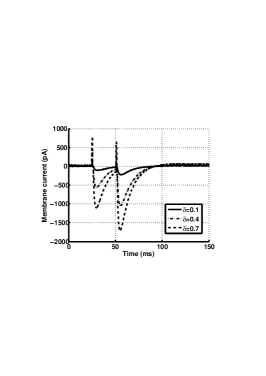
In Figure 7a the response of the Purkinje cell is shown for classical constant current stimulation for three different stimulus intensities. First there is a big positive spike corresponding to the stimulation artifact. After a small delay an excitatory postsynaptic current (EPSC) is clearly visible; during this interval the membrane current is decreased due to the opening of the postsynaptic channels of the cell.
After \SI25ms the second stimulus arrives and a second EPSC is generated. This EPSC is much bigger due to a process called paired pulse facilitation (PPF): due to the first depolarization the Ca2+ concentration in the activated axon terminals is higher when the second pulse arrives, leading to an increased release of neurotransmitter. From the same figure it is also clear that the EPSC becomes stronger for increasing stimulation amplitude.
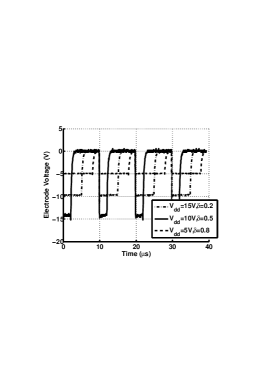
In Figure 7b the voltage over the stimulation electrode is plotted for various stimulation settings during switched-mode stimulation: both duty cycle as well as the supply voltage are varied with a fixed PWM frequency of \SI100kHz. Because of the voltage steered character the falling edge of the stimulation pulses is very sharp, while resistance makes sure that it discharges reasonably fast.
In Figure 7c the response of the Purkinje cell is shown for switched-mode stimulation. For these plots , and . An EPSC with the same shape as during classical stimulation is the result and also the PPF is clearly visible. It is also seen that by increasing the intensity of the stimulation using the EPSC is increased, similar to how it is increased for classical stimulation using the stimulation amplitude. These two points show that the switched-mode stimulation is able to induce similar activity in neural tissue as classical stimulation.
5 Discussion
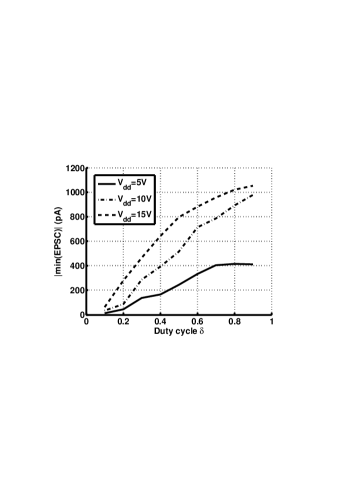
In Figure 8a the absolute value of the minimum in the EPSC is given as function of the duty cycle (, ) for the three supply voltages available. Indeed for increasing supply voltage and/or increasing the response to the stimulation becomes stronger. This shows that both as well as are effective means of adjusting the stimulation intensity.
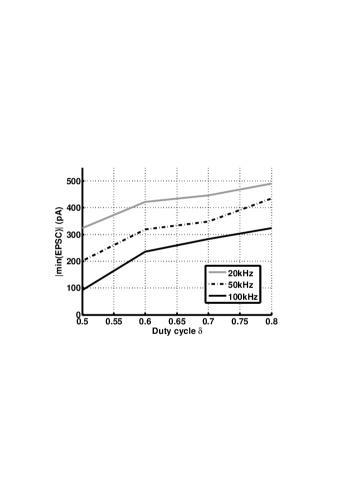
In Figure 8b the cell is stimulated with and , but the PWM frequency is varied from \SI20kHz up to \SI100kHz. As can be seen the stimulation intensity decreases for increasing frequency. This is an unexpected result, based on the simulations using the HH equations in Figure 5d. However, the simulations assumed that all the energy from the voltage source was transfered to . In reality this is not possible.
In Figure 3b large current peaks can be seen due to the charging of the capacitive component in . Any resistive component in series with will reduce (the voltage over ) during such a peak. Examples of these resistances could be a nonzero source impedance, the on resistance of the switch and the faradaic interface resistance of the electrode. For increasing the amount of current peaks is increasing, which also increases the losses.
This shows one of the disadvantages of using the switched-mode approach: losses can be expected due to the high frequency components in the stimulation waveform. Therefore, based on the measurement results, it can be concluded that switched-mode stimulation can lead to the same activation as classical stimulation, but care has to be taken to minimize additional losses that may arise due to the high frequency operation.
This conclusion confirms the electrophysiological feasibility for the design of stimulators that employ a high frequency output. These systems can improve on important aspects such as power efficiency [1] and size [7] of the stimulator. A trade-off needs to be made between the advantages that switched-mode operation can offer versus the additional losses.
This paper didn’t address the consequences for tissue damage due to the use of the switched-mode approach. Most of the studies analyzing tissue damage [11] [3] use a classic stimulation scheme only and therefore it is not known how their results translate to switched-mode operation. Furthermore, the losses due to the high frequency operation are not quantified, since the stimulator circuit that was used did not allow for that. It would be required to compare the EPSC with the total amount of charge injected in the tissue (and not ) during the stimulation pulse. Further investigation is needed to address these issues.
6 Conclusions
In this paper a theoretical analysis and in vitro experiments were used to verify the efficacy of high frequency switched-mode stimulation. Using modeling that included the dynamic properties of both the tissue material as well as the axon membrane it was found that high frequency stimulation signals can recruit neurons in a similar fashion as classical constant current stimulation.
The response of Purkinje cells due to stimulation in the molecular layer was measured for both classical and switched-mode stimulation. The measurements confirmed the modeling in showing that switched-mode stimulation can induce neuronal activation and that both the duty cycle and the stimulation voltage are effective ways to control the intensity of the stimulation. This shows that from an electro-physiological point of view, it is feasible to use high frequency stimulation, which paves the way for the design of switched-mode stimulator circuits. Care has to be taken to avoid losses in the stimulation system that arise due to the use of a high frequency stimulation signal.
Acknowledgements
The authors would like to thank the SINs group (http://www.braininnovations.nl/) for the excellent collaboration.
References
- [1] S. Arfin and R. Sarpeshkar. An energy-efficient, adiabatic electrode stimulator with inductive energy recycling and feedback current regulation. IEEE transactions on biomedical circuits and systems, 6(1):1–14, February 2012.
- [2] C.A. Bossetti, M.J. Birdno, and W.M. Grill. Analysis of the quasi-static approximation for calculating potentials generated by neural stimulation. Journal of Neural Engineering, 5(1):44–53, 2008.
- [3] A. Butterwick, A. Vankov, P. Huie, Y. Freyvert, and D. Palanker. Tissue damage by pulsed electrical stimulation. IEEE Transactions on Biomedical Engineering, 54(12):2261–2267, December 2007.
- [4] S. Gabriel, R.W. Lau, and C. Gabriel. The dielectric properties of biological tissues III: Parametric models for the dielectric spectrum of tissues. Physics in Medicine and Biology, 41(11):2271–2293, November 1996.
- [5] Z. Gao, B. Todorov, C.F. Barrett, S. van Dorp, M.D. Ferrari, A.M.J.M. van den Maagdenberg, C.I. de Zeeuw, and F.E. Hoebeek. Cerebellar ataxia by enhanced cav2.1 currents is alleviated by ca2+-dependent k+-channel activators in cacna1aS218L mutant mice. Journal of Neuroscience, 32(44):15533–15546, October 2013.
- [6] A.L. Hodgkin and A.F. Huxley. A quantitative description of membrane current and its application to conduction and excitation in nerve. The Journal of Physiology, 117(4):500–544, August 1952.
- [7] X. Liu, A. Demosthenous, and N. Donaldson. An integrated implantable stimulator that is fail-safe without off-chip blocking-capacitors. IEEE Transactions on Biomedical Circuits and Systems, 2(3):231–244, September 2008.
- [8] D.R. Merrill, M. Bikson, and J.G.R. Jefferys. Electrical stimulation of excitable tissue: design of efficacious and safe protocols. Journal of Neuroscience Methods, 141:171–198, 2005.
- [9] F. Rattay. Analysis of models for external stimulation of axons. IEEE Transactions on Biomedical Engineering, 33(10):974–977, October 1986.
- [10] M. Sahin and Y. Tie. Non-rectangular waveforms for neural stimulation with practical electrodes. Journal of Neural Engineering, 4(3):227–233, 2007.
- [11] R.V. Shannon. A model of safe levels for electrical stimulation. IEEE Transactions on Biomedical Engineering, 39(4):424–426, April 1992.
- [12] P. Somogyi and J. Hamori. A quantitative electron microscopic study of the purkinje cell axon initial segment. Neuroscience, 1(5):361–365, 1976.
- [13] C. Tai, W.C. de Groat, and J.R. Roppolo. Simulation analysis of conduction block in unmyelinated axons induced by high-frequency biphasic electrical currents. IEEE Transactions on Biomedical Engineering, 52(7):1323–1332, July 2005.
- [14] MN van Dongen and WA Serdijn. A switched-mode multichannel neural stimulator with a minimum number of external components. In IEEE International Symposium on Circuits and Systems (ISCAS). IEEE, May 2013.
- [15] MN van Dongen and WA Serdijn. A transistor-only power-efficient high-frequency voltage-mode stimulator for a multichannel system. In IEEE Biomedical Circuits and Systems Conference (BIOCAS). IEEE, October 2013.
- [16] E.N. Warman, W.M. Grill, and D. Durand. Modelling the effects of electric fields on nerve fibers: Determination of excitation thresholds. IEEE Transactions on Biomedical Engineering, 39(12):1244–1254, 1992.
- [17] A. Wongsarnpigoon and W.M. Grill. Energy-efficient waveform shapes for neural stimulation revlealed with a genetic algorithm. Journal of Neural Engineering, 7(4), 2010.