Constraining dust formation in high-redshift young galaxies
Abstract
Core-collapse supernovae (SNe) are believed to be the first significant source of dust in the Universe. Such SNe are expected to be the main dust producers in young high-redshift Lyman emitters (LAEs) given their young ages, providing an excellent testbed of SN dust formation models during the early stages of galaxy evolution. We focus on the dust enrichment of a specific, luminous LAE (Himiko, ) for which a stringent upper limit of Jy () has recently been obtained from ALMA continuum observations at 1.2 mm. We predict its submillimetre dust emission using detailed models that follow SN dust enrichment and destruction and the equilibrium dust temperature, and obtain a plausible upper limit to the dust mass produced by a single SN: –, depending on the adopted dust optical properties. These upper limits are smaller than the dust mass deduced for SN 1987A and that predicted by dust condensation theories, implying that dust produced in SNe are likely to be subject to reverse shock destruction before being injected into the interstellar medium. Finally, we provide a recipe for deriving from submillimetre observations of young, metal poor objects wherein condensation in SN ejecta is the dominant dust formation channel.
keywords:
dust, extinction — galaxies: evolution — galaxies: high-redshift — galaxies: ISM — ISM: supernova remnants — submillimetre: galaxies1 Introduction
Dust plays a key role in determining the formation and visibility of galaxies and their stars. Dust surfaces are the main site for the formation of some molecular species, especially H2 (e.g. Gould and Salpeter, 1963; Cazaux & Tielens, 2004), inducing the formation of molecular clouds in galaxies (Hirashita & Ferrara, 2002; Yamasawa et al., 2011). Dust cooling induces fragmentation of molecular clouds (Omukai, 2000; Omukai et al., 2005) and shapes the stellar initial mass function (IMF; Schneider et al. 2006). Moreover, dust grains absorb optical and ultraviolet (UV) light and reprocess it into infrared bands, dramatically affecting the observed galaxy spectra (e.g. Takeuchi et al., 2005).
Over the last decade, pieces of evidence have accumulated for astonishingly large ( M☉) amounts of dust in some quasars (QSOs; e.g. Bertoldi et al. 2003; Priddey et al. 2003; Robson et al. 2004; Beelen et al. 2006; Michałowski et al. 2010a). As QSOs are highly biased and largely evolved systems, systematically characterized by extreme star formation rates and high metallicities ( Z☉; Freudling, Corbin, & Korista 2003; Juarez et al. 2009), they cannot be readily used to study the initial dust production phases and sources (Valiante et al., 2011; Kuo & Hirashita, 2012). High-redshift submillimetre-selected galaxies (SMGs) also have a large amount of dust by definition (e.g. Michałowski et al., 2010b, and references therein); however, they are also evolved objects in terms of dust enrichment. Therefore, it is necessary to turn our attention to younger, less evolved systems such as Lyman emitters (LAEs) to make progress on the first dust enrichment in the Universe.
While stellar evolution arguments suggest the most likely first cosmic dust factories were core-collapse supernovae (SNe; Todini & Ferrara 2001; Nozawa et al. 2007; Bianchi & Schneider 2007), the dust mass formed per supernova remains a highly uncertain quantity; for reasons of brevity, we refer to core-collapse SNe as SNe in what follows. Many studies have attempted to use local SNe to get a hint on the dust mass produced per explosion: mid-infrared observations by Spitzer and AKARI have detected dust in some SNe in nearby galaxies. However, the small dust amounts detected (– M☉; Kozasa et al. 2009; Gall, Hjorth, & Andersen 2011) have proved to be rather inconclusive due to the difficulty in correctly accounting for the presence of cold dust in the mid-infrared. Herschel observations at far-infrared (FIR) wavelengths provided an advancement by detecting a larger amount of dust (0.4–0.7 M☉) in SN 1987A (Matsuura et al., 2011). However, the spatial resolution at FIR wavelengths is not good enough to isolate the newly formed dust component from pre-existing dust in the interstellar medium (ISM). Indeed, an Atacama Large Millimetre/submillimetre Array (ALMA) observation of SN 1987A by Indebetouw et al. (2014) has recently confirmed that the cold dust component observed by Herschel actually originates in the internal region, that is, the cold dust detected by Herschel is the newly formed dust component. Resolving the newly formed SNe dust component in galaxies more distant than the Magellanic Clouds remains challenging, even with instruments such as ALMA.
Alternatively, the SN production scenario for the first dust can be tested directly by searching for dust emission from young high- galaxies. Galaxies at are favourable for such studies since they are expected to have minimal contamination from dust formed by old stellar populations, which typically could start dominating the dust budget after several hundred Myr (Valiante et al., 2009). Amongst the systematically sampled high- populations, LAEs are arguably the best dust testbeds since their strong Ly line equivalent width indicates the presence of a young stellar population ( Myr, e.g. Finkelstein et al. 2007; Lai et al. 2007; Dayal et al. 2009) likely producing the first dust. Indeed, using cosmological simulations Shimizu & Umemura (2010) have shown that the stellar populations in LAEs are mostly younger than 200 Myr at , with the contribution from older stellar populations becoming increasingly important at lower redshifts. Given their young ages, the contribution from low-mass stars such as asymptotic giant branch (AGB) stars can be neglected (Valiante et al., 2009), so that the only dust-forming sources in LAEs can be reasonably assumed to be massive stars (i.e. SNe). Moreover, given the typical low metallicities derived for LAEs (0.03–0.3 Z☉; Dayal, Hirashita, & Ferrara 2010a), dust growth in the ISM, which is considered to be the most effective dust source in nearby galaxies with nearly solar metallicity (Draine, 2009; Inoue, 2011; Mattsson & Andersen, 2012), is most certainly not the dominant process contributing to the total dust budget. Indeed, Kuo & Hirashita (2012) have shown that the dominant dust source switches from SNe dust production to dust growth at a metallicity of about Z☉. Given the scenario that most dust in LAEs is expected to be produced by SNe, they can be used to obtain constraints on important quantities such as the amount of dust produced per SNe.
Constraining the dust produced per SN using LAEs is challenging due to the difficulty in directly detecting the dust emission from high- () LAEs, with most observations reporting non-detections using the Plateau de Bure Interferometer (Walter et al., 2012; Kanekar et al., 2013). This situation is expected to improve substantially with ALMA: using cosmological simulations that simultaneously reproduce LAE Ly and UV luminosity functions, Dayal, Ferrara, & Saro (2010b) predict an average dust extinction (see also Nagamine et al., 2010; Kobayashi, Totani, & Nagashima, 2010) consistent with values inferred from spectral energy distribution (SED) fitting to the rest-frame UV–optical continuum, – (Lai et al., 2007; Pirzkal et al., 2007; Finkelstein et al., 2009b). Using these models, Dayal et al. (2010a) argue that ALMA submillimetre (submm) observations will be able to directly detect the dust emission from LAEs (see also Finkelstein et al., 2009a). In contrast, other authors have argued that the extinction of high- LAEs is much lower [] (Ouchi et al., 2008; Ono et al., 2010). Directly detecting the dust emission from LAEs is therefore crucial to quantifying their dust masses and properties, and unambiguously identifying SNe as their dominant dust sources and determining their dust yield.
Recently Ouchi et al. (2013, hereafter O13) have observed a Ly-emitting gas blob ‘Himiko’ at using ALMA.111In this paper, we do not distinguish between Ly emitters and Ly blobs. This giant LAE was originally discovered as a Spitzer Infrared Array Camera (IRAC) counterpart, spectroscopically confirmed by Ouchi et al. (2009). Using ALMA, O13 have put an upper limit of 0.0521 mJy () on the observed 1.2 mm flux. This low upper limit confirms that detecting dust in LAEs is difficult probably because they are experiencing the first dust enrichment.
Taking advantage of the pioneering observations of Himiko by ALMA, our aim in this paper is two-fold: firstly, we present a general method to constrain the dust mass formed per SN that can be directly applied to ALMA observations of young high- galaxies such as LAEs. Secondly, we specifically apply our method to the ALMA observation of Himiko in order to obtain what is arguably the strongest constraint available on the dust mass formed per SN using high- galaxies. To obtain the dust mass per SN, we follow the pioneering idea proposed by Michałowski, Watson, Hjorth (2010b): we basically divide the total dust mass by the number of SNe. They applied the method to submm-bright galaxies at ; however, those galaxies are already evolved with significant dust enrichment. In such a case, it is difficult to separate dust formation/growth in SNe, AGB stars, and the ISM. In fact, Michałowski et al. (2010b) discuss all those three formation sources (see also Michałowski et al., 2010a). In this paper, we apply their method to LAEs which are at a much earlier evolutionary stage as compared to the highly-evolved bright submm galaxies.
The paper is organized as follows: we start by describing our method to compute the dust content of a young galaxy in Section 2. The dust mass so obtained is used to constrain the dust mass produced by a single SN in Section 3. We discuss the results in Section 4 and conclude in Section 5. We adopt the redshift of Ly emission () for the systemic redshift of Himiko (Ouchi et al., 2009), and use for the cosmological parameters.
Finally, we note that using cosmological galaxy formation simulations, Dayal & Ferrara (2012) have argued that Lyman break galaxies (LBGs) and LAEs are derived from the same underlying population of young, low-metallicity galaxies at , showing no appreciable differences in terms of their stellar masses, ages, metallicities and dust contents. While the exact relation between LAEs and LBGs remains a matter of debate, especially at (Verhamme et al., 2008; Nagamine et al., 2010; Dijkstra & Wyithe, 2012), if the high- LBG population being observed is indeed as young and metal-poor as LAEs, the method developed in this paper is equally applicable to the latter.
2 Constraint on the total dust mass
2.1 Total dust mass
Our first aim is to obtain an upper limit on the dust mass in Himiko, given the ALMA upper-limit of 52.1 Jy () at an observational wavelength of 1.2 mm (a rest wavelength of 158 , see O13 for observational details). While dust is optically thick only in extreme starbursts such as ultra-luminous infrared galaxies (Soifer et al., 1999; Klaas et al., 2001; Matsushita et al., 2009), the dust in LAEs safely satisfies the optically thin condition in the FIR justifying our use of the optically thin approximation. We now explain our formalism for calculating the total dust mass in Himiko. We emphasise that our formulation itself is general enough to be applied for future ALMA observations of other high- galaxies that are optically thin in the FIR.
At FIR wavelengths, dust emission can be treated as being thermal, so that the flux density (simply referred to as flux) at an observational frequency can be written as (Dayal et al., 2010a)
| (1) |
where is the dust mass absorption coefficient, and are the dust mass and temperature, respectively, is the Planck function, and is the luminosity distance (Carroll, Press, & Turner, 1992); given an observed value of , equation (1) can be used to obtain for any given value of . We express the mass absorption coefficient of dust as
| (2) |
where is the value at 158 ( Hz). We take 158 as a reference wavelength since high- ALMA observations are often tuned to the rest wavelength of [C ii] emission. Dayal et al. (2010a) adopted mass absorption coefficients from Draine & Lee (1984), referred to as graphite and silicate in Table 1. Since we expect the dominant source of dust in LAEs to be SNe, in this work we also use the mass absorption coefficient for the dust grains formed in SNe. We adopt the theoretically calculated mass absorption coefficients obtained by Hirashita et al. (2005) using the dust species and grain size distributions in Nozawa et al. (2003) for dust condensed in SNe. This case is referred to as SNcon (Table 1). We also apply the dust properties after the so-called reverse shock destruction within the supernova remnant from Hirashita et al. (2008), whose calculation is based on the dust properties in Nozawa et al. (2007). This case is referred to as SNdest. Matsuura et al. (2011) adopted a mixture of silicate, amorphous carbon (AC) and iron to estimate the dust mass in SN 1987A observed by Herschel, with the dominant contribution coming from silicate and AC. With high-resolution ALMA observations, Indebetouw et al. (2014) have confirmed that the flux observed by Herschel is actually coming from newly formed dust in the ejecta in the inner regions. In order to compare to their estimate of the dust mass, we also adopt AC (note that their silicate is the same as we adopted above); following Matsuura et al. (2011), we use the optical constants of AC from Zubko et al. (1996), and calculate the mass absorption coefficient by using the Mie theory (Bohren & Huffman, 1983) with the mass density taken from Zubko, Dwek, & Arendt (2004).
| Species | Ref. g | ||||||
|---|---|---|---|---|---|---|---|
| (cm2 g-1) | (g cm-3) | (K) | ( M☉) | (M☉) | |||
| Graphite | 20.9 | 2 | 2.26 | 29.3 | 1.4 | 0.23 | 1, 2 |
| Silicate | 13.2 | 2 | 3.3 | 29.7 | 2.0 | 0.33 | 1, 2 |
| SN | 5.57 | 1.6 | 2.96 | 36.7 | 2.7 | 0.45 | 3 |
| SN | 8.94 | 2.1 | 2.48 | 32.9 | 2.2 | 0.37 | 4 |
| ACj | 28.4 | 1.4 | 1.81 | 30.5 | 0.89 | 0.15 | 5, 6 |
aMass absorption coefficient at 158 .
bEmissivity index ().
cMaterial density.
dEquilibrium dust temperature in Himiko.
eUpper limits for the dust mass corresponding to the ALMA upper limit.
fUpper limits for the dust mass ejected from a single supernova (SN).
g References: 1) Draine & Lee (1984); 2) Dayal et al. (2010a); 3) Hirashita et al. (2005); 4) Hirashita et al. (2008); 5) Zubko et al. (1996); 6) Zubko et al. (2004).
hDust condensed in SNe before reverse shock destruction.
iDust ejected from SNe after reverse shock destruction.
jAmorphous carbon.
We show the dust mass () corresponding to the ALMA upper limit for Himiko as a function of in Fig. 1; we use a range of due to the poor constraints available on its value. The lower limit of the temperature shown in Fig. 1 (20.7 K) corresponds to the temperature of the cosmic background radiation at ; as for the upper limit, we stop at K since the dependence of dust mass on the temperature is weak above this value. Within these temperature limits, we find that the ALMA upper limit corresponds to – M☉, depending strongly on the dust temperature. The dust mass is inversely proportional to the mass absorption coefficient: is smaller by a factor of 5.1 for the AC than for the SNcon .
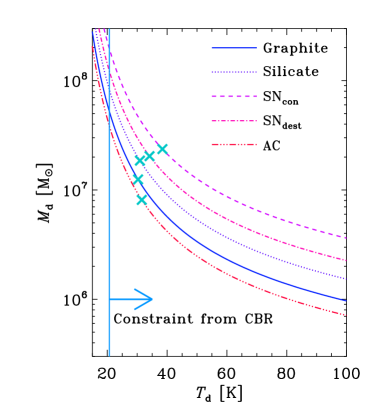
The strong dependence on makes it difficult to obtain meaningful constraints on unless reasonable temperature estimates are available. Since Himiko has been observed in a single ALMA band, we can not constrain directly from the SED. We therefore propose an alternative solution to estimate in what follows.
2.2 Dust temperature
While it is difficult to constrain the dust temperature from the ALMA upper limit, a reasonable temperature can be obtained assuming dust radiative equilibrium, i.e. the equilibrium between dust absorption and emission. This temperature is referred to as the equilibrium temperature () and can be estimated as explained in what follows.
The total luminosity emitted by a single dust grain can be written as
| (3) | |||||
where is the grain radius assuming spherical grains, is the grain material density (listed in Table 1), is the Planck constant, is the speed of light, is the Boltzmann constant and . The energy absorbed by a single grain per unit time is estimated as
| (4) |
where is the cross section normalized to the geometric cross section for the absorption of UV radiation, is the total UV luminosity of the stars, and is the typical radius of the spatial dust distribution. In this equation, we assume that the UV radiation dominates the dust heating (e.g. Buat & Xu, 1996) and that the UV source is concentrated in the centre; this latter assumption does not affect the results in any appreciable manner. For UV radiation, we assume (Bohren & Huffman, 1983; Draine & Lee, 1984) since the absorption cross section approaches the geometrical cross section at wavelengths as short as 0.2 . The equilibrium temperature, , can then be obtained as a solution of
| (5) |
In order to solve equation (5), we need to evaluate , , and . The values adopted for each of these quantities is now explained: we adopt a value of since the dust produced by stars in the early phase of galaxy evolution is biased towards large grain sizes (–1 ; Nozawa et al. 2007; Asano et al. 2013a) as supported by a number of works: although Bianchi & Schneider (2007) have shown that small grains () are produced by dust destruction, they do not have a large contribution to the total dust mass. Désert, Boulanger, & Puget (1990) and Li & Draine (2001) have shown that even if dust grains have a power-law grain size distribution as in the ISM of Milky Way, the largest grains () contribute most to the dust mass, which is well traced by the FIR emission. Indeed, Galliano et al. (2005) have confirmed that the FIR emission is dominated by big grains () also in nearby low-metallicity galaxies. In any case, the equilibrium temperature does not sensitively depend on (), and the existence of small grains increases , enabling a stricter constraint on the dust mass. We estimate the total UV luminosity as ( is the stellar luminosity density at frequency ) at rest wavelength 0.2 , which is nearly the centre of the UV wavelength range. This is equivalent to assuming the UV wavelength to range between and , which clearly gives a conservative (lower) estimate for the equilibrium dust temperature since radiation at longer wavelengths also contributes to dust heating. We also use the Hubble Space Telescope/Wide Field Camera 3 -band (rest 0.21 ) flux for the 0.2 flux of Himiko (O13), which is converted to . This also gives a conservative (lower) estimate for the equilibrium dust temperature because the observed flux is expected be affected by dust extinction. We obtain L☉ with an observational error of per cent. Finally, for consistency with O13, is taken to have a value of half of the ALMA beam size, i.e. 0.82 arcsec/2, corresponding to kpc for Himiko. We note that the dependence of is weak, and our estimate of is reasonable as long as dust is distributed within the ALMA beam; indeed, the geometric mean of the semi-major and semi-minor axis of the stellar distribution is arcsec in Himiko. Although we cannot completely exclude the possibility that the dust distribution extends much beyond the ALMA beam, a large amount of dust beyond the stellar distribution would make it extremely difficult to explain the observed diffuse Ly emission since it would have been easily attenuated by spatially extended dust. This possibility of extended dust distribution needs to be observationally investigated in the future with more sensitive observations using the full ALMA array; for this paper we assume that the dust distribution is compact enough, or that all the dust in the galaxy being modelled is contained within a single ALMA beam. The equilibrium dust temperatures () calculated for Himiko using these calculations are listed in Table 1 for each dust species. It is clearly seen that tends to be lower for higher in the FIR because higher values indicate more efficient emission (i.e. more efficient radiative cooling of dust). The exception for this is AC, whose equilibrium dust temperature is high because of small and small : small means that the dust emission at the spectral peak () is more suppressed due to inefficient dust cooling and small means that the dust absorbs more UV light resulting in efficient dust heating (see equation 4).
It is encouraging to note that our range of shown in Table 1 are consistent with observationally inferred values: Lee et al. (2012) have inferred dust temperatures K for high- () LBGs with luminosities comparable to Himiko and Rémy-Ruyer et al. (2013) have found median dust temperatures K for a sample of nearby low-metallicity star-forming galaxies, systematically higher than that in galaxies with solar metallicity. For these temperatures, it is suitable to tune ALMA observations to 158 since it is near the emission peak. Indeed, the wavelength at which the dust emission peaks () can be estimated from the peak of the Planck function as (Rybicki & Lightman, 1979), which is close to the [C ii] wavelength (158 ), to which high- observations are often tuned.
2.3 Upper limits of the dust mass
Now that we have estimated the equilibrium dust temperature for each dust species in Section 2.2 (see also Table 1), we can use equation (1) to obtain the total dust mass corresponding to the ALMA upper limit flux for Himiko for each species studied. We use this to put a mark on each line at in Fig. 1. The dust mass at the marked position on each line then corresponds to the upper limit of the dust mass in Himiko for a given dust species, and has a value – M☉; these upper limits for the dust mass are also listed in Table 1.
We remind the reader that it is extremely difficult to put a strong constraint on the dust mass without a constraint on the dust temperature because low values of down to the temperature of the cosmic background radiation allow dust masses as high as M☉. However, introducing the physically reasonable assumption of dust grains being at the equilibrium temperature, we can put stringent constraints on the dust mass for any given species. Further, the dependence of on the mass absorption coefficient makes the dependence of on the dust species milder: under a fixed observed flux, a smaller predicts a larger dust mass, but it also leads to a higher equilibrium dust temperature because of less efficient dust FIR emission (i.e. dust cooling). As a consequence, the dust masses obtained under the equilibrium dust temperature for the various dust species differ only within a factor of 3, although there is a factor of 5 difference in the mass absorption coefficient.
3 Constraint on the dust enrichment
We now investigate the implications of the upper limits on the dust mass derived above. There are two major sources of dust at : dust formation in SNe, and dust growth by the accretion of gas-phase metals in the ISM (e.g. Zhukovska, Gail, & Trieloff, 2008; Valiante et al., 2011; Kuo & Hirashita, 2012; Asano et al., 2013b). As mentioned before, we have neglected dust enrichment by AGB stars in this paper, since the age of Himiko is too low ( Myr; O13) for low-mass stars to have evolved to the AGB phase (Valiante et al., 2009). While this argument is true assuming a constant star formation rate which is a good approximation for LAEs (and adopted for Himiko in O13), Valiante et al. (2009) have shown that AGB stars may dominate dust production over SNe as early as 200 Myr, in an environment where all stars form in a burst at . However, bursty star formation histories require younger ages as compared to a constant star formation history to reproduce the same UV continuum (Ono et al., 2010). Therefore, we expect that our assumption of neglecting dust formation in AGB stars is reasonable, regardless of the star formation history adopted.
3.1 Dust formation by SNe
Assuming SNe to be the dominant source of dust, we can constrain the dust mass formed in a single SNe by using the upper limits derived for the dust mass in Himiko in Section 2.3. The dust mass ejected from a single SN, is estimated as
| (6) |
where is the fraction of dust destroyed by SN shocks in the ISM, and is the total number of SNe. We neglect the effect of dust recycling in star formation, since the assumption that SNe are the dominant source over grain growth indicates an early stage of chemical evolution. The concept of dust yield per SN (or star) was adopted by Michałowski et al. (2010b), but we include the correction for the dust destruction by introducing the parameter since dust grains are subject to destruction in interstellar shocks induced by the ambient SNe (Dwek & Scalo, 1980; McKee, 1989; Jones et al., 1994; Dwek, Foster, & Vancura, 1996). To solve the above equation, we need to estimate and , which are obtained as now explained.
The total number of SNe at age , , is estimated by
| (7) | |||||
where is the star formation rate at , is the lifetime of a star with mass , is the IMF, and stars in the mass range of 8–40 are assumed to evolve into SNe (Heger et al., 2003). In this paper, the stellar mass, , refers to the mass at the zero age main sequence. We assume that the lifetimes of SN progenitors are much shorter than in order to simplify the first line of equation (7) to the second. Further, as in O13, we adopt a Salpeter IMF () between and M⊙. The IMF is normalized so that the integral of for the entire mass range is 1.
To link equation (7) to observed quantities such as the stellar mass, we need a few more pieces of information as now explained. The number fraction of stars with mass greater than 8 M☉ () can be obtained as
| (8) |
where M for the IMF adopted. As expected, this value is not sensitive to the upper mass used for SNe II; changing the upper mass limit to 100 M☉ changes the value slightly to M. Further, the total stellar mass, can be estimated as
| (9) | |||||
where is the turn-off mass at age , is the remnant mass and is the returned fraction of gas from stars, defined as
| (10) |
We have used the instantaneous recycling approximation (Tinsley, 1980) (see also the appendix of Hirashita & Kuo 2011) to go from the first to the second line in equation (9). We adopt the turn-off mass at yr (5 M☉) and from Hirashita & Kuo (2011), obtaining . Combining equations (7)–(9), we obtain
| (11) |
This equation can be used to obtain the number of SNe from the total stellar mass.
Using SED fitting O13 inferred the stellar mass of Himiko to be and M☉, for the case without and with nebular emissions, respectively. With M and , we obtain and for the cases without and with nebular emissions. We hereafter adopt in order to obtain a conservative upper limit for for Himiko (see equation 6).
In order to use equation (6), we still need to estimate . To this aim, we utilize the analytical dust enrichment model presented in Hirashita & Kuo (2011) which is now briefly summarized: galaxies are treated as a closed-box single zone and implemented with the analytic treatments adopted in Lisenfeld & Ferrara (1998) with grain growth in the ISM added by Hirashita (1999). The model equations are composed of the time evolution of gas, metals and dust content. While the evolution of gas and metals is described by recycling in star formation and production of new metals in stars, the dust evolution equation includes formation in stellar ejecta, destruction by SN shocks and dust mass growth by the accretion of gas-phase metals in the ISM. After applying the instantaneous recycling approximation, the equation describing the relation between dust-to-gas ratio () and metallicity () can be expressed as
| (12) |
where is the condensation efficiency of metals in the stellar ejecta (SNe in this paper), is the mass fraction of newly produced and ejected metals by stars, is the increment of dust mass in molecular clouds, is the star formation efficiency in molecular clouds (assumed to be 0.1) and is the efficiency of dust destruction by shocks in SN remnants, which is defined by . Here, represents the fraction of dust destroyed in a single SN blast, is the gas mass swept per SN blast and is the SN rate, as introduced in Dwek & Scalo (1980). The terms on the right-hand side of equation (12) reflect dust formation in stellar ejecta [], dust destruction in SN shocks sweeping the ISM (), dilution of dust-to-gas ratio by returned gas from stars (), and dust growth in molecular (or dense) clouds (). Except for , all the other parameters are taken to be constants; although depends on metallicity, such dependence is predicted to be small (roughly within a factor of 2) in the metallicity range of interest (Todini & Ferrara, 2001; Bianchi & Schneider, 2007). For , we adopt the same formula and parameter values as in the case of silicate in Hirashita & Kuo (2011).222Specifically we adopt Model C in Hirashita & Kuo (2011), i.e. a power-law grain size distribution. This distribution is motivated by the fact that small grain production occurs by shattering at the metallicity where grain growth becomes efficient (Asano et al., 2013a). In fact, the precise choice of is not important since LAEs lie in a metallicity range where dust growth is not important. Briefly, is an increasing function of metallicity, which reflects that dust growth becomes efficient in a metal-rich condition.
If we only consider dust production by SNe, . However, if we account for dust destruction by SN shocks, is less than , and the ratio of to is related as . We then use our model to calculate . We adopt as estimated above. We evaluate with the same turn-off mass, M☉. The dust mass ejected from a single SN, , is related to as
where is the mass of ejected metals from a star with mass . Adopting a Salpeter IMF, we obtain . As shown later in the same section, we obtain M☉, resulting in .
We now compare the solution of equation (12) with , which describes the evolution of the dust-to-gas ratio for stellar dust production, i.e. without considering dust destruction and growth. The effects of processes other than stellar dust formation can be seen by dividing the solution of equation (12) by . In Fig. 2, we show the relation between and metallicity. As explained before, at low metallicity, because the processes other than dust formation by stars are negligible. The decrease of around 0.1 Z☉ is due to dust destruction by SN shocks in the ISM, after which increases at Z☉ because of grain growth in the ISM. Therefore, while dust can be safely assumed to be of stellar origin for Z☉, it is impossible to constrain the stellar dust production for LAEs with metallicity values larger than about Z☉. As mentioned at the beginning of this section, we assume that the dust in LAEs is predominantly produced by stars (specifically SNe, because of the young age). In other words, we implicitly assume that the metallicity of LAEs is lower than Z☉.
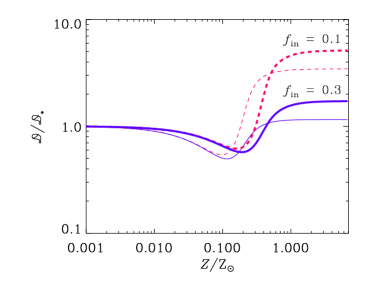
We briefly digress here to discuss the dependence of on metallicity: the minimum value for this ratio is produced by the combined effects of dust destruction and growth; indeed the depletion of metals in the Milky Way is well reproduced by our models, and determined by the balance between dust growth and dust destruction. The dust-to-gas ratio in other nearby galaxies are also reproduced by using similar parameters (Mattsson et al., 2014). Therefore, our choice of parameters are justified by those data. However, Hirashita & Kuo (2011) have noted that an enhancement in dust destruction by a factor of 2 (i.e. ) is possible when considering the uncertainty in the depletion measurements; we therefore also show cases with in Fig. 2. In spite of this higher destruction efficiency, the minimum of does not change sensitively. Rather, dust growth enters the dust evolution earlier (because the gas-phase metals are more abundant), which indicates that the metallicity range in which dust growth can be neglected becomes narrower. Although there is no firm measurement of the metallicity of Himiko, a clue can be derived from the non-detection of [C ii] line in O13: these authors have found that [C ii] is weaker by an order of magnitude with respect to the value expected from the local SFR–[C ii] relation. Such deficiency of [C ii] emission has also been seen in local metal-poor galaxies whose metallicities are below 0.1 Z☉ (De Looze et al., 2014) although its physical reason has not yet been identified (see De Looze et al., 2014, for possible reasons). This [C ii] observation provides an empirical support for the low metallicity of Himiko assumed in this work and is supported by the work of Vallini et al. (2013) whose [C ii] emission models also favour metallicities lower than solar for Himiko. We end by noting the caveat that it is difficult to completely exclude the possibility of significant contribution from ISM dust growth to the total dust content. However, even in this case, the upper limit of (dust mass produced per SN) is valid, since the excess of dust above that formed in SNe could be attributed to grain growth (or other possible dust sources if any).
We now return to estimating in equation (6). The fraction of dust destroyed by SN shocks can be evaluated by the decrement of in Fig. 2. The effect of dust destruction is seen most prominently at the minimum of and has a value of 0.57, 0.62, 0.50, and 0.54 for , (0.1, 9.65), (0.3, 19.3), and (0.1, 19.3), respectively. We conservatively adopt a value of in this work.
Putting all pieces together, we can now estimate an upper limit of the dust mass ejected from a single SN, , for Himiko by using equation (6). The upper limit is listed in Table 1 for each of the dust species adopted. From our calculations, we have successfully obtained upper limits of –0.45 M☉ depending on the dust species; these limits are discussed in the next section.
4 Discussion
4.1 Comparison with theoretical dust yields in SNe
Now that we have obtained constraints on (–0.45 M☉), we can compare our results with theoretically expected values in the literature, as shown in Fig. 3. We compare to the theoretical data from Nozawa et al. (2007), who consider dust condensation in SNe and its subsequent destruction by reverse shocks (referred to as reverse shock destruction) under various hydrogen number densities of the ambient medium (). Bianchi & Schneider (2007) have also calculated the dust condensation and reverse shock destruction in SNe based on Todini & Ferrara (2001), obtaining similar results; therefore the following discussion does not change even if we adopt the data from Bianchi & Schneider (2007). Amongst the cases studied by (Nozawa et al., 2007), we show the case with the unmixed helium core, but the case with the mixed helium core predicts similar dust masses with a tendency towards higher destruction with increasing .
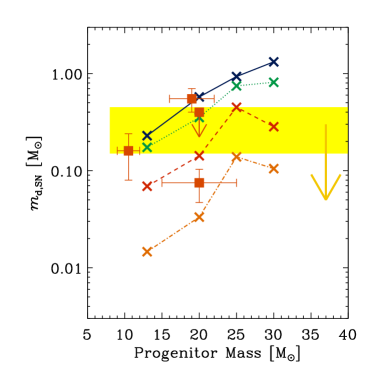
From Fig. 3, it is clear that the constraint obtained for Himiko favours the theoretical dust mass including destruction. Taking the weighted average of for the Salpeter IMF adopted above, we obtain 0.44, 0.31, 0.13, and 0.036 M☉ for , 0.1, 1, and 10 cm-3, respectively ( indicates no reverse shock destruction). Therefore, the upper limit obtained for Himiko favours reverse shock destruction with an ambient density of , although a scenario with no dust destruction is still permitted provided we use low- dust species such as SNcon (Table 1).
4.2 Comparison with nearby SNe
In Fig. 3, we also plot the dust masses observed in nearby SNe. Although there are a large number of SNe observed in the mid-infrared by Spitzer and AKARI, we limit the sample to the SNe detected by the Herschel far-infrared bands. This is because the mid-infrared observations only trace the warm dust component, while it is the cold component traced by FIR observations that dominates the total newly formed dust budget (Matsuura et al., 2011); indeed, mid-infrared observations obtain dust masses of – M☉ (Gall et al., 2011, and references therein), systematically well below the data from Herschel detections. Further, the newly formed dust component in SNe should be isolated from the ISM dust component, which limits the sample to objects in the Galaxy and Magellanic Clouds. We therefore use the data for Cas A and Crab for Galactic SN remnants, and SN 1987A and N 49 for SN remnants in the Large Magellanic Cloud (LMC) as summarized in Table 2. In fact, although it is difficult to separate the dust emission from the new and pre-existing components for the SNe in the LMC with the spatial resolution of Herschel, recent observations of SN 1987A by ALMA have confirmed that the emission comes from the inner region, i.e. the dust observed by Herschel is indeed the newly formed component. Due to possible contamination, we interpret the dust mass of N 49 to be an upper limit on the newly formed component.
| Object | ref | ref | ||
|---|---|---|---|---|
| (M☉) | (M☉) | |||
| Cas A | 15–25 | 1 | 1 | |
| Crab | 9–12 | 2, 3, 4 | 0.08–0.24 | 2 |
| SN 1987A | 16–22 | 5 | 0.4–0.7 | 3, 4e |
| N 49 | 20 | 6 | 5 |
aMass of the progenitor at the zero-age main sequence.
bReferences for the progenitor mass: 1) Krause et al. (2008); 2) Nomoto et al. (1982); 3) MacAlpine & Satterfield (2008); 4) Gomez et al (2012); 5) Arnett et al. (1989); 6) Hill et al. (1995).
cInferred dust mass for the newly formed component.
dReferences for the inferred dust mass: 1) Barlow et al. (2010); 2) Gomez et al (2012); 3) Matsuura et al. (2011); 4) Indebetouw et al. (2014); 5) Otsuka et al. (2010).
eIndebetouw et al. (2014) derived a dust mass of M☉ by assuming amorphous carbon while Matsuura et al. (2011) obtained M☉ for the same species. The difference is explained by the different mass absorption coefficients adopted in these papers.
fBecause of possible contamination with the molecular cloud with which this SN remnant is interacting, we regard this dust mass as an upper limit for the newly formed dust.
Comparing the observational data (filled squares) with the upper limits obtained for Himiko (yellow area) in Fig. 3, we find that the data are broadly consistent with our limits, although the large dust mass derived for SN 1987A exceeds the upper limits of obtained for silicate and AC (0.15–0.33 M☉; Table 1). Matsuura et al. (2011) adopted these dust species to estimate the newly formed dust mass (0.4–0.7 M☉) in SN 1987A. We remind the reader that the dust observed in nearby SNe should suffer reverse shock destruction before being injected into the ISM. In other words, the large newly formed dust mass observed in SN 1987A favours subsequent reverse shock destruction.
4.3 Future prospects for high-redshift observations
In this paper, we have presented the first attempt at modelling the dust in the high- () Ly-emitting blob Himiko observed by O13. Further constraints on SNe dust production are expected from ALMA observations given its increasing capabilities. The sensitivity converted to the dust mass per single SN, can be written as
| (14) |
where represents the number of antennas and is the on-source integration time; we normalize these quantities using the set-up in O13. With the planned full ALMA array () becoming operational, we will be able to push down to M☉333http://www.almaobservatory.org/; such observations will be crucial in obtaining better constraints on the dust produced per SN.
We emphasize that the method developed in this paper can be applied to any high- object/population wherein SNe are the dominant dust source. In particular, based on their cosmological galaxy formation simulations, Dayal & Ferrara (2012) have shown that high- LAEs and LBGs are derived from the same underlying population, with LAEs representing a luminous LBG subset. They also show that LBGs at –8 typically have ages Myr and metallicities Z☉. With such young ages and low metallicities, dust formation by AGB stars and dust growth in the ISM can safely be neglected in LBGs. In this context, we can target both LBG and LAE populations in order to constrain the dust mass produced per SN.
Finally, detection of far-infrared emission lines such as [C ii] 158, [O ii] 63, and [N ii] 122 can help to constrain ISM physical properties, especially the metallicity (Nagao et al., 2012; Vallini et al., 2013). Further, CO lines can constrain the gas content, which can be used in conjunction with the dust content derived from the continuum to obtain a dust-to-gas ratio. The relation between dust-to-gas ratio and metallicity is often used to discuss the dust enrichment history (Lisenfeld & Ferrara, 1998; Hirashita, 1999). So far, none of the above lines or the continuum have been detected for Himiko (O13; Wagg & Kanekar 2012); deep ALMA observations targeting these lines in addition to the dust continuum will be crucial in constraining the ISM evolutionary state in Himiko, as well as for other LAEs at high .
4.4 Recipe to obtain the dust mass per SN
For the convenience of future ALMA observations of LAEs, we summarize our recipe of deriving the dust mass per SN based on the flux detected; the same method can be used to obtain an upper limit on the dust mass in case only an observational upper limit is obtained for the flux. We note that our analysis is based on the following two assumptions: [1] the object has a low metallicity ( Z☉) so that grain growth by accretion of gas-phase metals can be neglected; and [2] the age is young enough to neglect the contribution from AGB stars to the total dust content. We now summarize the main steps in our model:
[1] Assuming a dust species, use the corresponding mass absorption coefficient (, listed in Table 1) to estimate the dust temperature, . If the object is observed at (more than) two rest-FIR wavelengths, it is possible to estimate by using the wavelength dependence of the SED, . However, it is impossible to get the dust temperature from the SED if the object is observed at a single submm wavelength; in this case, the dust temperature must be obtained assuming radiative equilibrium (equation 5).
[2] Use equation (1) and the same as in step [1] above to obtain .
[3] Obtain the total stellar mass, by fitting an SED from a population synthesis code to observations at rest UV wavelengths. Use this to estimate the total number of SNe using equation (11). Using the same IMF as adopted in this paper (a Salpeter IMF with the stellar range 0.1–100 M☉), the same values for and can be used. We note that the number of SNe so obtained is not sensitive to the IMF since both SNe and rest UV stellar emission reflect the population of massive stars.
[4] Finally, use equation (6), to obtain the dust mass per SN, . The chemical evolution model adopted in this paper indicates that –0.5 For the purpose of obtaining a conservative upper limit, is recommended, while adopting may lead to an underestimate of by a factor of .
5 Conclusion
We have examined how the early dust enrichment of high- galaxies can be constrained by using Lyman emitters (LAEs), which are a young, metal-poor population of galaxies. Because of their young ages, we assume core-collapse supernovae (simply referred to as SNe) to be the dominant source of dust enrichment. Within this scenario, we have provided a ‘recipe’ to constrain the dust production by SNe in LAEs as summarized in Section 4.4. In particular, applying our method to Himiko, for which a stringent upper limit on the dust emission flux (at 1.2 mm) has been obtained by ALMA, we obtain upper limits on the dust mass produced by a single SN of 0.15–0.45 M☉; the exact value depends on the mass absorption coefficient adopted. While these upper limits are consistent with the values observed in many nearby SN remnants, the large dust mass detected in SN 1987A favours future reverse shock destruction. Finally, we end by emphasizing that the recipe presented in this work to obtain the dust mass per SN is applicable to any young, metal-poor galaxy in which condensation in SN ejecta is the dominant dust formation channel.
Acknowledgments
We are grateful to M. Matsuura and M. Otsuka for providing us with useful information on dust properties in supernova remnants, and K. Asada for helpful comments on interferometric observations. We also thank the anonymous referee for careful reading and useful comments. HH thanks the support from the Ministry of Science and Technology (MoST) grant 102-2119-M-001-006-MY3. PD acknowledges the support of the European Research Council.
References
- Arnett et al. (1989) Arnett, W. D., Bahcall, J. N., Kirshner, R. P., & Woosley, S. E. 1989, ARA&A, 27, 629
- Asano et al. (2013a) Asano, R., Takeuchi, T. T., Hirashita, H., & Nozawa, T. 2013a, MNRAS, 432, 637
- Asano et al. (2013b) Asano, R., Takeuchi, T. T., Hirashita, H., & Inoue, A. K. 2013b, Earth Planets Space, 65, 213
- Barlow et al. (2010) Barlow, M. J., et al. 2010, A&A, 518, L138
- Beelen et al. (2006) Beelen, A., Cox, P., Benford, D. J., Dowell, C. D., Kovács, A., Bertoldi, F., Omont, A., & Carilli, C. L. 2006, ApJ, 642, 694
- Bertoldi et al. (2003) Bertoldi F., Carilli C. L., Cox P., Fan X., Strauss M. A., Beelen A., Omont A., Zylka R., 2003, A&A, 406, L55
- Bianchi & Schneider (2007) Bianchi, R., & Schneider, R. 2007, MNRAS, 378, 973
- Bohren & Huffman (1983) Bohren C. F., Huffman D. R., 1983, Absorption and Scattering of Light by Small Particles. Wiley, New York
- Buat & Xu (1996) Buat, V., & Xu, C. 1996, A&A, 306, 61
- Carroll, Press, & Turner (1992) Carroll S. M., Press W. H., Turner E. L., 1992, ARA&A, 30, 499
- Cazaux & Tielens (2004) Cazaux, S., & Tielens, A. G. G. M. 2004, ApJ, 604, 222
- Dijkstra & Wyithe (2012) Dijkstra, M., & Wyithe, J. S. B. 2012, MNRAS, 419, 3181
- Dayal & Ferrara (2012) Dayal, P., & Ferrara, A. 2012, MNRAS, 421, 2568
- Dayal et al. (2009) Dayal, P., Ferrara, A., Saro, A., Salvaterra, R., Borgani, S. & Tornatore, L. 2009, MNRAS, 400, 2000
- Dayal et al. (2010a) Dayal, P., Hirashita, H., & Ferrara, A. 2010a, MNRAS, 403, 620
- Dayal et al. (2010b) Dayal, P., Ferrara, A., & Saro, A. 2010b, MNRAS, 402, 1449
- De Looze et al. (2014) De Looze, I., et al. 2014, A&A, submitted
- Désert, Boulanger, & Puget (1990) Désert, F.-X., Boulanger, F., & Puget, J. L. 1990, A&A, 237, 215
- Draine (2009) Draine B. T., 2009, in Henning Th., Grün E., Steinacker J., eds, ASP Conf. Ser. 414, Cosmic Dust – Near and Far. Astron. Soc. Pac., San Francisco, p. 453
- Draine & Lee (1984) Draine, B. T., & Lee, H. M. 1984, ApJ, 285, 89
- Dwek, Foster, & Vancura (1996) Dwek, E., Foster, S. M., & Vancura, O. 1996, ApJ, 457, 244
- Dwek & Scalo (1980) Dwek, E., & Scalo, J. M. 1980, ApJ, 239, 193
- Finkelstein et al. (2009a) Finkelstein, S. L., Malhotra, S., Rhoads, J. E., Hathi, N. P., & Pirzkal, N. 2009a, MNRAS, 393, 1174
- Finkelstein et al. (2009b) Finkelstein, S. L., Rhoads, J. E., Malhotra, S., Grogin, N. 2009, ApJ, 691, 465
- Finkelstein et al. (2007) Finkelstein, S. L., Rhoads, J. E., Malhotra, S., Pirzkal, N., & Wang, J. 2007, ApJ, 660, 1023
- Freudling, Corbin, & Korista (2003) Freudling, W., Corbin, M. R., & Korista, K. T. 2003, ApJ, 587, L67
- Galliano et al. (2005) Galliano, F., Madden, S. C., Jones, A. P., Wilson, C. D., & Bernard, J.-P. 2005, A&A, 434, 867
- Gall et al. (2011) Gall, C., Hjorth, J., & Andersen, A. C. 2011, A&AR, 19, 43
- Gomez et al (2012) Gomez, H. L., et al. 2012, ApJ, 760, 96
- Gould and Salpeter (1963) Gould, R. J., & Salpeter, E. E., 1963, ApJ, 138, 393
- Heger et al. (2003) Heger, A., Fryer, C. L., Woosley, S. E., Langer, N., & Hartmann, D. H. 2003, ApJ, 591, 288
- Hill et al. (1995) Hill, R. S., Cheng, K.-P., Bohlin, R. C., O’Connell, R. W., Roberts, M. S., Smith, A. M., & Stecher, T. 1995, ApJ, 446, 622
- Hirashita (1999) Hirashita, H. 1999, ApJ, 510, L99
- Hirashita & Ferrara (2002) Hirashita, H., & Ferrara, A. 2002, MNRAS, 337, 921
- Hirashita & Kuo (2011) Hirashita, H., & Kuo, T.-M. 2011, MNRAS, 416, 1340
- Hirashita et al. (2005) Hirashita, H., Nozawa, T., Kozasa, T., Ishii, T. T., & Takeuchi, T. T. 2005, MNRAS, 357, 1077
- Hirashita et al. (2008) Hirashita, H., Nozawa, T., Takeuchi, T. T., & Kozasa, T. 2008, MNRAS, 384, 1725
- Indebetouw et al. (2014) Indebetouw, R., et al. 2014, ApJ, 782, L2
- Inoue (2011) Inoue, A. K. 2011, Earth, Planets Space, 63, 1027
- Jones et al. (1994) Jones, A. P., Tielens, A. G. G. M., Hollenbach, D. J., & McKee, C. F. 1994, ApJ, 433, 797
- Juarez et al. (2009) Juarez, Y., Maiolino, R., Mujica, R., Pedani, M., Marinoni, S., Nagao, T., Marconi, A., Oliva, E. 2009, A&A, 494, L25
- Kanekar et al. (2013) Kanekar, N., Wagg, J., Chary, R. R., & Carilli, C. L. 2013, ApJ, 771, L20
- Klaas et al. (2001) Klaas, U., et al. 2001, A&A, 379, 823
- Kobayashi, Totani, & Nagashima (2010) Kobayashi, M. A. R., Totani, T., & Nagashima, M. 2010, ApJ, 708, 1119
- Kozasa et al. (2009) Kozasa T., Nozawa T., Tominaga N., Umeda H., Maeda K., Nomoto K., 2009, in Henning Th., Grün E., Steinacker J., eds, ASP Conf. Ser. Vol. 414, Cosmic Dust – Near and Far. Astron. Soc. Pac., San Francisco, p. 43
- Krause et al. (2008) Krause, O., Birkmann, S. M., Usuda, T., Hattori, T., Goto, M., Rieke, G. H., & Misselt, K. A. 2008, Science, 320, 1195
- Kuo & Hirashita (2012) Kuo, T.-M. & Hirashita, H. 2012, MNRAS, 424, L34
- Kuo, Hirashita, & Zafar (2013) Kuo, T.-M., Hirashita, H., & Zafar, T. 2013, MNRAS, 436, 1238
- Lai et al. (2007) Lai, K., Huang, J.-S., Fazio, G., Cowie, L. L., Hu, E. M., & Kakazu, Y. 2007, ApJ, 655, 704
- Lee et al. (2012) Lee, K.-S., Alberts, S., Atlee, D., Dey, A., Pope, A., Jannuzi, B. T., Reddy, N., & Brown, M. J. I. 2012, ApJ, 758, L31
- Li & Draine (2001) Li, A., & Draine, B. T. 2001, ApJ, 554, 778
- Lisenfeld & Ferrara (1998) Lisenfeld, U., & Ferrara, A. 1998, ApJ, 496, 145
- MacAlpine & Satterfield (2008) MacAlpine, G. M., & Satterfield, T. J. 2008, AJ, 136, 2152
- Mathis et al. (1977) Mathis, J. S., Rumpl, W., & Nordsieck, K. H. 1977, ApJ, 217, 425
- Matsushita et al. (2009) Matsushita, S., et al. 2009, ApJ, 693, 56
- Matsuura et al. (2011) Matsuura, M., et al. 2011, Science, 333, 1258
- Mattsson & Andersen (2012) Mattsson, L., & Andersen, A. C. 2012, MNRAS, 423, 38
- Mattsson et al. (2014) Mattsson, L., De Cia, A., Andersen, A. C., Zafar, T. 2014, MNRAS, 440, 1562
- McKee (1989) McKee, C. F. 1989, in Allamandola L. J. & Tielens A. G. G. M. eds., IAU Symp. 135, Interstellar Dust, Kluwer, Dordrecht, 431
- Michałowski et al. (2010a) Michałowski, M. J., Murphy, E. J., Hjorth, J., Watson, D., Gall, C., & Dunlop, J. S. 2010a, A&A, 522, A15
- Michałowski et al. (2010b) Michałowski, M. J., Watson, D., & Hjorth, J. 2010b, ApJ, 712, 942
- Nagamine et al. (2010) Nagamine, K., Ouchi, M., Springel, V., & Hernquist, L. 2010, PASJ, 62, 1455
- Nagao et al. (2012) Nagao, T., Maiolini, R., De Breuck, C., Caselli, P., Hatsukade, B., & Saigo, K. 2012, A&A, 542, L34
- Nomoto et al. (1982) Nomoto, K., Sugimoto, D., Sparks, W. M., Fesen, R. A., Gull, T. R., & Miyaji, S. 1982, Nature, 299, 803
- Nozawa et al. (2007) Nozawa, T., Kozasa, T., Habe, A., Dwek, E., Umeda, H., Tominaga, N., Maeda, K., & Nomoto, K. 2007, ApJ, 666, 955
- Nozawa et al. (2003) Nozawa, T., Kozasa, T., Umeda, H., Maeda, K., & Nomoto, K. 2003, ApJ, 598, 785
- Omukai (2000) Omukai, K. 2000, ApJ, 534, 809
- Omukai et al. (2005) Omukai, K., Tsuribe, T., Schneider, R., & Ferrara, A. 2005, ApJ, 626, 627
- Ono et al. (2010) Ono, Y., Ouchi, M., Shimasaku, K., Dunlop, J., Farrah, D., McLure, R., & Okamura, S. 2010, ApJ, 724, 1524
- Otsuka et al. (2010) Otsuka, M., et al. 2010, A&A, 518, L139
- Ouchi et al. (2008) Ouchi, M., et al. 2008, ApJS, 176, 301
- Ouchi et al. (2009) Ouchi, M., et al. 2009, ApJ, 696, 1164
- Ouchi et al. (2013) Ouchi, M., et al. 2013, ApJ, 778, 102 (O13)
- Pirzkal et al. (2007) Pirzkal, N., Malhotra, S., Rhoads, J. E., & Xu, C. 2007, ApJ, 667, 49
- Priddey et al. (2003) Priddey, R. S., Isaak, K. G., McMahon, R. G., Robson, E. I., Pearson, C. P. 2003, MNRAS, 344, L74
- Rémy-Ruyer et al. (2013) Rémy-Ruyer, A., et al. 2013, A&A, 557, A95
- Robson et al. (2004) Robson, I., Priddey, R. S., Isaak, K. G., McMahon, R. G. MNRAS, 351, L29
- Rybicki & Lightman (1979) Rybicki, G. B., & Lightman, A. P. 1979, Radiative Processes in Astrophysics (New York: Wiley)
- Schneider et al. (2006) Schneider, R., Omukai, K., Inoue, A. K., & Ferrara, A. 2006, MNRAS, 369, 1437
- Shimizu & Umemura (2010) Shimizu, I., & Umemura, M. 2010, MNRAS, 406, 913
- Soifer et al. (1999) Soifer, B. T., Neugebauer, G., Matthews, K., Becklin, E. E., Ressler, M., Werner, M. W., Weinberger, A. J., Egami, E. 1999, ApJ, 513, 207
- Takeuchi et al. (2005) Takeuchi, T. T., Ishii, T. T., Nozawa, T., Kozasa, T., & Hirashita, H. 2005, MNRAS, 362, 592
- Tinsley (1980) Tinsley, B. M. 1980, Fundamentals of Cosmic Physics, 5, 287
- Todini & Ferrara (2001) Todini, P., & Ferrara, A. 2001, MNRAS, 325, 726
- Valiante et al. (2009) Valiante, R., Schneider, R., Bianchi, S., & Andersen, A. C. 2009, MNRAS, 397, 1661
- Valiante et al. (2011) Valiante, R., Schneider, R., Salvadori, S., & Bianchi, S. 2011, MNRAS, 416, 1916
- Vallini et al. (2013) Vallini, L., Gallerani, S., Ferrara, A., & Baek, S. 2013, MNRAS, 433, 1567
- Verhamme et al. (2008) Verhamme, A., Schaerer, D., Atek, H., & Tapken, C. 2008, A&A, 491, 89
- Wagg & Kanekar (2012) Wagg, J., & Kanekar, N. 2012, ApJ, 751, L24
- Walter et al. (2012) Walter, F., et al. 2012, ApJ, 752, 93
- Weingartner & Draine (2001) Weingartner, J. C., & Draine, B. T. 2001, ApJ, 548, 296
- Yamasawa et al. (2011) Yamasawa, D., Habe, A., Kozasa, T., Nozawa, T., Hirashita, H., Umeda, H., Nomoto, K. 2011, ApJ, 735, 44
- Zhukovska, Gail, & Trieloff (2008) Zhukovska S., Gail H.-P., Trieloff M., 2008, A&A, 479, 453
- Zubko et al. (2004) Zubko, V., Dwek, E., & Arendt, R. G. 2004, ApJS, 152, 211
- Zubko et al. (1996) Zubko, V. G., Mennella, V., Colangeli, L., Bussoletti, E.1996, MNRAS, 282, 1321