Stellar Variability in the VVV Survey: An Update
Resumen
The Vista Variables in the Vía Láctea (VVV) ESO Public Survey consists in a near-infrared time-series survey of the Galactic bulge and inner disk, covering 562 square degrees of the sky, over a total timespan of more than 5 years. In this paper, we provide an updated account of the current status of the survey, especially in the context of stellar variability studies. In this sense, we give a first description of our efforts towards the construction of the VVV Variable Star Catalog (VVV-VSC).
PRESENTACION INVITADA
(1) Pontificia Universidad Católica de Chile, Facultad de Física, Instituto de Astrofísica, Santiago, Chile
(2) Millennium Institute of Astrophysics, Santiago, Chile
Resumen. El Relevamiento Público ESO titulado Variables Vista en la Vía Láctea (VVV) consiste en un relevamiento con resolución temporal del bulbo y disco interno Galácticos en el infrarrojo cercano, cubriendo 562 grados cuadrados del cielo, en un intervalo de tiempo de más de 5 años. En este artículo, entregamos una descripción actualizada del estado actual del relevamiento, especialmente en el ámbito de los estudios de variabilidad estelar. En ese sentido, describimos, por primera vez, nuestros esfuerzos para la construcción del Catálogo de Estrellas Variables del VVV (VVV-VSC).
1. Overview
The Vista Variables in the Vía Láctea (VVV) ESO Public Survey (Minniti et al. 2010; Catelan et al. 2011; Saito et al. 2012; Hempel et al. 2014) is a time-series, near-infrared (IR) survey of the Galactic bulge and an adjacent portion of the inner disk, covering 562 square degrees of the sky. The survey, which is based on images taken with the VIRCAM camera mounted on the VISTA telescope, located in Cerro Paranal, northern Chile, has provided multi-color photometry in 5 broadband filters (, , , , and ), but its main goal is to provide a homogeneous database for variability studies of the observed regions, particularly in the band.
An extensive overview of recent work on stellar variability that has been carried out in the framework of the VVV Survey has been presented by Catelan et al. (2013). Here we provide a brief update on the status of the survey, particularly in regard to our ongoing work on stellar variability.
2. Status of the Survey
Figure 1 shows the complete area covered by VVV, with the different “tiles” (which constitute individually observed fields) indicated as red squares. Each tile covers 1.501 deg2 in the sky, and the survey encompasses 348 tiles in total. For each VVV tile, Figure 1 also shows its ID number (upper label) and the number of epochs in that have been obtained, as of this writing (bottom label). As far as the cadence, Figure 2 shows the delay (i.e., time interval) between two successive epochs in the VVV -band data, color-coded according to the scale on the right of each plot. By the end of the survey, the bulge region will contain between 60 and 100 epochs for each tile, whereas the disk tiles will have epochs each.
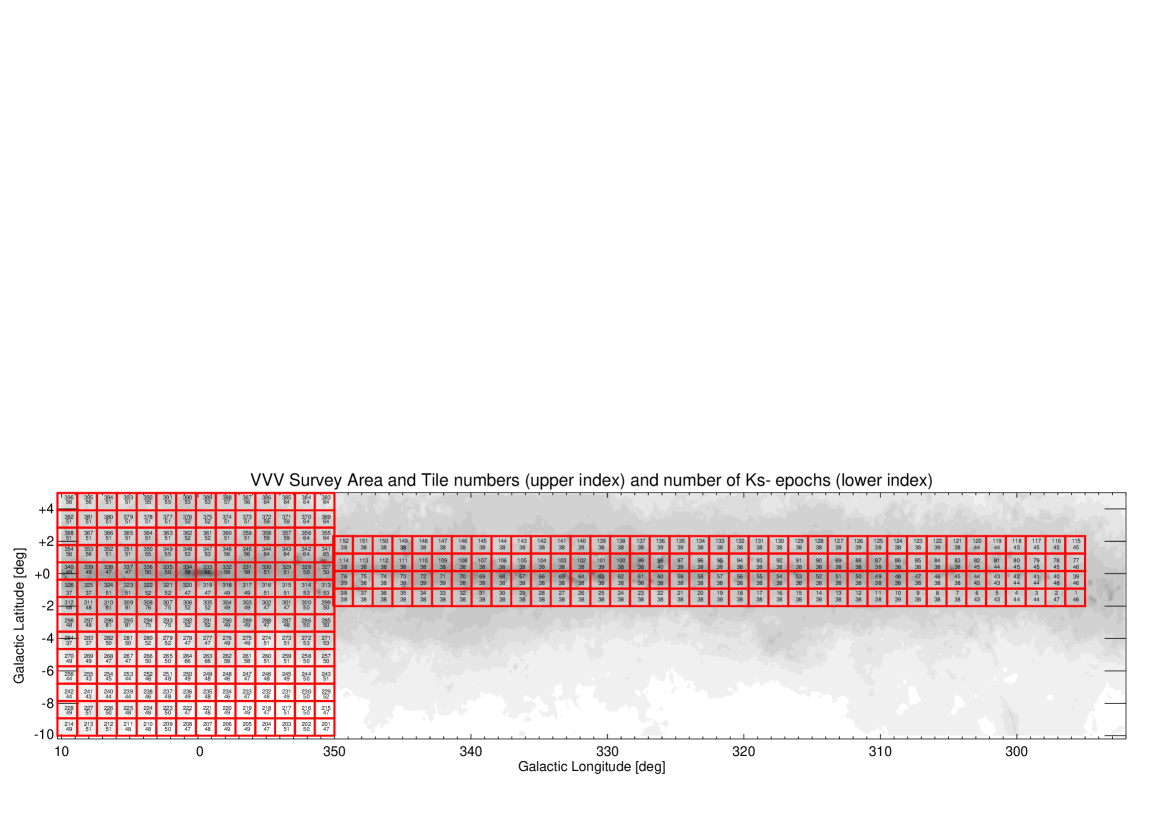
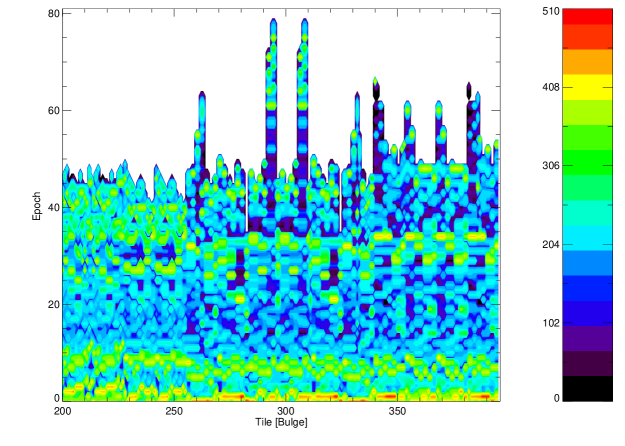
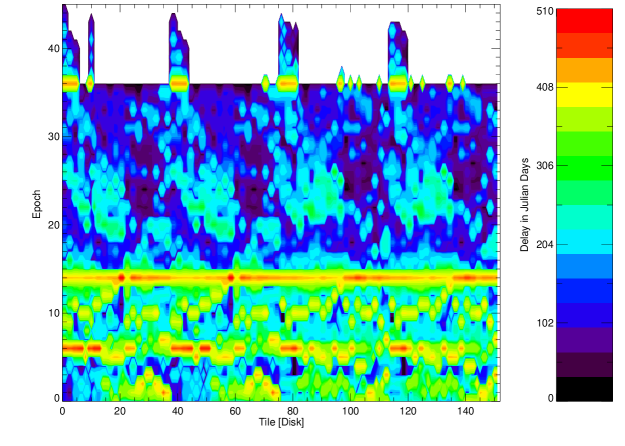
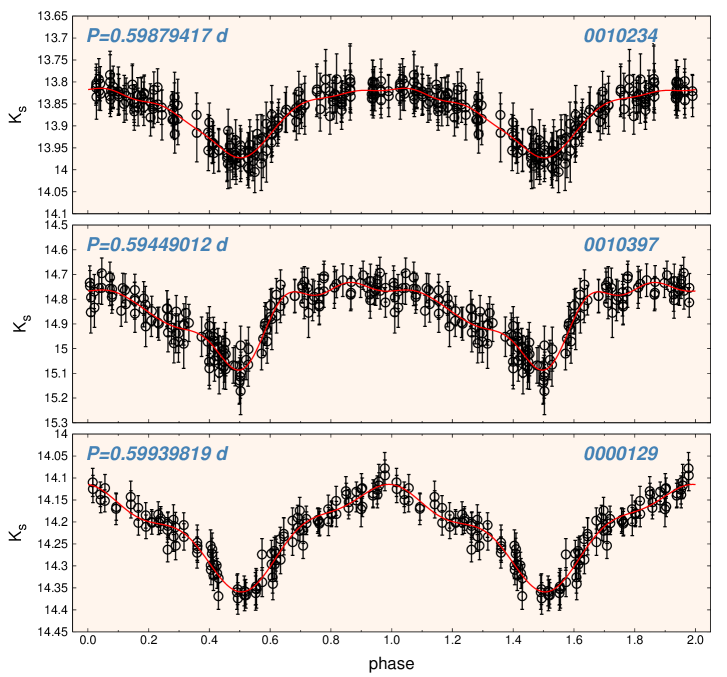
Figure 3 shows some examples of VVV light curves for bulge RR Lyrae stars. These stars had been previously identified by the OGLE-III survey (Soszyński et al. 2011), and so their pulsation periods are accurately known. The VVV light curves of known RR Lyrae with very accurately known periods will enable us to systematically investigate, with unprecedented detail, the near-infrared light-curve properties of these stars: note, for instance, how the three RR Lyrae stars shown in Figure 3 have different light-curve morphologies, in spite of their very similar periods. Such detailed studies of light-curve morphology will be important for constraining pulsation models (e.g., Bono et al. 2000).
Using such well-defined -band light curves, we will also study possible relationships between near-infrared light-curve parameters and the metallicity (in addition to stellar physical parameters), as has been done many times previously in the optical for different types of variables, most notably Cepheids and RR Lyrae stars (e.g., Simon & Lee 1981; Simon & Teays 1982; Jurcsik & Kovács 1996; Kovács & Walker 2001; Morgan et al. 2007; Nemec et al. 2013). In turn, this might prove very useful for studying the metallicity distributions/gradients of the stellar populations that these stars trace –i.e., in the bulge and the thick disk, in the case of RR Lyrae stars (e.g., Layden 1995).
In like vein, by combining RR Lyrae light curves from visual databases and VVV light curves, we are in a position to simultaneously derive extinction and distance to each individual star. This can be achieved by applying the RR Lyrae period-luminosity calibrations in the visual and near-infrared bands, such as provided by Catelan et al. (2004) in , , , and . A first such application has recently been described by Dékány et al. (2013), where bulge RR Lyrae stars in common between the OGLE and VVV surveys were used, together with the Catelan et al. period-luminosity relations, to infer an RR Lyrae-based distance to the Galactic center, estimated at kpc, where the indicated error bars correspond to the estimated statistical and systematic uncertainties, respectively. This is in remarkable agreement with the dynamical value derived by Gillessen et al. (2009), who have obtained kpc by studying the orbits of stars around the Galaxy’s central black hole.
The very complete VVV light curves for many different types of variable stars will also be useful as templates –and indeed, many such reliably classified light curves with complete phase coverage have already been incorporated into the so-called VVV Templates Database (Angeloni et al. 2014),111http://vvvtemplates.org/ whose main purpose is to feed the classification algorithms that are currently being devised, in order to perform automated classification of the expected variable stars detected in the course of the VVV Survey (Catelan et al. 2011, 2013). It is worth noting, in this regard, that our team has also recently completed a variable star catalog (Ferreira Lopes et al. 2014) using data from the 3.8m United Kingdom Infrared Telescope’s (UKIRT) Wide-Field near-IR CAMera (WFCAM; Casali et al. 2007) calibration database. This multi-band database has also yielded high-quality lightcurve templates, which have also been incorporated into the VVV Templates Database (Angeloni et al. 2014).
3. VVV-VSC: The VVV Variable Star Catalog
VVV is a public survey, and so one of our main objectives is to provide a variable star catalog (VSC) that will ultimately be useful to the whole astronomical community. Since we last described our work on stellar variability in the framework of the VVV Survey (Catelan et al. 2011, 2013), we have made much progress at building a comprehensive, science-ready relational database of variable VVV point sources. In its current incarnation, the VVV-VSC uses the high-quality aperture photometry provided by the Cambridge Astronomy Survey Unit (CASU; see Catelan et al. 2013, for more details and extensive references). The pipeline first extracts a master source list from the CASU tile catalogs, and then cross-matches those sources with the individual “pawprints” that are used to build each tile (six pawprints per tile; Minniti et al. 2010). Zero-point errors are then added, a threshold rejection procedure applied, aperture optimization carried out (by means of a minimization of the rms scatter), and descriptive statistics computed. Using a number of variability indices (e.g., Welch & Stetson 1993; Stetson 1996; Ferreira Lopes et al. 2014), a list of variable star candidates is then finally obtained. Typically, we have been encountering of order 50,000 candidates per VVV tile.

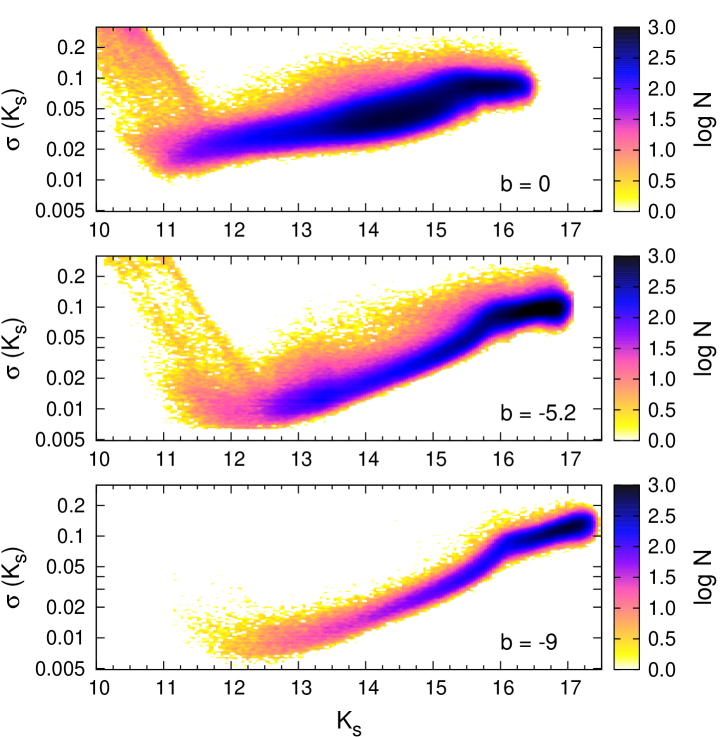
Current tests indicate that our procedure is highly successful at recovering variable stars in general, and particularly periodic sources with sufficiently high amplitudes in the near-IR. At present, the procedure does not perform well for variable sources such as the following: very fast transients coming from below detection; high-proper motion objects; extremely faint sources; very blue, faint sources; highly crowded sources; and very bright variables (i.e., mag), which are commonly saturated in the VVV images. Figure 4 illustrates the mean scatter of the recovered variable star candidates as a function of the mean -band magnitude at three different Galactic latitudes, where the effects of saturation, crowding, and image depth are all apparent.
Naturally, not all variables detected in the VVV data are periodic, and many different examples of variable stars that are not strictly periodic are shown, for instance, in Catelan et al. (2013) and Saito et al. (2013). However, many of the detected variables, such as Cepheids, RR Lyrae, and eclipsing binary stars, are periodic –and thus, once the variable stars are selected following the described procedure, we also carry out a frequency analysis, in order to find periodic and long-term signals, as may be present for each individual star. Figure 5 shows an example of non-periodic transient events detected in our data. To derive the periods, we currently use two different algorithms, namely the generalized Lomb-Scargle periodogram (GLS; Zechmeister & Kürster 2009) and phase-dispersion minimization (PDM; Stellingwerf 1978).
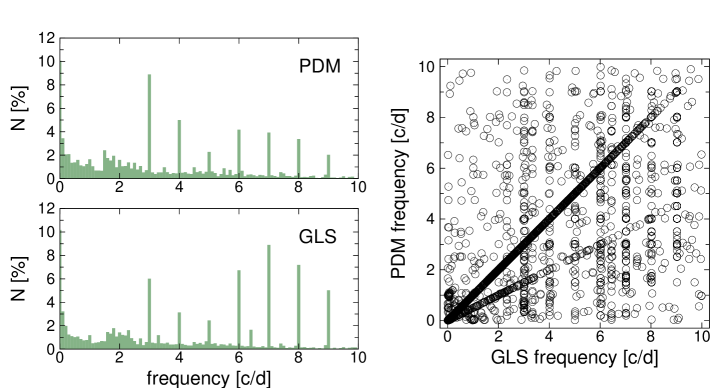
Figure 6 compares the principal frequencies detected by the GLS and PDM methods. Most of the derived periods are in excellent agreement, as indicated by the large concentration of points around the 45-degree line that is overplotted in this diagram. However, a secondary sequence is also present, representing favored GLS periods which are half as long as the corresponding PDM periods. Close inspection of the light curves of stars falling along this sequence reveals that it is mostly caused by eclipsing binary stars for which GLS incorrectly favors a period that is half as long as the true orbital period. This is caused by GLS’s reduced sensitivity to the presence of alternating peaks in the time series, compared to PDM. Note also the presence of a large number of spurious detections at integer and half-integer periods. Most of these variable star candidates are actually not intrinsically variable, but represent instead stars in the vicinity of bright sources, whose spurious, periodic “variability signal” is actually produced by the rotating diffraction spike pattern that is seen around these very bright stars.
By the end of the survey, once the VVV-VSC catalog is completed, we will be in a position to provide a relational database containing variability information for up to several million point sources. Our variability tables will include detailed information on the degree of variability, including for instance mean, median, minimum and maximum magnitudes, standard deviations, rms scatter, skewness, kurtosis, etc.; frequency analysis tables, including information on the power spectra and the periods derived therefrom; and queryable light curves and plots, enabling the display and retrieval of data (both raw and processed) in all 5 bandpasses used in the survey (Sect. 1.).
4. Conclusions
The VVV ESO Public Survey provides a treasure trove of scientific data that can be exploited in numerous different scientific contexts. In terms of stellar variability, the project will provide up to several million calibrated -band light curves for genuinely variable sources, including pulsating stars, eclipsing systems, rotating variables, cataclysmic stars, microlenses, planetary transits, and even transient events of unknown nature. In this paper, we have provided a brief overview of the current status of the survey, as far as detection, cataloging, and classification of variable point sources is concerned.
VVV is a public survey, and so the data will quickly be made available to the entire astronomical community as we move along, thus opening the door to many additional applications and synergies with other ongoing and future projects that target the same fields as those covered by VVV. In this sense, in this paper we have also described our current efforts at creating the VVV Variable Star Catalog (VVV-VSC) –a fully queryable relational database that will allow users to quickly and efficiently retrieve variability and frequency analysis tables for the sources detected, multi-band color information, and –last but not least –the light curves themselves.
Acknowledgements. The VVV Survey is supported by the European Southern Observatory, the Basal Center for Astrophysics and Associated Technologies (PFB-06), and the Chilean Ministry for the Economy, Development, and Tourism’s Programa Iniciativa Científica Milenio through grant P07-021-F, awarded to The Milky Way Millennium Nucleus. M.C. gratefully acknowledges the support provided by Fondecyt through grant #1141141.
Referencias
- Angeloni et al. (2014) Angeloni, R., Contreras Ramos, R., Catelan, M., et al. 2014, A&A, in press
- Bono et al. (2000) Bono, G., Castellani, V., & Marconi, M. 2000, ApJ, 532, L129
- Casali et al. (2007) Casali, M., Adamson, A., Alves de Oliveira, C., et al. 2007, A&A, 467, 777
- Catelan et al. (2011) Catelan, M., Minniti, D., Lucas, P. W., et al. 2011, Carnegie Obs. Conf. Ser., 5, 145
- Catelan et al. (2013) Catelan, M., Minniti, D., Lucas, P. W., et al. 2013, in 40 Years of Variable Stars: A Celebration of Contributions by Horace A. Smith (ed. K. Kinemuchi, H. A. Smith, N. De Lee, & C. Kuehn), p. 141
- Catelan et al. (2004) Catelan, M., Pritzl, B. J., & Smith, H. A. 2004, ApJS, 154, 633
- Dékány et al. (2013) Dékány, I., Minniti, D., Catelan, M., Zoccali, M., Saito, R. K., Hempel, M., & Gonzalez, O. A. 2013, ApJ, 776, L19
- Dekany et al. (2014) Dekany, I., Minniti, D., & Saito, R. K. 2014, ATel, 5954, 1
- Ferreira Lopes et al. (2014) Ferreira Lopes, C. E., Dékány, I., Catelan, M., Cross, N. J. G., Angeloni, R., Leão, I. C., & De Medeiros, J. R. 2014, A&A, submitted
- Gillessen et al. (2009) Gillessen, S., Eisenhauer, F., Trippe, S., et al. 2009, ApJ, 692, 1075
- Hempel et al. (2014) Hempel, M., Minniti, D., Dékány, I, et al. 2014, The Messenger, 155, 24
- Jurcsik & Kovács (1996) Jurcsik, J., & Kovács, G. 1996, A&A, 312, 111
- Kovács & Walker (2001) Kovács, G., & Walker, A. R. 2001, A&A, 371, 579
- Layden (1995) Layden, A. C. 1995, AJ, 110, 2312
- Minniti et al. (2010) Minniti, D., Lucas, P. W., Emerson, J. P., et al. 2010, NewA, 15, 433
- Morgan et al. (2007) Morgan, S. M., Wahl, J. N., & Wieckhorst, R. M. 2007, MNRAS, 374, 1421
- Nemec et al. (2013) Nemec, J. M., Cohen, J. G., Ripepi, V., Derekas, A., Moskalik, P., Sesar, B., Chadid, M., & Bruntt, H. 2013, ApJ, 773, 181
- Robitaille et al. (2008) Robitaille, T. P., Meade, M. R., Babler, B. L., et al. 2008, AJ, 136, 2413
- Saito et al. (2012) Saito, R. K., Hempel, M., Minniti, D., et al. 2012, A&A, 537, A107
- Saito et al. (2013) Saito, R. K., Minniti, D., Angeloni, R., et al. 2013, A&A, 554, A123
- Schlegel et al. (1998) Schlegel, D. J., Finkbeiner, D. P., & Davis, M. 1998, ApJ, 500, 525
- Simon & Lee (1981) Simon, N. R., & Lee, A. S. 1981, ApJ, 248, 291
- Simon & Teays (1982) Simon, N. R., & Teays, T. J. 1982, ApJ, 261, 586
- Soszyński et al. (2011) Soszyński, I., Dziembowski, W. A., Udalski, A., et al. 2011, AcA, 61, 1
- Stellingwerf (1978) Stellingwerf, R. F. 1978, ApJ, 224, 953
- Stetson (1996) Stetson, P. B. 1996, PASP, 108, 851
- Udalski et al. (1992) Udalski, A., Szymanski, M., Kaluzny, J., Kubiak, M., & Mateo, M. 1992, AcA, 42, 253
- Welch & Stetson (1993) Welch, D. L., & Stetson, P. B. 1993, AJ, 105, 1813
- Zechmeister & Kürster (2009) Zechmeister, M., & Kürster, M. 2009, A&A, 496, 577