Resonances of Multiple Exoplanets and Implications for Their Formation
Abstract
Among of the multiple exoplanetary systems confirmed, about of them have neighboring pairs with a period ratio . A significant fraction of these pairs are around mean motion resonance (MMR), more interestingly, peak around 2:1 and 3:2, with a clear absence of more closely packed MMRs with period ratios less than 4:3, regardless of planet masses. Here we report numerical simulations demonstrating that such MMR behavior places important constraints on the disk evolution stage out of which the observed planets formed. Multiple massive planets (with mass ) tend to end up with a 2:1 MMR mostly independent of the disk masses but low-mass planets (with mass ) can have MMRs larger than 4:3 only when the disk mass is quite small, suggesting that the observed dynamical architecture of most low-mass-planet pairs was established late in the disk evolution stage, just before it was dispersed completely.
Subject headings:
planet-disk interactions — planetary systems - protoplanetary disks1. Introduction
Many multiple planetary candidates were discovered by Kepler’s transit search. It has been pervasively suggested that the majority of them are indeed genuine multiple-planet systems (Lissauer et al., 2012; Batalha et al., 2013). A significant fraction of adjacent pairs of planets are in or near mean motion resonances (MMRs) with period ratios around 2:1, 3:2, 5:3, etc. (Lissauer et al., 2011b), although members of most multiple systems do not have nearly commensurable orbits (Mayor et al., 2009).
The MMR of exoplanet systems has been well studied under various perspectives (Goldreich, 1965; Wisdom, 1980; Henrard, 1982; Weidenschilling & Davis, 1985; Ogihara & Ida, 2009; Ogihara et al., 2010; Lee et al., 2013). A widely adopted scenario is that resonant pairs captured each other on their mutual MMRs through convergent migration (Bryden et al., 2000; Kley, 2000; Lee & Peale, 2002b). Migration mechanisms include tidal interaction between very short period planets and their host stars (Schlaufman et al., 2010) as well as protoplanet interaction with their natal disks (Lin et al., 1996). For planets with periods longer than a few days, MMRs provide supporting evidence of the disk migration scenario.
Gas-giant planets with sufficient mass to open gaps in their natal disks undergo Type II migration (Lin & Papaloizou, 1986). Most Kepler candidates have much lower masses and undergo Type I migration (Goldreich & Tremaine, 1980; Ward, 1997; Paardekooper et al., 2011; Kretke & Lin, 2012). In either case, orbital convergence would occur if the inward migration of a planet catches up with that of its siblings closer to the host star or if a planet is trapped at some special disk region and its siblings migrate toward it. Convergent migration leads to the possibility of resonant capture (Lee & Peale, 2002a; Kley et al., 2004).
Many multiple planet systems are indeed locked in or are close to MMRs. The current database on The Extrasolar Planets Encyclopaedia Website (http://exoplanet.eu) contains confirmed multiple planet systems with neighboring pairs. This sample includes 118 systems of 2 planets, 22 systems of 3 planets, 9 systems of 4 planets, 4 systems of 5 planets and 4 systems of 6 planets. Figure 1 shows the distribution of these adjacent pairs as a function of their period ratios, focusing on systems with a period ratio around and less than . Overall, pairs (i.e., of all pairs) have a period ratio around or less than . The subsets of pairs with both planets’ masses and below (designated as gas-giant and low-mass-planet systems respectively) are also shown in Figure 1. Most gas giants are discovered by the radial velocity method. Although their mass determinations are lower limits, this observational bias does not affect their statistics. Most multiple low-mass-planet systems are Kepler candidates. Their mass has been estimated by using an empirical formula to convert a planet’s radius to mass (Lissauer et al., 2011b, a).
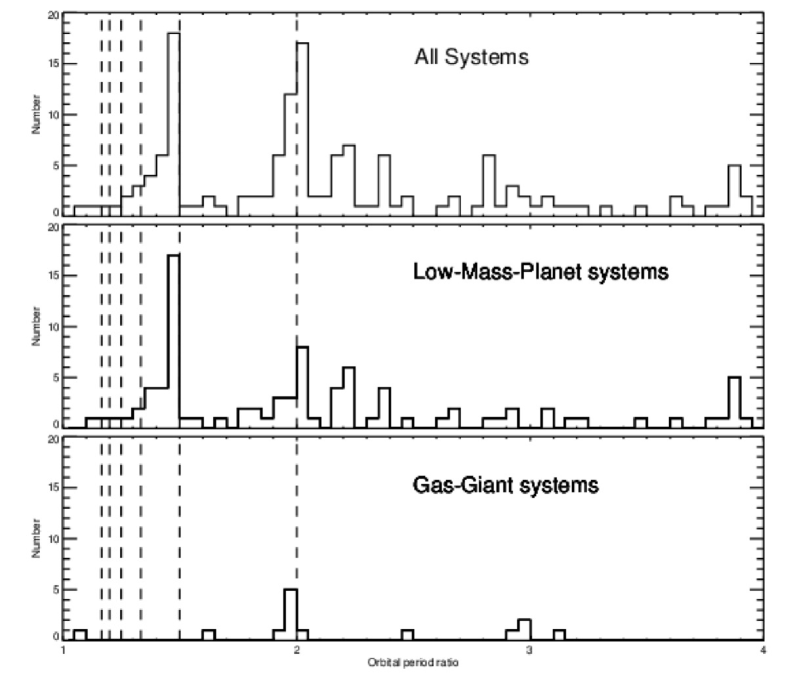
Figure 1 confirms the previously known results that there are statistically clusters of systems in or near the 2:1 and 3:2 MMRs (Lissauer et al., 2011b; Fabrycky & Kepler Science Team, 2012). Since the confirmed Kepler multi-exoplanetary systems measured with TTVs are biasing the samples toward pairs near resonances, the peaks may be overrepresented, but one can still find this statistical clustering feature by including all pairs of Kepler candidates (Goldreich & Schlichting, 2014). The excess near the 3:2 MMR is mostly associated with low-mass-planet systems, whereas that near the 2:1 MMR contains both low-mass-planet and gas-giant systems. If these systems formed through resonant capture during planetary migration, it appears that their asymptotic MMR is a sensitive function of planet mass, orbital characteristics, and relative migration rates (Ogihara & Kobayashi, 2013). Gas-giant pairs such as GJ876 (catalog ) (Laughlin et al., 2001; Rivera & Lissauer, 2001; Laughlin et al., 2005) and HD82943 (catalog ) (Lee et al., 2006; Tan et al., 2013) cluster mostly around the 2:1 MMR because the Type II migration rate is relatively slow compared with the libration timescale for the 2:1 MMR.
However, Type I migration is considerably faster than Type II migration (Lin & Papaloizou, 1986). This allows migrating pairs to bypass wider resonances, with slower libration timescales (Murray & Dermott, 1999), and end up in more tightly packed configurations. It is noteworthy that there is a deficit of both low-mass-planet and gas-giant pairs with period ratios smaller than 4:3. Most Kepler planetary candidates have orbital periods within a few months, and the possibility of not detecting a transiting companion with similar periods is small. Thus, the observed deficit of closely packed resonant pairs and the preferential concentration of lower-mass pairs near the 3:2 MMR relative to the 2:1 MMR are statistically significant.
2. Method
In order to reproduce these observations in terms of the resonant-capture scenario, we use a two-dimensional (2D) module of the LA-COMASS package developed at Los Alamos to investigate the orbital evolution of multiple planets in a protostellar disk. This 2D hydrodynamical polar grid code solves the continuity and isothermal Navier-Stokes equations for gas inside a quasi-Keplerian disk subject to the gravity of a one-solar-mass central star. The motion of multiple planets is calculated with a fourth-order Runge-Kutta solver. The evanescent boundary condition has been implemented in the code to provide wave killing zones at each edge of the disk (de Val-Borro et al., 2006). This code has been used extensively for planet-disk interaction studies (e.g., Li et al. (2009)).
In our simulations, the 2D disk is modeled within the radial range of where is the distance unit in the code. We investigate two main configurations: a disk with multiple gas giants and a disk with multiple planets. For the migration of gas giants, since their Type II migration does not sensitively depend on the disk structure (Lin & Papaloizou, 1986) , we adopt models with smooth density, temperature and viscosity profiles. However, the pace and direction of the Type I migration does depend sensitively on the disk properties and they may be trapped in a disk near the magnetospheric truncation radius, the inner edge of ”dead zone” or other locations such as the boundary between the viscous heating and irradiation heating region (Kretke & Lin, 2012).
For the migration of low-mass planets, we adopt a two-zone disk model based on the prescription for viscosity. In order to approximate a disk structure in which the magnetohydrodynamic turbulence is prevalent throughout the inner region and the mostly neutral outer regions with a “dead” midplane zone, we adopt a high value of for disk radius and for . Typical values of may range from a few stellar radii (for the inner disk boundary or the inner boundary of the dead zone) to a few AUs (for the interface between the viscously heated and irradiated disk regions). In a steady state (Kretke et al., 2009), this prescription leads to a disk surface density () and pressure enhancement across . This distribution affects the direction and pace of low-mass-planets Type I migration (Paardekooper et al., 2010, 2011). The planets are placed relatively far away from so that their initial migration follows the typical Type I migration.
The ratio of disk scale height over disk radius is taken to be a constant of . For all simulations, the initial semi-axis of planet pairs are all beyond . The planets are held on their initial orbits for 1000 Keplerian periods and are released after their disk has adjusted to their perturbation. Our simulated time span is much shorter than the Myr disk depletion timescale. The overall change in the disk mass is modest.
3. Simulation Results
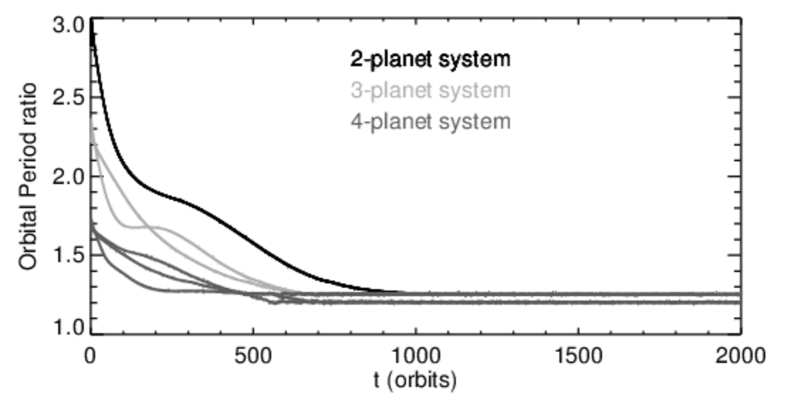
The top panel of Figure 2 shows the evolution of the period ratio of two gas giants under a combination of two different mass ratios and two different sets of initial radial separations, based on the assumption that gas giants are formed independently and separated by modest period ratios (). Since the density waves excited by the two gas giants propagate throughout the remaining ring between them, gas diffuses through the gaps around each planet, in contrast to the shepherded planetary rings. After gas in the ring is depleted, the exchange of angular momentum between planets and inner/outer disks induces them to converge (Bryden et al., 2000). After a few thousand orbits, these gas giants capture each other into a 2:1 MMR. For the gas-giants pairs, we only simulated the convergent migration using a typical set of disk conditions. Since the Type II migration timescale is comparable to or even longer than the viscous evolution timescale of the disk, the gas giants can hardly pass through the 2:1 MMR location unless they are in a disk with extremely high accretion rate.

We also simulated the evolution of initially compact gas-giant pairs (with a period ratio less than 2). Population synthesis models (Ida et al., 2013) indicate that multiple gas-giant systems can form with relatively compact orbits because their progenitor embryos are separated by Hill’s radii before they acquire sufficient mass to accrete gas efficiently. Our extensive simulations show that the orbits of these compact gas-giant pairs are not stable against their intense gravitational perturbation on each other (Zhou et al., 2007). In all cases, one of the two gas giants is scattered to large distances from its initial location. In the inner regions, the scattered planets may resume their migration. If they are able to catch up with their companions, they would eventually settle into the 2:1 resonance. The gas-giants’ resonance “barrier” at the 2:1 MMR is confirmed by these simulations.
Typically the Type I migration timescale of a planet on a circular orbit is , where is the aspect ratio of the disk, is the mass ratio of planet to star, is the location of planets and is the local surface density at . The migration rate also sensitively dependent on the gradient of the surface density and temperature of the disk (Paardekooper et al., 2010, 2011). In this Letter, we only control the migration rate by applying different surface densities. Our disk model leads to the convergent evolution between adjacent pairs of two, three, or four low-mass-planet systems. In these simulations, the mass of each planet is assumed to be and the gas mass within the computational domain is that of the host star. The asymptotic period ratio of all neighboring pairs is around 5:4 or smaller. This ability to closely pack multiple low-mass-planet systems is due to their relatively rapid converging speed.
Such compact systems are rarely found among the Kepler planetary candidates. This apparent discrepancy between observations and simulations can be reduced considerably with much slower converging Type I migration rates. In order to illustrate this conjecture, we have performed a large set of simulations of multiple low-mass systems for a broad range of disk surface densities.
In these simulations, we have chosen the central star mass , and /0.001 for interior/exterior to . In a steady state, the disk accretion rate is given by , where is the disk-to-star mass ratio and is the disk surface density (in ) at . The transition radius is also dependent on the disk accretion rate (Kretke et al., 2009) as . Both the disk surface density normalization and the trapping location (associated with ) decrease as the disk accretion rate diminishes during disk depletion. For example, with , we have and . In our simulations, there is no time evolution of the disk, except for one case shown in Figure 4. In other cases, the accretion rate is constant along the simulations. Varying is equivalent to varying disk mass which is equivalent to varying the establishing time of the planet orbital architecture.
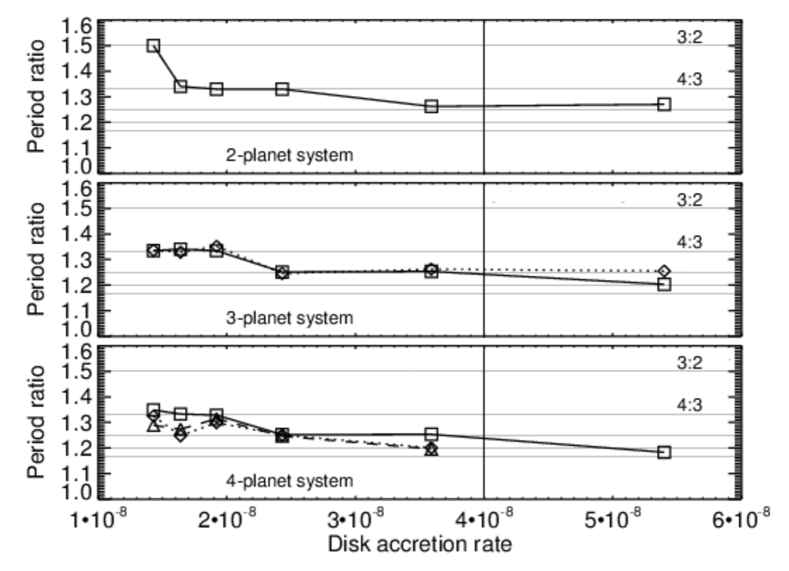
From these simulations, we find that the asymptotic period ratios between adjacent pairs decrease toward unity as the accretion rate increases. Figure 3 shows a general trend that lower disk accretion rates lead to relatively wider spacing for low-mass-planet systems. These results suggest that the accretion rate must be to reproduce the observed paucity. If this paucity is a signature of some alternative dynamical process, like instability, then we can constrain the forming stage of the planetary systems from the accretion rate corresponding to the final period ratio larger than the 4:3 MMR. The corresponding disk-to-star mass ratio in this region is . The reproduction of the observed enhancement of adjacent low-mass-planet pairs with 3:2 MMR requires even lower disk accretion rates () especially in systems with more than two planets. Note that the inferred accretion rates around classical T Tauri stars in the Taurus and Ophiuchus complex (Natta et al., 2006) range mostly between .
In order to extract constraints on the disk accretion rate from Figure 1, we need to verify that the stability of compact systems may be preserved (Gladman, 1993). Systematic studies (Zhou et al., 2007) show that in a gas-free environment, multiple equal-mass low-mass-planet systems with initially circular orbits separated by (where ) become dynamically unstable over the Gyr main sequence lifespan of the host stars. For non-resonant low-mass-planet systems, this stability criterion requires the period ratio to be larger than , which could account for the paucity of multiple systems with a period ratio between adjacent planets smaller than that of the 3:2 MMR. Multiple gas-giant systems with a period ratio between adjacent planets smaller than that of the 2:1 MMR are also unstable on Gyr timescale.
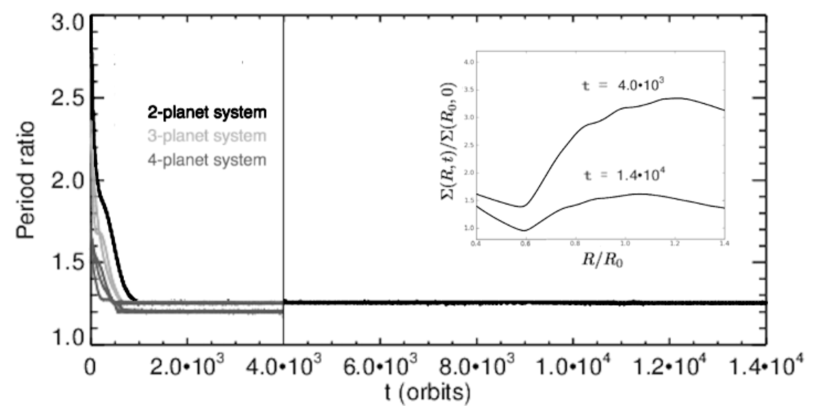
However, the stability of systems with near MMRs may be better preserved against long-term dynamical instability. To illustrate, we select a pair of low-mass planets that are captured into each other’s 5:4 MMR in a disk initially with . Such a system corresponds to . If it is out of resonance, it would become dynamically unstable in orbits in the absence of gas and orbits if it is embedded in a minimum mass solar nebula. We extend our simulation for an additional orbits while the disk surface density is prescribed to decrease exponentially over that timescale. The results in Figure 4 indicate that once the low-mass-planet pairs are captured into a tight MMR, they tend to remain in these MMRs in the absence of major perturbations before the depletion of the disk. However, the later long-term orbital evolution of planets with an absence of gas may break the system. Although we can not exclude the instability criterion as an contribution to the paucity of a period ratio smaller than the 4:3 MMR, we can take this as a clue to the formation stage. If instability is responsible for the paucity, it might indicate that the low-mass-planet pairs with a period ratio larger than 4:3 formed in a somewhat late stage of the disk.
Based on the results from Figures 3 and 4, we infer that, low-mass-planet systems can capture each other into 4:3 and/or 3:2 MMR,s provided they undergo Type I migration when the accretion rate () or the mass of their natal disks is relatively low. The results in Figure 3 indicate that in order for a pair of low-mass planets to attain an asymptotic period ratios of 4:3 and 3:2, the upper limits of the disk-to-star mass ratios are at and , respectively. Since the Type I migration rate is linearly proportional to the product of and , low-mass-planet pairs would approach each other’s 4:3 (or 3:2) MMRs with the same critical relative speed if their (or ). The condition for MMR capture requires that the migration timescale through the characteristic width () is longer than the libration timescale (). If we take into account that the libration time of the lowest-order MMR is and in the first order of the expansion (Murray & Dermott, 1999), the critical condition for the lowest-order of MMR capture would be roughly independent on the planet-to-star mass ratio.
In order to quantify the stage of the disk according to the accretion rate, we use the observations of a relatively young ( Myr) star forming region, Oph (Natta et al., 2006), where the accretion rate around star is about . For , the corresponding value . The accretion rate is also observed to decline over a timescale of 3-5 Myr. We introduce an approximation for the disk accretion rate for , where indicates the age of the disk, , and is the disk lifetime. Figure 5 shows the dependency of final period ratios on the planet masses and the MMRs formation times. It confirms that a relatively large period ratio (such as 3:2) requires the low-mass-planet pairs to have migrated and captured each other late in the disk evolution stage when the disk surface density was sufficiently depleted.

4. Summary
These simulation results for multiple gas-giant and low-mass-planet systems place important constraints on the planet formation stage with respect to the disk evolution. According to the core accretion scenario, the formation of gas giants must be preceded by the emergence of sufficiently massive () protostellar embryos in a gas-rich environment, presumably during the early stage of disk evolution. These cores, if retained in a dense disk, would either congregate and effectively merge near some trapping radius to become cores of proto-gas-giant planets or be mostly scattered into or far from their host stars. A significant “left-over” population would have produced compact pairs with small period ratios that are not consistent with observations. Around stars that only bear relatively low-mass planets, their dynamical configuration may be established during the advanced stages of disk evolution when the disk gas is severely depleted. It is also possible that these low-mass planets were assembled over several millions of years.
References
- Batalha et al. (2013) Batalha, N. M., Rowe, J. F., Bryson, S. T., et al. 2013, ApJS, 204, 24
- Bryden et al. (2000) Bryden, G., Różyczka, M., Lin, D. N. C., et al. 2000, ApJ, 540, 1091
- de Val-Borro et al. (2006) de Val-Borro, M., Edgar, R. G., Artymowicz, P., et al. 2006, MNRAS, 370, 529
- Fabrycky & Kepler Science Team (2012) Fabrycky, D. C., & Kepler Science Team. 2012, in AAS/Division of Dynamical Astronomy Meeting, Vol. 43, AAS/Division of Dynamical Astronomy Meeting, 01.03
- Gladman (1993) Gladman, B. 1993, Icarus, 106, 247
- Goldreich (1965) Goldreich, P. 1965, MNRAS, 130, 159
- Goldreich & Schlichting (2014) Goldreich, P., & Schlichting, H. E. 2014, AJ, 147, 32
- Goldreich & Tremaine (1980) Goldreich, P., & Tremaine, S. 1980, ApJ, 241, 425
- Henrard (1982) Henrard, J. 1982, Celestial Mechanics, 27, 3
- Ida et al. (2013) Ida, S., Lin, D. N. C., & Nagasawa, M. 2013, ApJ, 775, 42
- Kley (2000) Kley, W. 2000, MNRAS, 313, L47
- Kley et al. (2004) Kley, W., Peitz, J., & Bryden, G. 2004, A&A, 414, 735
- Kretke & Lin (2012) Kretke, K. A., & Lin, D. N. C. 2012, ApJ, 755, 74
- Kretke et al. (2009) Kretke, K. A., Lin, D. N. C., Garaud, P., et al. 2009, ApJ, 690, 407
- Laughlin et al. (2005) Laughlin, G., Butler, R. P., Fischer, D. A., et al. 2005, ApJ, 622, 1182
- Laughlin et al. (2001) Laughlin, G., Chambers, J., & Fischer, D. 2001, in Bulletin of the American Astronomical Society, Vol. 33, American Astronomical Society Meeting Abstracts, 1304
- Lee et al. (2006) Lee, M. H., Butler, R. P., Fischer, D. A., et al. 2006, ApJ, 641, 1178
- Lee et al. (2013) Lee, M. H., Fabrycky, D., & Lin, D. N. C. 2013, ApJ, 774, 52
- Lee & Peale (2002a) Lee, M. H., & Peale, S. J. 2002a, ApJ, 567, 596
- Lee & Peale (2002b) —. 2002b, ArXiv Astrophysics e-prints, astro-ph/0209176
- Li et al. (2009) Li, H., Lubow, S. H., Li, S., et al. 2009, ApJL, 690, L52
- Lin et al. (1996) Lin, D. N. C., Bodenheimer, P., & Richardson, D. C. 1996, Nature, 380, 606
- Lin & Papaloizou (1986) Lin, D. N. C., & Papaloizou, J. 1986, ApJ, 309, 846
- Lissauer et al. (2011a) Lissauer, J. J., Fabrycky, D. C., Ford, E. B., et al. 2011a, Nature, 470, 53
- Lissauer et al. (2011b) Lissauer, J. J., Ragozzine, D., Fabrycky, D. C., et al. 2011b, ApJS, 197, 8
- Lissauer et al. (2012) Lissauer, J. J., Marcy, G. W., Rowe, J. F., et al. 2012, ApJ, 750, 112
- Mayor et al. (2009) Mayor, M., Udry, S., Lovis, C., et al. 2009, Astron. Astrophys., 493, 639
- Murray & Dermott (1999) Murray, C. D., & Dermott, S. F. 1999, Solar system dynamics
- Natta et al. (2006) Natta, A., Testi, L., & Randich, S. 2006, A&A, 452, 245
- Ogihara et al. (2010) Ogihara, M., Duncan, M. J., & Ida, S. 2010, ApJ, 721, 1184
- Ogihara & Ida (2009) Ogihara, M., & Ida, S. 2009, in AAS/Division for Planetary Sciences Meeting Abstracts, Vol. 41, AAS/Division for Planetary Sciences Meeting Abstracts #41, 40.05
- Ogihara & Kobayashi (2013) Ogihara, M., & Kobayashi, H. 2013, ApJ, 775, 34
- Paardekooper et al. (2010) Paardekooper, S.-J., Baruteau, C., Crida, A., et al. 2010, MNRAS, 401, 1950
- Paardekooper et al. (2011) Paardekooper, S.-J., Baruteau, C., & Kley, W. 2011, MNRAS, 410, 293
- Rivera & Lissauer (2001) Rivera, E. J., & Lissauer, J. J. 2001, ApJ, 558, 392
- Schlaufman et al. (2010) Schlaufman, K. C., Lin, D. N. C., & Ida, S. 2010, ApJL, 724, L53
- Tan et al. (2013) Tan, X., Payne, M. J., Lee, M. H., et al. 2013, ApJ, 777, 101
- Ward (1997) Ward, W. R. 1997, ApJL, 482, L211
- Weidenschilling & Davis (1985) Weidenschilling, S. J., & Davis, D. R. 1985, Icarus, 62, 16
- Wisdom (1980) Wisdom, J. 1980, AJ, 85, 1122
- Zhou et al. (2007) Zhou, J.-L., Lin, D. N. C., & Sun, Y.-S. 2007, ApJ, 666, 423