AMUSE-Field II. Nucleation of early-type galaxies in the field vs. cluster environment
Abstract
The optical light profiles of nearby early type galaxies are known to exhibit a smooth transition from nuclear light deficits to nuclear light excesses with decreasing galaxy mass, with as much as 80 per cent of the galaxies with stellar masses below hosting a massive nuclear star cluster. At the same time, while all massive galaxies are thought to harbor nuclear super-massive black holes (SMBHs), observational evidence for SMBHs is slim at the low end of the mass function. Here, we explore the environmental dependence of the nucleation fraction by comparing two homogeneous samples of nearby field vs. cluster early type galaxies with uniform Hubble Space Telescope (HST) coverage. Existing Chandra X-ray Telescope data for both samples yield complementary information on low-level accretion onto nuclear SMBHs. Specifically, we report on dual-band (F475W & F850LP) Advanced Camera for Surveys (ACS) imaging data for 28 out of the 103 field early type galaxies that compose the AMUSE-Field Chandra survey, and compare our results against the companion HST and Chandra surveys for a sample of 100 Virgo cluster early types (ACS Virgo Cluster and AMUSE-Virgo surveys, respectively). We model the two-dimensional light profiles of the field targets to identify and characterize NSCs, and find a field nucleation fraction of (at the 1 level), consistent with the measured Virgo nucleation fraction across a comparable mass distribution (). Coupled with the Chandra result that SMBH activity is higher for the field, our findings indicate that, since the last epoch of star formation, the funneling of gas to the nuclear regions has been inhibited more effectively for Virgo galaxies, arguably via ram pressure stripping.
1. Introduction
The assembly and merging history of supermassive black holes (SMBHs) at the centers of massive galaxies appears to proceed in close connection with – and possibly even regulate – the growth of their host galactic bulges. Perhaps the most well known incarnation of this is the “-” relation, or the correlation between the mass of a SMBH and the velocity dispersion of the bulge (Ferrarese & Merritt 2000, Gebhardt et al. 2000, Tremaine et al. 2002, Gültekin et al. 2009, McConnell & Ma 2013; see also Woo et al. 2010, 2013 for M- relation for active galactic nuclei). Tight scaling relations have also been claimed between SMBH mass and bulge mass/luminosity (Marconi & Hunt 2003, Häring & Rix 2004). While the number of reliable dynamical measurements for black hole mass has grown by a factor of about 5 over the last decade or so, it remains unclear whether these power law scaling relations break down at the highest and lowest masses (Lauer et al. 2007, Greene et al. 2010, Kormendy & Ho 2013), and whether classical vs. pseudo-bulges lead to different scaling relations (see e.g. Jiang et al. 2011, Kormendy et al. 2011). Related to the above issues, the black hole mass function itself is largely unconstrained at low masses (Greene & Ho 2007, Kelly et al. 2010), and its determination may in turn be biased by the assumption of a single power-law relation with log-normal scatter (Kelly & Merloni 2012).
Based on detailed morphological analysis of a large sample of nearby early type galaxies spanning over four decades in stellar mass (), Ferrarese et al. (2006a) proposed that, for galaxies with less than a few times , compact stellar nuclei – with half-light radii between 2-5 pc and about 20 times brighter than typical globular clusters (Böker et al. 2004) – may take over from SMBHs as the dominant form of mass aggregation in galactic nuclei (a similar result has been reported for a comparably large sample of spiral galaxies by Rossa et al. 2006).
Most relevant to this paper, detailed work on the occurrence rate and properties of these “nuclear star clusters” (NSCs; Böker et al. 2004; Walcher et al. 2005; Carollo et al. 1998; Matthews et al. 1999; Balcells et al. 2003) was carried out within the Advanced Camera for Surveys Virgo Cluster Survey (ACS VCS; Côté et al. 2004), consisting of dual-band Hubble Space Telescope (HST) ACS observations of 100 early-type galaxies in the Virgo Cluster. Later augmented by the Fornax Cluster Survey (Jordán et al. 2007), the ACS VCS showed that between 66% and 82% of early-type galaxies with absolute B-magnitude host nuclear star clusters, a much larger percentage than had been thought based on ground observations (Côté et al. 2006, Turner et al. 2012). Côté et al. (2007) confirmed that NSCs preferentially reside in galaxies with mag, and found that there is a smooth transition from nuclear light deficit to nuclear light excess with decreasing galaxy luminosity. Also using the ACS VCS data, Ferrarese et al. (2006a) found that the masses of NSCs correlate with the virial masses of their host spheroidal galaxies, and that this relation extends from the scaling relation between SMBH masses and the bulge masses of their host galaxies, possibly indicating a common growth mechanism for NSCs and SMBHs, and perhaps a shared formation mechanism. A common scaling relation for NSCs and SMBHs was also found independently by Wehner & Harris (2006). These results would be consistent with a scenario whereby SMBHs are the dominant – perhaps sole – mode of nuclear mass aggregation at the center of bright massive galaxies, becoming progressively less common down the mass function and disappearing entirely at the faint end, to be replaced by NSCs (the existence of a common scaling relation for the SMBHs and the NSCs has been by challenged by Graham 2012 and Leigh et al. 2012).
Over the last few years, an increasing number of galaxies hosting both NSCs and SMBHs have been identified (Graham & Spitler 2009; Neumayer & Walcher 2012; Gallo et al. 2010). In particular, Seth et al. (2008a) took a somewhat different approach from previous studies by searching for active galactic nuclei (AGN) in 176 galaxies that were previously known to contain NSCs. Based on their analysis, at least 10% of their sample – spanning a wide range in masses and Hubble types – hosts both NSCs and SMBHs, strongly suggesting that galaxies harboring NSCs “have AGN fractions consistent with the population of galaxies as a whole”. In order to better understand the connection between these objects, as well as their respective formation mechanisms, it is desirable to undertake systematic studies that characterize both NSCs and SMBH activity over a sample that is unbiased with respect to nuclear properties.
With the goal of delivering the first unbiased census of low-level SMBH activity in the local universe, the AMUSE-Virgo (AGN Multi-wavelength Survey of Early-Type Galaxies; Gallo et al. 2008, Gallo et al. 2010, Miller et al. 2012b, Leipski et al. 2012 ) survey acquired Chandra X-ray Telescope ACIS (Advanced CCD Imaging Spectrometer) observations for all 100 early-type galaxies targeted by the ACS VCS. As the survey was tailored to probe down to Eddington scaled X-ray luminosities as low as log(/), it provides a relatively inexpensive (i.e., compared to dynamical studies) way to identify SMBHs in formally “inactive” nearby galactic nuclei. While, in the absence of a NSC, the issue of potential contamination to the nuclear X-ray signal from bright low mass X-ray binaries111The sample is comprised of early type galaxies only, ensuring negligible contamination from high mass X-ray binaries. (LMXBs) can be addressed quantitatively based on the known shape and normalization of the X-ray luminosity function of LMXBs (Gilfanov 2004), the presence of a NSC demands a more conservative treatment (see Gallo et al. 2010 for a detailed discussion). For the VCS sample, the combined Chandra and HST data indicate that between 24% and 34% of the targeted galaxies host a bona fide X-ray active SMBH. The fraction of hybrid nuclei, hosting both a SMBH and a NSC is estimated between 0.3% and 7% for below and to be lower than 32% above it (at the 95% confidence level; Gallo et al. 2010).
Born as an extension of AMUSE-Virgo, the AMUSE-Field Chandra survey (Miller et al. 2012a, Miller et al. 2012b, Plotkin et al. 2014 on ULXs, Miller et al. 2014, submitted) was designed to deliver the first measurement of low-level SMBH activity in a field environment. AMUSE-Field targeted a volume-limited sample of 103 nearby field early types spanning over three orders of magnitude in host stellar mass; analogous to the Virgo sample, the field galaxies were selected based solely on optical properties as classified by HyperLeda (Paturel et al. 2003), to create a sample that is unbiased with respect to nuclear properties. For the field sample, 45% 7% of targets were found to host an X-ray active SMBH (Miller et al. 2012a). However, this measurement relies on the assumption that the fraction of field objects hosting a NSC is the same as that found for the AMUSE-Virgo targets. In order to properly compare the incidence of SMBH activity as well as stellar nucleation as a function of host stellar mass for the field sample as well as for Virgo, we acquired dual-band HST/ACS observations for a subsample of the AMUSE-Field galaxies.
Combined, the Chandra/ACIS and HST/ACS data of the Virgo and field samples provide uniform multi-wavelength information on the frequency of SMBHs and NSCs in the local universe, across the mass spectrum and across environment. In this work, we report on the analysis of the ACS observations of the field targets. We model the galaxies’ surface brightness profiles to determine what fraction host NSCs, and compare our results to those from the Virgo cluster. This paper is organized as follows. Section 2 describes our sample, data reduction, and analysis. Section 3 presents our results on the fraction of nucleated (as in hosting a NSC), early-type field galaxies, and our comparison to the fraction found for the Virgo Cluster. Section 4 discusses the implications of these results in the context of NSC formation models.
2. Data Analysis
The full AMUSE-Field sample is comprised of 103 early-type galaxies. We refer the reader to Section 2 of Miller et al. (2012a) for a detailed description of the selection criteria. Our HST program aimed at acquiring dual band images for the galaxies with detected nuclear X-ray emission from Chandra (52 out 103 objects). Out of those, 8 already had archival HST data in both the F475W and F850LP filters. The remaining 44 targets were approved for a Snapshot survey in Cycle 19 (PI: Gallo, ID 12951), and 17 of them were eventually observed, with 340.0 s and 340.060.0 s exposures for the F475W and F850LP filters, respectively (the completion rate was close to 40%, in line with the average value for HST Snapshot programs). For the purpose of estimating the nucleation fraction – regardless of the nuclear X-ray properties – we included 3 additional objects from the AMUSE-Field sample with no X-ray detection, but for which ACS data in the same filters was also available in the archive. To summarize, here we report on HST/ACS observations in the F475W & F850LP filters for 28 (17 new, plus 11 archival) out of the 103 AMUSE-Field galaxies; 25 out of those 28 belong to the subsample of 52 galaxies with X-ray detected nuclei.
Data was re-reduced using the AstroDrizzle pipeline to improve the point spread function sampling from 005/pixel to 003/pixel for all objects. Though all objects were originally classified as early-type in HyperLeda, three objects (ESO 540-014, NGC 0855, NGC 3265) revealed irregular or non-early type morphology in the ACS images, and were thus excluded from further analysis. We refer to the Appendix for descriptions of individual objects. We corrected for extinction within our galaxy using the extinction maps by Schlegel et al. (1998). Additionally, seven objects (NGC 1172, NGC 1370, NGC 3073, NGC 3377, NGC 4036, NGC 4125, and NGC 4278) were identified as suffering from dust contamination through visual inspection. We corrected for dust following the procedure defined in Ferrarese et al. (2006b), which relies on interpolation across dust affected areas. Masses for both galaxies and NSCs were computed using the mass-to-light relations for Sloan g and z bands222Sloan g and z bands are roughly equivalent to HST F475W and F850LP bands, respectively. defined in Table 7 of Appendix A of Bell et al. (2003). In calculating masses, magnitude corrections were made for the slight deviations between the HST F475W & F850LP and Sloan g & z filters (Eric Bell, private communication). Excluding the three aforementioned non-early type galaxies and two galaxies (NGC 1370 and NGC 3073) for which heavy dust contamination around the nucleus prevented us from doing accurate photometry, our analysis is based on a sample of 23 early-type, field galaxies. Properties of individual galaxies are listed in Table 1.
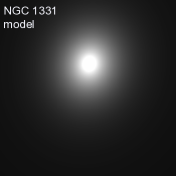
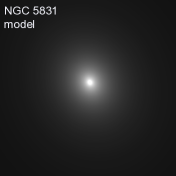
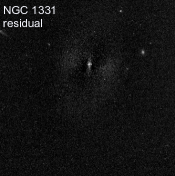
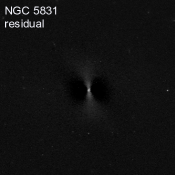
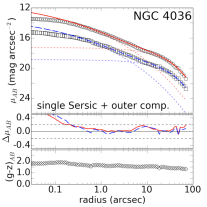
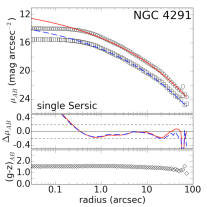
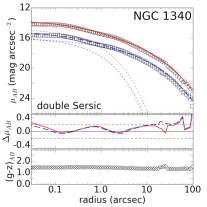
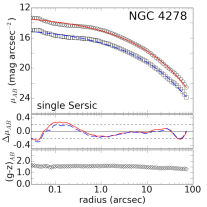
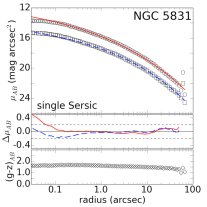
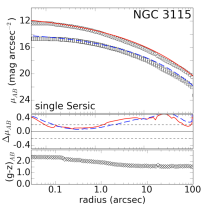
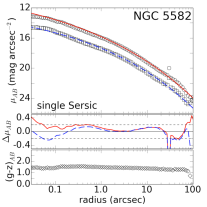
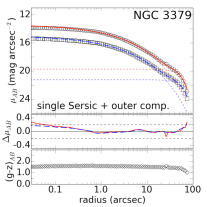
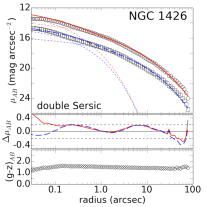
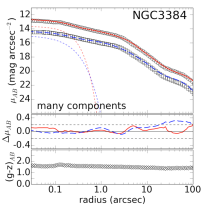
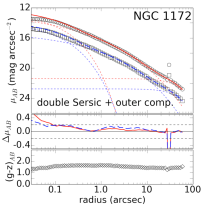
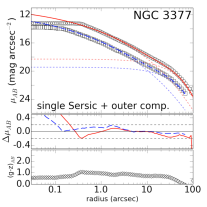
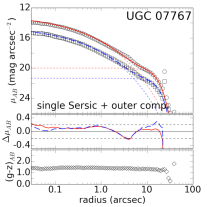
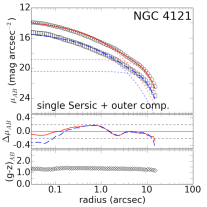
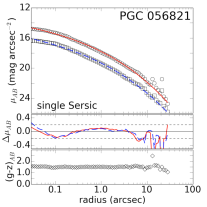
For the purpose of a meaningful comparison to the Virgo Cluster nucleation fraction, we follow the definition of nucleation given by Côté et al. (2006), whereby a nucleated galaxy is one whose inner light profile lies systematically above that of a Sérsic profile333A Sérsic profile is defined as (1) where is the effective radius which encloses half of the model’s light, is the intensity at the effective radius, is the Sérsic index, and is a constant that is dependent on . fit to the galaxy excluding the inner 05. Surface brightness profiles were parametrized with a Sérsic or double-Sérsic profile. We used the IRAF package ELLIPSE to extract azimuthally averaged surface brightness profiles from both the F475W and F850LP images. Two dimensional galaxy models were created with GALFIT (Peng et al. 2002) and then projected onto the 1-D surface brightness profiles. First, we attempted to fit a Sérsic profile to the overall galaxy, excluding the inner 05 (as done in Côté et al. 2006; note that the Field sample was selected to have approximately the same distance as Virgo). When needed, an exponential disk component was added to the model to fit the outer regions of the galaxy (typically beyond 50″, i.e. Dullo & Graham 2013). While GALFIT does not allow the position angle and isophotal ellipticity to radially vary within a component, we did not constrain components to have the same position angle and ellipticity. Example GALFIT models and residuals are shown in Figure 1.
 |
 |
 |
 |
 |
 |
 |
 |
 |
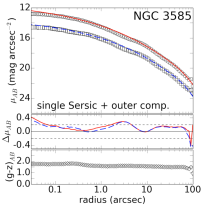
The presence of a NSC is signaled by a light excess with respect to the extrapolation of the best-fit galaxy model within the inner 05. When present, such excess was fit with an additional Sérsic component. A good fit was chosen to have residuals between the data and model consistently between 0.2 and 0.2 mags (similar to the residuals for surface brightness profile fits of Côté et al. 2006). Of the 23 objects for which we carried out a surface brightness profile analysis, we find six of them to be nucleated based on the definition given by Côté et al. (2006). Table 2 lists half-light radii, masses, and colors of these six NSCs.
Figures 2 through 5 show the 1-D surface brightness profiles, along with projected GALFIT models, best fit residuals, and color gradients for the 23 objects for which we were able to perform reliable photometry.
 |
 |
 |
 |
 |
 |
 |
 |
 |
 |
 |
 |
 |
 |
 |
 |
 |
 |
 |
 |
 |
 |
 |
3. Results
3.1. Nucleation Fraction
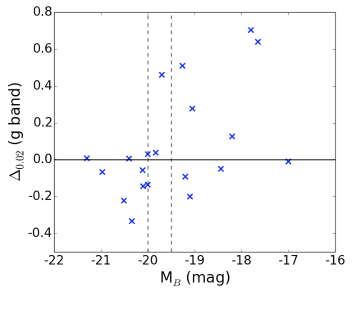
Following Côté et al. (2007), we adopt the parameter to quantify the degree of nucleation in our targets. is defined as where is the total luminosity of the best-fit galaxy model inside a break radius , and is the luminosity of just the outer Sérsic component in this region. Break radius is equal to , which is where deviations from the outer Sérsic profile tend to occur. Negative values indicate nuclear light deficits; these “cored” galaxies tend to be very luminous ellipticals (Graham & Guzmán 2003). A positive value indicates a nuclear light excess, i.e. a NSC.
is plotted against absolute B-band magnitude (from Miller et al. 2012a) in Figure 6 for 22 of the 23 objects in our analysis; we exclude NGC 4697 from this calculation because its nuclear disk precluded us from calculating an accurate value. For objects with nuclear light deficits, we calculate based on the flux inside , as measured by ELLIPSE, as opposed to the best fit model, and use the outer Sérsic component to calculate . The Spearman rank for this relation, calculated using the values measured from the g band data, is 0.36 with a p-value of 0.11, indicating a positive correlation between magnitude and at the 89% confidence level. Unlike Côté et al. (2007), who find a consistent trend from nuclear light deficit to excess with a clearly defined transition region between mag, we do not observe such a sharp transition region for our sample. We check that the same qualitative results hold if the analysis is performed in the band.
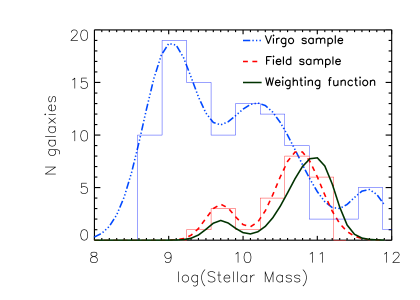
Next, we compare our results for early-type field galaxies to those for the 100 early-type galaxies that compose the ACS VCS (Côté et al. 2004), in order to test whether the nucleation fraction has an environmental dependence. In order to properly account for the different mass distributions across the two samples, we use the procedure outlined in Section 2.2 of Miller et al. (2012b) to match the mass distributions, thus controlling for stellar mass (the mass distribution of the field sample is biased toward high stellar masses, since observations targeted objects with X-ray detections). In brief, we represent the field and Virgo distributions as a sum of Gaussian functions, then use a weighting function (equivalent to the ratio of the field to Virgo Gaussian representations) to draw subsamples from the Virgo sample that have the same mass distribution as the field sample. Figure 7 shows the two distributions and their Gaussian representations, along with the weighting function that is used to draw subsamples from the Virgo cluster sample. We draw 500 such subsamples of 23 Virgo galaxies each, and find that they contain, on average, 7.16 nucleated objects, corresponding to of galaxies (error given at 1 confidence level, Gehrels 1986). For the field, we found six out of 23 objects to be nucleated, corresponding to (errors given at the 1 confidence level). Poisson statistics shows that for an expected value of six nucleated galaxies, there is a 15% chance of finding eight or more nucleated objects in a sample of 23. This argues for no statistically significant difference in the nucleation fractions of the field and Virgo samples.
It is important to note that our fitting procedure differs from that of the ACS VCS; GALFIT performs 2-D modeling, while the ACS VCS fits directly to the 1-D surface brightness profile. Additionally, the ACS VCS only fitted either a Sérsic or core-Sérsic profile to the galaxy surface brightness profile, while we sometimes include an extra component to the outer regions of the galaxy. In order to explore whether this difference in method would result in differing classifications, and if so, whether it would affect the soundness of our nucleation fraction comparison, we tested our fitting procedure on eight ACS VCS objects. For seven out of eight objects, the classifications were consistent between methods. One object, VCC 2095, which was classified by the ACS VCS as nucleated, was found not to be nucleated based on our GALFIT modeling. However, we also failed to identify a NSC when fitting to the 1-D surface brightness profile, as done in Côté et al. (2006). We believe this particular discrepancy to be due to the ACS VCS supplementing the light profile fitting-based classifications with by-eye classifications. To summarize, while there may be slight inconsistencies between classification methods, we expect the effect on the nucleation fraction to be small compared to the 1- error bars, and not to affect the final conclusion that the nucleation fraction is consistent across environment.
3.2. Nucleation and X-ray Emission
As discussed in Section 1, the X-ray luminosity threshold of the Chandra AMUSE surveys demands a careful assessment of the possible contamination of the nuclear X-ray signal from bright LMXBs, as opposed to low-luminosity SMBHs. While Miller et al. (2012a) assumed that the same level of nucleation (and thus contamination) measured in Virgo applied to the field galaxies, the ACS observations presented here enable us to verify this assumption by directly measuring the nucleation fraction. While, in the absence of a NSC, the X-ray Luminosity Function (XLF) – and thus expected number – of LMXBs within the Chandra point spread function simply scales within the enclosed stellar mass (Gallo et al. 2008, 2010, and references therein), the presence of a NSC likely implies an enhanced LMXB contribution to the nuclear X-ray signal, as discussed below. In order to quantify this effect, following Gallo et al. (2010) we adopt the functional shape of the XLF for LMXBs in globular clusters as estimated by Sivakoff et al. (2007) 444Number of LMXBs () , where is the half light radius in pc, and is the stellar mass in units of .. We expect this to be a conservative estimate of the probability of contamination for NSCs, as illustrated by the following discussion.
Pooley et al. (2003) finds that the number of LMXBs in a dense stellar environments scales as the stellar encounter rate, , to the 0.74 power; in turn, , where is the central density, is the system core radius, and is the central velocity dispersion. While the NSCs have higher central densities compared to globulars (NSCs are about an order of magnitude more massive than the typical Milky Way globular cluster (Walcher et al. 2005), the smaller core radii and the observed higher velocity dispersions for the NSCs suggest that globular clusters would have higher encounter rates, and thus a larger number of LMXBs (see Walcher et al. 2005 for velocity dispersions of NSCs; see Harris 1996 for velocity dispersions of Milky Way globular clusters, see Capuzzo-Dolcetta & Miocchi 2008 for a comparison between the NSC and globular cluster profiles).
Table 2 lists probabilities of contamination for objects that contain NSCs and have nuclear X-ray detections. For reference, we point out that NGC 3384, which has the highest expected number of LMXBs of all the hybrid nuclei, is known to host a SMBH based on dynamical evidence (Gebhardt et al. 2003). The listed probabilities have been incorporated in an accompanying paper (Miller et al. , submitted) where the Virgo and field samples combined are used to provide the first measurement of the SMBH occupation fraction in the local universe.
4. Discussion and Conclusions
Detailed morphological analysis of a sample of 100 early type galaxies in the Virgo cluster has shown evidence that the majority of galaxies with stellar mass below host NSCs (e.g. Ferrarese et al. 2006a). In this paper, we explored the possibility of an environmental dependence of the nucleation fraction using dual-band (F475W & F850LP) HST/ACS images of a sample of 28 field early type galaxies out of the 103 galaxies that compose the AMUSE-Field X-ray survey (Miller et al. 2012a). After controlling for different stellar mass distributions, we found there to be no statistically significant difference between the nucleation fraction for field () and Virgo () early-type galaxies (from the ACS VCS survey). Here, we discuss our results in the context of NSC formation theories, and compare the measured nucleation fractions with the active fractions as estimated from X-ray diagnostics.
The mechanism behind the mass assembly and evolution of NSCs is still uncertain, but two prevalent formation theories have emerged. The dissipationless model suggests that NSCs form from the infall of globular clusters through dynamical friction (Tremaine et al. 1975), while the dissipative model posits that NSCs form by gas accumulating at the center of a galaxy (via mergers, i.e. Mihos & Hernquist 1994, or transport of gas in a disk, i.e. Milosavljević 2004) and forming stars in situ. Additionally, both processes may contribute to nucleus formation, and evidence for recurring episodes of star formation and/or distinct kinematics (Rossa et al. 2006; Seth et al. 2008b; Paudel et al. 2011; Seth et al. 2010) – particularly in late-type galaxies – implies that, even if globular cluster infall forms the bulk of the mass in the NSC, some gas needs to accrete to the center and form stars at later times.
Simulations show that in-falling globular clusters can form NSCs with global properties that generally match those of observed NSCs, and can reproduce scaling relations observed between NSCs and their host galaxies (Capuzzo-Dolcetta & Miocchi 2008, Antonini et al. 2012, Antonini 2013, Agarwal & Milosavljević 2011, Gnedin et al. 2013). This formation scenario is consistent with the observed radial distribution of the number of globular clusters near galaxy centers being flatter than that of the spheroidal stellar component with the same age and metallicity (Capuzzo-Dolcetta & Mastrobuono-Battisti 2009), indicative of inner depletion of globular clusters via dynamical processes. There is also evidence, particularly in late-type galaxies, for more recent gas accretion, from observations of multiple stellar populations (e.g. Walcher et al. 2006, Rossa et al. 2006) and kinematic features that cannot be reproduced solely by globular cluster infall (Hartmann et al. 2011). Overall, while globular cluster infall is able to reproduce the bulk properties of NSCs (masses and radii), subsequent injection of gas seems to be necessary to explain the full spectrum of observed properties.
Further information on the nature of nucleation comes from comparing different environments. For example, Turner et al. (2012) explored the nucleation fraction and NSC properties between the Virgo and Fornax early-type cluster members (through the ACS VCS and ACS Fornax Cluster Survey, FCS), and found them to be consistent with each other. They suggest that this agreement in nucleation fraction between the two different cluster environments – with Fornax being substantially smaller, colder and denser than its Northern counterpart – indicates that factors related to large scale environmental properties do not have large effects on the formation of NSCs in early-type galaxies. Although our sample size is smaller than those of both the VCS and FCS, our results confirm and strengthen this hypothesis, as we find no statistically significant difference in the nucleation fraction between the field and the clusters’ samples. In addition, early-type galaxies in both cluster environments as well as the field demonstrate a trend in which their nuclei move from having nuclear light deficits to nuclear light excesses as galaxy luminosity decreases.
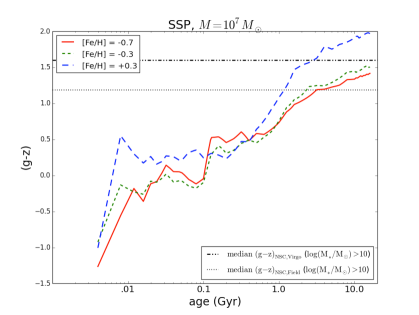
In Figure 8, we explore whether environmental differences are reflected in the colors of field and Virgo NSCs. As discussed by Turner et al. (2012), there is a tendency for Virgo NSCs (displayed as red filled circles) to become redder with increasing host galaxy mass/luminosity (see the caption of Figure 8 for a quantitative analysis). According to single stellar population models (Kotulla et al. 2009), the extremely red colors of the more massive Virgo NSCs (with (g-z) as high as 1.7) can only be achieved in less than a Hubble time for super-solar metallicities (see Figure 9). Thus, Turner et al. (2012) interpret these results as being suggestive of two main channels of growth for NSCs, with low mass nuclei being primarily assembled via globular cluster infall, and higher mass nuclei growing further through subsequent accretion, mergers, and/or tidal torques involving metal-enriched gas. Our sample size is too small to ascertain whether field NSCs (displayed as blue triangles in Figure 8) show the same reddening with host stellar mass. If the higher mass Virgo nuclei do redden as a result of growth through the aforementioned mechanisms, we might expect that NSCs in the field (where events like mergers and tidal torques are less common) show a more constant (g-z) color as a function of stellar mass.

At the same time, highly sub-Eddington SMBH activity, as indicated by X-ray observations, changes with environment. The higher incidence of nuclear X-ray activity in the field sample (50% 7% versus 32% 6%), and the tendency of field galaxies towards marginally higher X-ray luminosity (by 0.38 0.14 dex) for a given host stellar mass, has been interpreted by Miller et al. (2012b) as due to the field galaxies, and their nuclear SMBHs, having access to greater cold gas reservoirs than the cluster galaxies, possibly as a result of enhanced ram pressure in a cluster environment.
Combined, the X-ray and optical diagnostics point toward the following scenario: In the field NSCs, small amounts of gas, possibly from residual star formation, has the potential to keep feeding a nuclear SMBH well after the major NSC mass assembly has occurred. In contrast, gas is more likely to be depleted from cluster members due to ram pressure stripping. Its important to note that the colors of the reddest Virgo NSCs still imply a stellar population that is older than Gyr (Figure 9). This is comparable to the crossing time for a massive galaxy cluster, making it likely that gas could have been stripped between the last episode of star formation and the present day, decreasing the amount of gas available to funnel to the nucleus.
Complementary questions about the interplay between SMBHs, NSCs and globular clusters can potentially be addressed by exploring their relative spatial distribution within clusters. E.g., Peng et al. (2008) presents evidence for an environmental dependence of the specific frequency555Defined as the number of globular clusters normalized to a galaxy luminosity of (Harris & van den Bergh 1981) of globular clusters. They find that Virgo dwarf galaxies with high specific frequencies tend to reside within 1 Mpc of M87, implying that globular cluster formation may be biased toward denser environments. Although Binggeli et al. (1987) found that nucleated galaxies in Virgo are more centrally concentrated than non-nucleated galaxies, Côté et al. (2006) did not replicate this trend, and attribute this finding to the surface brightness limit of Binggeli et al. (1987). However, Côté et al. (2006) used only galaxies with to test this result, corresponding to 40 nucleated galaxies and just 4 non-nucleated galaxies. Whether nucleated galaxies are more centrally concentrated than non-nucleated galaxies, whether this aligns with the concentration of galaxies with higher frequencies of globular clusters, and whether these correlate at all with nuclear SMBH accretion, warrants further investigation.
V.F.B. is supported by the National Science Foundation Graduate Research Fellowship Program grant DGE 1256260. This work was supported in part by the National Science Foundation under grant no. NSF PHY11-25915 and by NASA through grant HST-GO-12591 from the Space Telescope Science Institute, which is operated by the Association of Universities for Research in Astronomy, Inc., under NASA contract NAS 5-26555. J.H.W. acknowledges support by the National Research Foundation of Korea (NRF) grant funded by the Korea government (MEST; No. 2012-006087). V.F.B. thanks Oleg Gnedin for useful suggestions.
| Object Name | R.A. | Decl. | Distance | Nucleated? | |||
|---|---|---|---|---|---|---|---|
| (deg) | (deg) | (Mpc) | (mags) | () | (mags) | ||
| NGC 4125 | 182.025000 | 65.174167 | 23.7 | -21.17 | 11.2 | 1.37 | n |
| NGC 3585 | 168.321250 | -26.754722 | 19.9 | -20.94 | 11.1 | 1.32 | n |
| NGC 4036 | 180.361667 | 61.895833 | 24.2 | -20.7 | 11.0 | 1.41 | n |
| NGC 4291 | 185.075833 | 75.370833 | 32.2 | -20.67 | 10.9 | 1.23 | n |
| NGC 1340 | 52.082083 | -31.068056 | 20.6 | -20.45 | 10.9 | 1.32 | y |
| NGC 4278 | 185.028333 | 29.280833 | 18.5 | -20.40 | 10.8 | 1.39 | n |
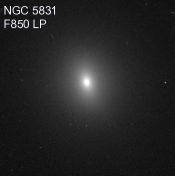
| NGC 5831 | 226.029167 | 1.220000 | 26.9 | -20.25 | 10.6 | 1.23 | n |
| NGC 4697 | 192.149583 | -5.800833 | 12.2 | -20.11 | 10.6 | 1.37 | n |
| NGC 3115 | 151.308333 | -7.718611 | 9.7 | -20.07 | 10.7 | 1.47 | n |
| NGC 5582 | 215.179583 | 39.693611 | 28.2 | -20.02 | 10.6 | 1.14 | n |
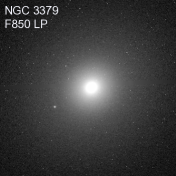
| NGC 3379 | 161.956667 | 12.581667 | 11.1 | -19.83 | 10.7 | 1.46 | n |
| NGC 1439 | 56.208333 | -21.920556 | 26.4 | -19.83 | 10.6 | 1.35 | n |
| NGC 5845 | 226.503333 | 1.633889 | 32.7 | -19.82 | 10.7 | 1.42 | n |
| NGC 1426 | 55.704583 | -22.108333 | 23.3 | -19.66 | 10.6 | 1.37 | y |
| NGC 4648 | 190.435000 | 74.420833 | 25.4a | -19.63 | 10.4 | 1.27 | n |
| NGC 3384 | 162.070417 | 12.629167 | 9.2 | -19.24 | 10.4 | 1.37 | y |
| NGC 1172 | 45.400000 | -14.836667 | 22.0 | -19.09 | 10.3 | 1.30 | y |
| NGC 3377 | 161.926250 | 13.985833 | 10.2 | -18.94 | 10.3 | 1.31 | n |
| UGC 07767 | 188.885000 | 73.674722 | 27.5 | -18.57 | 10.0 | 1.21 | n |
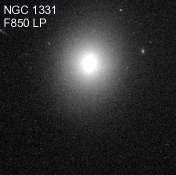
| NGC 1331 | 51.617917 | -21.355278 | 22.9 | -18.14 | 9.8 | 1.06 | y |
| NGC 4121 | 181.985833 | 65.113889 | 24.8a | -18.08 | 9.8 | 1.11 | n |
| NGC 2970 | 145.879583 | 31.976944 | 25.9a | -17.86 | 9.6 | 0.96 | y |
| PGC 056821 | 240.697917 | 19.787222 | 27.0a | -17.18 | 9.5 | 1.23 | n |
| NGC 3265 | 157.778333 | 28.796667 | 23.0a | – | – | – | – |
| NGC 3073 | 150.217083 | 55.618889 | 33.4 | – | – | – | – |
| NGC 1370 | 53.810833 | -20.373611 | 13.2a | – | – | – | – |
| NGC 0855 | 33.514583 | 27.877222 | 12.96 | – | – | – | – |
| ESO 540-014 | 10.298750 | -21.131667 | 22.4a | – | – | – | – |
Notes. R.A. and Decl. are taken directly from the HyperLeda database. Distances are calculated from the redshift-independent mod0 distance modulus in HyperLeda (aFor objects lacking a mod0 distance modulus, the modz redshift-based distance modulus was used). , , and color are determined as described in Section 2.
| Host Galaxy | ) | N() | 1- | |||
|---|---|---|---|---|---|---|
| (pc) | () | (mag) | (%) | |||
| (1) | (2) | (3) | (4) | (5) | (6) | (7) |
| NGC 3384 | 8.0 | 7.8 | 1.46 | .003 | 0.37 | 30.9 |
| NGC 1340 | 131.8 | 8.9 | 1.32 | .010 | 0.10 | 9.5 |
| NGC 1426 | 57.6 | 8.6 | 0.81 | .010 | 0.42 | 34.3 |
| NGC 1172 | 26.1 | 8.3 | 1.05 | .010 | 0.16 | 14.8 |
| NGC 2970 | 11.3 | 7.5 | 0.67 | .008 | 0.01 | 1.0 |
| NGC 1331 | 16.2 | 7.3 | 0.69 | .003 | 0.02 | 1.9 |
Notes. Column 2: Half light radius. Column 3: Mass of NSC. Column 4: (g-z) color of NSC. Column 5: Fraction of host galaxy stellar mass contained in the NSC. Column 6: For objects with nuclear X-ray detections, number of expected LMXBs with within the Chandra PSF. Column 7: For galaxies with nuclear X-ray detections, probability that the Chandra PSF is contaminated by an LMXB of .
References
- Agarwal & Milosavljević (2011) Agarwal, M., & Milosavljević, M. 2011, ApJ, 729, 35
- Antonini (2013) Antonini, F. 2013, ApJ, 763, 62
- Antonini et al. (2012) Antonini, F., Capuzzo-Dolcetta, R., Mastrobuono-Battisti, A., & Merritt, D. 2012, ApJ, 750, 111
- Balcells et al. (2003) Balcells, M., Graham, A. W., Domínguez-Palmero, L., & Peletier, R. F. 2003, ApJ, 582, L79
- Bell et al. (2003) Bell, E. F., McIntosh, D. H., Katz, N., & Weinberg, M. D. 2003, ApJS, 149, 289
- Binggeli et al. (1987) Binggeli, B., Tammann, G. A., & Sandage, A. 1987, AJ, 94, 251
- Böker et al. (2004) Böker, T., Sarzi, M., McLaughlin, D. E., et al. 2004, AJ, 127, 105
- Capuzzo-Dolcetta & Mastrobuono-Battisti (2009) Capuzzo-Dolcetta, R., & Mastrobuono-Battisti, A. 2009, A&A, 507, 183
- Capuzzo-Dolcetta & Miocchi (2008) Capuzzo-Dolcetta, R., & Miocchi, P. 2008, ApJ, 681, 1136
- Carollo et al. (1998) Carollo, C. M., Stiavelli, M., & Mack, J. 1998, AJ, 116, 68
- Côté et al. (2004) Côté, P., Blakeslee, J. P., Ferrarese, L., et al. 2004, ApJS, 153, 223
- Côté et al. (2006) Côté, P., Piatek, S., Ferrarese, L., et al. 2006, ApJS, 165, 57
- Côté et al. (2007) Côté, P., Ferrarese, L., Jordán, A., et al. 2007, ApJ, 671, 1456
- Dullo & Graham (2013) Dullo, B. T., & Graham, A. W. 2013, ApJ, 768, 36
- Ferrarese & Merritt (2000) Ferrarese, L., & Merritt, D. 2000, ApJ, 539, L9
- Ferrarese et al. (2006a) Ferrarese, L., Côté, P., Bonta, E. D., et al. 2006a, ApJ, 644, L21
- Ferrarese et al. (2006b) Ferrarese, L., Côté, P., Jordán, A., et al. 2006b, ApJ, 164, 334
- Gallo et al. (2008) Gallo, E., Treu, T., Jacob, J., et al. 2008, ApJ, 680, 154
- Gallo et al. (2010) Gallo, E., Treu, T., Marshall, P., et al. 2010, ApJ, 714
- Gebhardt et al. (2000) Gebhardt, K., Bender, R., Bower, G., et al. 2000, ApJ, 539, L13
- Gebhardt et al. (2003) Gebhardt, K., Richstone, D., Tremaine, S., et al. 2003, ApJ, 583, 92
- Gehrels (1986) Gehrels, N. 1986, ApJ, 303, 336
- Gnedin et al. (2013) Gnedin, O. Y., Ostriker, J. P., & Tremaine, S. 2013, ArXiv e-prints
- Graham (2012) Graham, A. W. 2012, MNRAS, 422, 1586
- Graham & Guzmán (2003) Graham, A. W., & Guzmán, R. 2003, AJ, 125, 2936
- Graham & Spitler (2009) Graham, A. W., & Spitler, L. R. 2009, MNRAS, 397, 2148
- Greene & Ho (2007) Greene, J. E., & Ho, L. C. 2007, ApJ, 667, 131
- Greene et al. (2010) Greene, J. E., Peng, C. Y., Kim, M., et al. 2010, ApJ, 721, 26
- Gültekin et al. (2009) Gültekin, K., Richstone, D. O., Gebhardt, K., et al. 2009, ApJ, 698, 198
- Häring & Rix (2004) Häring, N., & Rix, H.-W. 2004, ApJ, 604, L89
- Harris (1996) Harris, W. E. 1996, AJ, 112, 1487
- Harris & van den Bergh (1981) Harris, W. E., & van den Bergh, S. 1981, AJ, 86, 1627
- Hartmann et al. (2011) Hartmann, M., Debattista, V. P., Seth, A., Cappellari, M., & Quinn, T. R. 2011, MNRAS, 418, 2697
- Jiang et al. (2011) Jiang, Y.-F., Greene, J. E., & Ho, L. C. 2011, ApJ, 737, L45
- Jordán et al. (2007) Jordán, A., Blakeslee, J. P., Côté, P., et al. 2007, ApJS, 169, 213
- Kelly (2007) Kelly, B. C. 2007, ApJ, 665, 1489
- Kelly & Merloni (2012) Kelly, B. C., & Merloni, A. 2012, Advances in Astronomy, 2012
- Kelly et al. (2010) Kelly, B. C., Vestergaard, M., Fan, X., et al. 2010, ApJ, 719, 1315
- Kormendy et al. (2011) Kormendy, J., Bender, R., & Cornell, M. E. 2011, Nature, 469, 374
- Kormendy & Ho (2013) Kormendy, J., & Ho, L. C. 2013, ARA&A, 51, 511
- Kotulla et al. (2009) Kotulla, R., Fritze, U., Weilbacher, P., & Anders, P. 2009, MNRAS, 396, 462
- Lauer et al. (2007) Lauer, T. R., Tremaine, S., Richstone, D., & Faber, S. M. 2007, ApJ, 670, 249
- Leigh et al. (2012) Leigh, N., Böker, T., & Knigge, C. 2012, MNRAS, 424, 2130
- Leipski et al. (2012) Leipski, C., Gallo, E., Treu, T., et al. 2012, ApJ, 744, 152
- Marconi & Hunt (2003) Marconi, A., & Hunt, L. K. 2003, ApJ, 589, L21
- Matthews et al. (1999) Matthews, L. D., Gallagher, III, J. S., Krist, J. E., et al. 1999, AJ, 118, 208
- McConnell & Ma (2013) McConnell, N. J., & Ma, C.-P. 2013, ApJ, 764, 184
- Mei et al. (2007) Mei, S., Blakeslee, J. P., Côté, P., et al. 2007, ApJ, 655, 144
- Mihos & Hernquist (1994) Mihos, J. C., & Hernquist, L. 1994, ApJ, 437, L47
- Miller et al. (2012a) Miller, B., Gallo, E., Treu, T., & Woo, J.-H. 2012a, ApJ, 747
- Miller et al. (2012b) —. 2012b, ApJ, 745L
- Milosavljević (2004) Milosavljević, M. 2004, ApJ, 605, L13
- Neumayer & Walcher (2012) Neumayer, N., & Walcher, C. J. 2012, Advances in Astronomy, 2012
- Paturel et al. (2003) Paturel, G., Petit, C., Prugniel, P., et al. 2003, A&A, 412, 45
- Paudel et al. (2011) Paudel, S., Lisker, T., & Kuntschner, H. 2011, MNRAS, 413, 1764
- Peng et al. (2002) Peng, C. Y., Ho, L. C., Impey, C. D., & Rix, H.-W. 2002, AJ, 124, 266
- Peng et al. (2008) Peng, E. W., Jordán, A., Côté, P., et al. 2008, ApJ, 681, 197
- Plotkin et al. (2014) Plotkin, R. M., Gallo, E., Miller, B. P., et al. 2014, ApJ, 780, 6
- Pooley et al. (2003) Pooley, D., Lewin, W. H. G., Anderson, S. F., et al. 2003, ApJ, 591, L131
- Rossa et al. (2006) Rossa, J., van der Marel, R. P., Böker, T., et al. 2006, AJ, 132, 1074
- Schlegel et al. (1998) Schlegel, D. J., Finkbeiner, D. P., & Davis, M. 1998, ApJ, 500, 525
- Seth et al. (2008a) Seth, A., Agüeros, M., Lee, D., & Basu-Zych, A. 2008a, ApJ, 678, 116
- Seth et al. (2008b) Seth, A. C., Blum, R. D., Bastian, N., Caldwell, N., & Debattista, V. P. 2008b, ApJ, 687, 997
- Seth et al. (2010) Seth, A. C., Cappellari, M., Neumayer, N., et al. 2010, ApJ, 714, 713
- Sivakoff et al. (2007) Sivakoff, G., Jordán, A., Sarazin, C., et al. 2007, ApJ, 660, 1246
- Tremaine et al. (2002) Tremaine, S., Gebhardt, K., Bender, R., et al. 2002, ApJ, 574, 740
- Tremaine et al. (1975) Tremaine, S. D., Ostriker, J. P., & Spitzer, Jr., L. 1975, ApJ, 196, 407
- Turner et al. (2012) Turner, M., Cote, P., Ferrarese, L., et al. 2012, ApJS
- Walcher et al. (2006) Walcher, C. J., Böker, T., Charlot, S., et al. 2006, ApJ, 649, 692
- Walcher et al. (2005) Walcher, C. J., van der Marel, R. P., McLaughlin, D., et al. 2005, ApJ, 618, 237
- Wehner & Harris (2006) Wehner, E. H., & Harris, W. E. 2006, ApJ, 644, L17
- Woo et al. (2013) Woo, J.-H., Schulze, A., Park, D., et al. 2013, ApJ, 772, 49
- Woo et al. (2010) Woo, J.-H., Treu, T., Barth, A. J., et al. 2010, ApJ, 716, 269
Appendix A Additional Information on Individual Objects
ESO 540-014
This object was misclassified as an early-type galaxy based on observations from the ground. Our observations reveal clumps of star formation and an irregular morphology with no clear nucleus. This object may be considered a dE/dIrr object, as defined in Ferrarese et al. 2006. This object was excluded from analysis.
NGC 0855
This object is highly irregular, with many clumps of star formation extending in a bar across the galaxy. There is also a great deal of dust contamination. This object may be considered a dE/dIrr object, as defined in Ferrarese et al. 2006. This object was excluded from analysis.
NGC 1172
NGC 1172 is elliptical, with dust lanes stretching across the galaxy and diffuse dust throughout. NGC 1172 is nucleated and is well fit by a double Sérsic profile with the addition of low () Sérsic index component to fit the outer regions.
NGC 1331
NGC 1331 is an elliptical galaxy with a nuclear star cluster. This object’s light profile is well fit by a double-Sérsic profile. The nucleus is slightly bluer than the outer regions of the galaxy. In fitting with GALFIT, the Sérsic index of the nucleus had to be held fixed.
NGC 1340
NGC 1340 is nucleated and is well fit by a double Sérsic profile.
NGC 1370
NGC 1370 has an extremely dusty torus. Dust dominates a significant portion of the galaxy in g band, and is visible around the nucleus in z band. This object was excluded from analysis.
NGC 1426
NGC 1426 is nucleated and is best fit by a double-Sérsic profile.
NGC 1439
NGC1439 has a dusty disk around its nucleus extending about .5”. The majority of the galaxy is well fit by a single Sérsic profile, but an extra component is necessary to fit the region past 20”.
NGC 2970
NGC 2970 has a faint spiral structure, perhaps from a merger. It is the bluest object in our sample with a color of 0.96. NGC 2970 has a nuclear star cluster and is well fit by a double-Sérsic profile.
NGC 3073
NGC 3073 suffers from dust contamination throughout the galaxy. It is particularly problematic in g band, but the dust is also visible in z band. This object was excluded from analysis.
NGC 3115
NGC 3115 is a highly edge-on S0 galaxy. The light profile was fit by a Sérsic profile plus an exponential disk.
NGC 3265
NGC 3265 appears to have very diffuse spiral arms and is highly contaminated by dust. This object was excluded from analysis.
NGC 3585
NGC 3585 appears to have a disk. The light profile was fit by a Sérsic profile plus an outer exponential disk component.
NGC 3377
NGC 3377 has an extremely depleted core, which is also very blue. Excluding the central region, we can fit the light profile of this galaxy with a Sérsic profile plus an outer disk component. NGC 3377 has a dust lane as well as diffuse dust contamination in the g band. There is a steep color gradient from the nucleus to the outer regions of the galaxy, with the color getting redder with increasing radius.
NGC 3379
NGC 3379 had a chip gap across the nucleus, but we were able to correct for it. There appears to be a disk in the central 2” but the chip gap covers part of it. This galaxy is well fit by a Sérsic profile plus an outer disk-like component.
NGC 3384
NGC 3384 required a multiple component fit for the outer galaxy, and was found to have a nuclear star cluster. This galaxy has been referenced in the literature as having both a NSC and SMBH (Graham & Spitler 2009).
NGC 4036
NGC 4036 suffers from significant dust contamination, including some contamination surrounding the nucleus. The light profile was fit by a Sérsic component plus an outer exponential disk component.
NGC 4121
NGC 4121 is well fit by a Sérsic component for most of the galaxy plus an outer exponential disk component.
NGC 4125
NGC 4125 suffers from diffuse dust contamination across most of the galaxy and across the nucleus. The light profile is well fit by a single Sérsic component.
NGC 4278
NGC 4278 is well fit by a single Sérsic component.
NGC 4291
NGC 4291 has a depleted core, but the outer regions of the galaxy are well fit by a single Sérsic profile.
NGC 4648
The light profile of NGC 4648 is well fit by a Sérsic component for most of the galaxy plus an outer exponential disk component.
NGC 4697
NGC 4697 has a disk in the center which complicates light profile fitting. The disk extends from 0.4” to 4.0”, corresponding to a dip in the light profile visible in this region. While NGC 4697’s light profile can be fit with a double Sérsic profile, we are not convinced it is truly nucleated as opposed to appearing to have a central light excess with respect to the nuclear disk.
NGC 5582
The light profile of NGC 5582 is well fit by a single Sérsic profile.
NGC 5831
The light profile of NGC 5831 is well fit by a single Sérsic profile.
NGC 5845
NGC 5845 has a dusty disk in the center. Its light profile is well fit by a single Sérsic profile.
PGC 056821
The light profile of PGC 056821 is well fit by a single Sérsic profile. The images of PGC 056821 taken in the F850LP filter suffer from streaks of scattered light from a nearby star. Some of these streaks cut across the galaxy. These were corrected for by masking them, creating a model using the IRAF ELLIPSE and BMODEL tasks, and filling in those regions with the model.
UGC 07767
The light profile of UGC 07767 is well fit by a Sérsic component plus an outer exponential disk component.