5600MB Eindhoven, The Netherlands 22institutetext: Faculty of Science and Technology, Mesa+ Institute, University of Twente, P.O. Box 217,
7500AE Enschede, The Netherlands 33institutetext: Environmental Hydraulics Laboratory, École Polytechnique Fédérale de Lausanne, 1015 Lausanne, Switzerland 44institutetext: Mathematical Institute, University of Oxford, Andrew Wiles Building,
Radcliffe Observatory Quarter, Woodstock Road, Oxford OX2 6GG, United Kingdom 55institutetext: Department of Physics, University of Duisburg-Essen, Lotharstr.1, 47057 Duisburg,
Germany 66institutetext: MSM, MESA+, CTW, Department of Engineering Technology, University of Twente,
P.O. Box 217, 7500AE Enschede, The Netherlands
Recent advances in the simulation of particle-laden flows
Abstract
A substantial number of algorithms exists for the simulation of moving particles suspended in fluids. However, finding the best method to address a particular physical problem is often highly non-trivial and depends on the properties of the particles and the involved fluid(s) together. In this report we provide a short overview on a number of existing simulation methods and provide two state of the art examples in more detail. In both cases, the particles are described using a Discrete Element Method (DEM). The DEM solver is usually coupled to a fluid-solver, which can be classified as grid-based or mesh-free (one example for each is given). Fluid solvers feature different resolutions relative to the particle size and separation. First, a multicomponent lattice Boltzmann algorithm (mesh-based and with rather fine resolution) is presented to study the behavior of particle stabilized fluid interfaces and second, a Smoothed Particle Hydrodynamics implementation (mesh-free, meso-scale resolution, similar to the particle size) is introduced to highlight a new player in the field, which is expected to be particularly suited for flows including free surfaces.
1 Introduction
Particles suspended in fluids are common in our daily life. Examples include human blood (which is to good approximation made of particulate red blood cells suspended in plasma) dupin07 ; Aidun2010 ; kruger2011efficient ; bib:jens-janoschek-toschi-2010b ; goldsmith75 , or tooth paste and wall paint, which are mixtures of finely ground solid ingredients in fluids, as well as e.g. geophysical debris flow leonardi14b . Extreme examples are the sand on a beach or in a desert, when blown away by the wind sauermann00 ; araujo13 , or industrial gas phase synthesis of nanoparticles lorke2012 . Also every-day food-powders as we use them in our kitchen, related to the dispersion of instant-drinks robinson2013dispersion , are challenging examples of particle-fluid systems.
Long-range fluid-mediated hydrodynamic interactions often dictate the behavior of particle-fluid mixtures. The majority of analytical results for the particle scale behavior of suspensions has been obtained in the regime of vanishing Reynolds numbers (viscous flow) since an analytical treatment of the full Navier-Stokes equations is generally difficult or even impossible. Computer simulation methods are indispensable for many-particle systems, for the inclusion of inertia effects (Reynolds numbers ) and Brownian motion (Peclet number of order ). These systems often contain various important time scales that can differ by many orders of magnitude, but nevertheless have to be resolved by the simulation, leading to multiscale problems that can only be solved by a large numerical effort.
Many simulation methods have been developed to simulate particle-fluid mixtures, including the early works by pioneers as Tsuji and Herrmann tsuji85 ; tanaka93 ; kalthoff96 ; sauermann00 . Examples for more recent reviews on research on multi-phase and particle fluid flow models, including their experimental validation and approaches at different scales of resolution are provided in Refs. chu08numerical ; link05flow ; deen07review ; vanderHoef08numerical ; robinson2013ijmf ; araujo13 ; srivastava14 ; leonardi14 ; leonardi14b ; ge14 ; guo14 and references therein. All of them have their inherent strengths but also some disadvantages and can generally be divided into two separate classes: The methods in the first category restrict the treatment of the fluid to approximations of the hydrodynamic interactions between suspended particles only, while the methods in the second category try to tackle all degrees of freedom of the involved fluids by approximating the Navier-Stokes equations.
The simplest approach is Brownian Dynamics which does not contain long-ranged hydrodynamic interactions among particles at all Huetter00 . Brownian Dynamics with full hydrodynamic interactions utilizes a mobility matrix which is based on tensor approximations which are exact in the limit of zero Reynolds number and zero particle volume fraction Petera99 ; Ahlrichs01 . However, the computational effort scales with the cube of the particle number due to the inversion of matrices. Pair-Drag simulations have been proposed by Silbert et al. Silbert97a , and include hydrodynamic interactions in an approximative way. They have focused on suspensions with high densities (up to ) of uncharged spherical colloidal particles. Stokesian Dynamics has been presented by Bossis and Brady in the 80s and applied subsequently e.g. in bossis84a ; sierou01a ; phung96a ; brady:88 . However, as the previous examples, this method is limited to Reynolds numbers close to zero. The inclusion of long-range hydrodynamic interactions causes the computational effort to become very high for dynamical simulations with many particles and makes an efficient parallelization difficult. The method is still widely used due to its physical motivation and its robustness. Boundary-element methods are more flexible than Stokesian dynamics and can also be used to simulate non-spherical or deformable particles, but the computational effort is even higher loewenberg96 .
As stated above, these methods represent the hydrodynamic interactions between suspended particles in an approximative way. If the level of approximation is not well chosen, it might lead to unphysical artifacts, as was shown for example by Knudsen et al. knudsen-werth-wolf:2008 , who studied a system where electrostatic repulsion and hydrodynamic interactions between particles were both important. They found that even for dilute systems some existing models overestimate the effect of hydrodynamic damping leading effectively to an attraction of like-charged particles.
Furthermore, all the methods listed above assume that hydrodynamic interactions are fully developed and that the dynamics of the fluid and of the solved particles can be treated separately. In reality, this is not the case. Hydrodynamic interactions are time dependent due to local stresses at the fluid-particle interfaces. A number of more recent methods attempt to describe the time dependent long-range hydrodynamics properly with the computational effort scaling linearly with the number of particles. These include recent mesoscopic methods like Dissipative Particle Dynamics espanol-warren , the lattice Boltzmann method bib:ladd-verberg:2001 ; bib:jens-komnik-herrmann:2004 , Stochastic Rotation Dynamics/Multi Particle Collision Dynamics gompper-mpc-review:2008 ; A7:Malev99 ; A7:Malev00 ; bib:jens-hecht-ihle-herrmann:2005 ; bib:jens-hecht-bier-reinshagen-herrmann:2006 , or Smoothed Particle Hydrodynamics robinson2013ijmf ; robinson2013sph ; robinson2013dispersion . However, for small Reynolds numbers, the computational gain of these methods is lost due to the additional effort needed to describe the motion of the fluid.
Finite element or finite difference methods need a proper meshing of the computational domain which is not trivial for complicated boundary conditions as in the case of dense suspensions. Therefore, many authors only simulated a limited number of static configurations rather than the full dynamics of the system. Advances in remeshing techniques as well as more powerful computers have allowed to overcome these problems. Also, in order to avoid remeshing at all, uniform grids can often be used Fogelson88 ; Hoefler99 ; Hoefler00-a ; Fonseca04a ; Fonseca04b . Another recent class of simulation methods involves moving grids see Refs. srivastava14 ; guo14 ; ge14 and references therein.
If the particles are very massive and the density of the fluid is very low, a full hydrodynamic treatment of the solvent is not needed anymore. Then, a coarse-grained description of the fluid where the fluid is resolved on a length scale larger than the particles might be sufficient. Much larger systems can be treated this way, but the coarse-graining is justified only in certain situations. An example is the pneumatic transport of a powder in a pipe which is a common process in many industrial applications tanaka93 ; MCN0003 ; Strauss1 ; Strauss2 .
In the remainder of this paper we give examples, where simplified approaches to treat hydrodynamic interactions between suspended particles are supposed to fail. First, we review recent work on the interplay of particle laden flows with fluid interfaces. The simulation method of choice here is based on a Discrete Element Method (DEM) and a multiphase lattice Boltzmann algorithm, where the fluid is resolved considerably better than the particles. Then, we introduce an application of a relatively new player in the field, i.e. a combined DEM and Smoothed Particle Hydrodynamics approach, which has its strength in the simulation of systems containing free fluid interfaces, while leaving the fluid ”meso-resolved”, on a scale slightly larger than the particle diameter.
2 Particles in multicomponent fluid flows
2.1 The lattice Boltzmann – Discrete Element Method
The use of particles as an alternative to surfactants for the stabilization of emulsions is very attractive, such as in the food, cosmetics, and medical industries, where they are used to stabilize barbecue sauces and sun cremes, or to produce sophisticated ways to deliver drugs at the right position in the human body. The microscopic processes leading to the commercial interest can be understood by assuming an oil-water mixture. Without any additives, the phases would seperate and the oil would float on top of the water. Adding small particles, however, causes these particles to diffuse to the interface, which is then stabilized due to a reduced surface energy. If, for example, individual droplets of one phase are covered by particles, such systems are also referred to as “Pickering emulsions” bib:ramsden:1903 ; bib:pickering:1907 . Particularly interesting properties of such emulsions are the blocking of Ostwald ripening and their complex rheology due to irreversible particle adsorption at interfaces.
Computer simulations are a promising route to understanding the dynamics of particle stabilized emulsions. However, the shortcomings of traditional simulation methods quickly become obvious: a suitable algorithm is not only required to deal with simple fluid dynamics but has to be able to simulate several fluid species while also considering the motion of the particles and the fluid-particle interactions. Some recent approaches trying to solve these problems utilize the lattice Boltzmann method (LBM) for the description of the solvents bib:succi:2001 . The LBM is an alternative to conventional Navier-Stokes solvers and is well established in the literature. It is attractive for the current application since a number of multiphase and multicomponent models exist which are comparably straightforward to implement bib:shan-chen:1993 ; bib:shan-chen:1994 ; bib:swift-orlandini-osborn-yeomans:1996 ; bib:lishchuk-care-halliday:2003 . In addition, the method has been combined with a discrete elements method (DEM) to simulate arbitrarily shaped particles in flow and is commonly used to study the behavior of particle-laden single phase flows bib:ladd-verberg:2001 ; bib:jens-komnik-herrmann:2004 ; bib:jens-herrmann-bennaim:2008 .
A few groups combined multiphase lattice Boltzmann solvers with the known algorithms for suspended particles bib:stratford-adhikari-pagonabarraga-desplat-cates:2005 ; bib:joshi-sun:2009 ; bib:jens-jansen-2011 ; bib:jens-frijters-2012a . Here, an approach based on the multicomponent lattice Boltzmann model of Shan and Chen is used which allows the simulation of multiple fluid components with surface tension bib:shan-chen:1993 ; bib:jens-jansen-2011 ; bib:jens-frijters-2012a ; bib:jens-floriang-2011 . The model generally allows arbitrary movements and rotations of arbitrarily shaped hard shell particles. Further, it allows an arbitrary choice of the particle wettability – one of the most important parameters for the dynamics of multiphase suspensions bib:binks-horozov:2006 ; bib:binks:2002 .
In the LBM, the fluid is treated as a cluster of pseudo-particles that move on a lattice under the action of external forces. A distribution function is associated to each pseudo-particle, which denotes the probability to find the particle at a position and with a velocity in direction . Position and velocity spaces are both discretised, where defines the grid spacing, and are the discretised velocity directions. Here, we use a 3D lattice defined by 19 discrete velocities (D3Q19). Together with the discrete time step , the time evolution of is governed by the so-called lattice Boltzmann equation,
| (1) |
The left-hand side of Eq. 1 denotes advection, while the right hand-side is given by the collision operator specifying the collision rate between the fluid pseudo-particles. From now on, we set , and the unit mass to unity for convenience. A simple approximation is the Bhatnagar-Gross-Krook (BGK) operator, , which describes the relaxation of towards its local equilibrium, , on a time scale . The relaxation time defines the macroscopic dynamical viscosity via , where is the lattice speed of sound. The equilibrium distribution is given by a truncated and discretized Maxwell-Boltzmann distribution bib:succi:2001 .
In the Shan-Chen multi-component model bib:shan-chen:1993 , each species of miscible or immiscible fluids is described by a set of distribution functions . As a consequence, lattice Boltzmann equations with relaxation times have to be iterated. The interaction between the fluid species is mediated via a local force density,
| (2) |
which is then added to the right hand side of Eq. 1. Here, the contributions of all species are taken into account, and the force density acting on species is obtained. The sum runs over all neighbouring sites of site . is a coupling constant defining the interaction strength between species and . It is related to the surface tension between both species. The pseudopotential is a function of the density , in our case . It defines the equation of state of the multicomponent system. The Shan-Chen model belongs to the class of front capturing methods. It is suitable to track interfaces for which the topology evolves in time, for example, the deformation or even breakup of a droplet in a shear flow – as in the current section.
If there is no clear scale separation between immersed particles and the lateral interface extension, it may be necessary to model the particles explicitly. Here, we consider an ensemble of particles with well-defined wetting behaviour. The particles themselves may have a complex shape and can be supplied with a constitutive model (of which the simplest is a rigid particle model as we use it here). There are several approaches to simulate a system of two immiscible fluids and particles. One example which has recently been applied by several groups is to couple Molecular Dynamics (MD) or the Discrete Element Method (DEM) to the LBM bib:jens-jansen-2011 ; bib:jens-frijters-2012a ; bib:jens-floriang-2011 ; bib:stratford-adhikari-pagonabarraga-desplat-cates:2005 ; bib:kim-stratford-adhikari-cates:2008 ; bib:joshi-sun:2010 ; bib:joshi-sun:2009 . The advantage of this combination is the possibility to resolve the arbitrarily shaped particles as well as both fluids in such a way that all relevant hydrodynamical properties are included.
The suspended particles are discretised on the lattice of the fluid solver. Following the approach originally proposed by Ladd bib:ladd-verberg:2001 , populations propagating from fluid to particle sites are bounced back in the direction they came from. Then they receive additional momentum due to the motion of the particles. In order to satisfy the local conservation laws, linear and angular momentum contributions are assigned to the corresponding particles as well. These in turn are used to update the particle positions and orientations. In the multi-component algorithm used here, the outermost sites covered by a particle are filled with a virtual fluid corresponding to a suitable average of the surrounding unoccupied sites. This approach provides accurate dynamics of the two-component fluid near the particle surface. The wetting properties of the particle surface can be controlled by shifting the local density difference of both fluid species which leads to a well-defined contact angle on the particle surface bib:jens-jansen-2011 ; bib:jens-floriang-2011 ; bib:jens-frijters-2012a .
All simulation algorithms for suspensions combining a DEM for the suspended particles with a discretized solver of the underlying Navier-Stokes dynamics suffer from the finite resolution of the fluid solver: when two particles approach each other, there is always a distance below which the fluid solver is not able to resolve the hydrodynamic interactions anymore. This generally causes a depletion interaction between particles which one can overcome by adding a lubrication correction to the DEM part of the algorithm which acts on very small distances Nguyen2002 ; bib:jens-jansen-2011 ; bib:jens-floriang-2011 ; bib:jens-janoschek-toschi-2014 .
2.2 Dimensionless numbers
Here, we present as an example an application where the particle-laden flow needs to be treated by an algorithm which is able to handle moderate Reynolds numbers as well as multiple fluid phases. This section represents a summary of some results given in more detail in a recent article by Frijters et al. bib:jens-frijters-2012a and the reader is referred to this article for details of the implementation and simulation parameters. A fraction of the interface of a droplet is covered with particles while a shear flow is imposed on a second fluid surrounding the droplet. This shear flow causes the droplet to deform – a process which is common in the transport of particle stabilized emulsions or their production process. The deformation of the droplet can be quantified using the dimensionless deformation parameter
| (3) |
introduced by Taylor bib:taylor:1932 ; bib:taylor:1934 , where is the length and is the breadth of the droplet. A deformed droplet has lost its spherical shape and thus gains a preferred alignment. In the limit of small deformations, Taylor predicts a linear dependence of the deformation of a droplet on the capillary number (see Eq. 4), with a particularly simple form for equiviscous fluids, i.e. . Due to the finite system size, we define the capillary and Reynolds numbers in terms of an effective shear rate , which is measured at the interface of the droplet during the simulation instead of the shear rate applied via the moving boundaries:
| (4) |
where is the dynamic viscosity of the medium, is the radius of the initial – undeformed, hence spherical – droplet and is the surface tension. We also define the ratio of the droplet and medium viscosity in all presented data. The effective Reynolds number is varied between approximately .
2.3 Distribution of nanoparticles
To understand the effect of nanoparticles on the deformation properties of the droplet, we first discuss how they position themselves at and move over the droplet interface as the droplet is sheared.
| a) | |||
|---|---|---|---|
 |
 |
 |
|
| b) | |||
 |
 |
 |
|
| c) | |||
 |
 |
 |
|
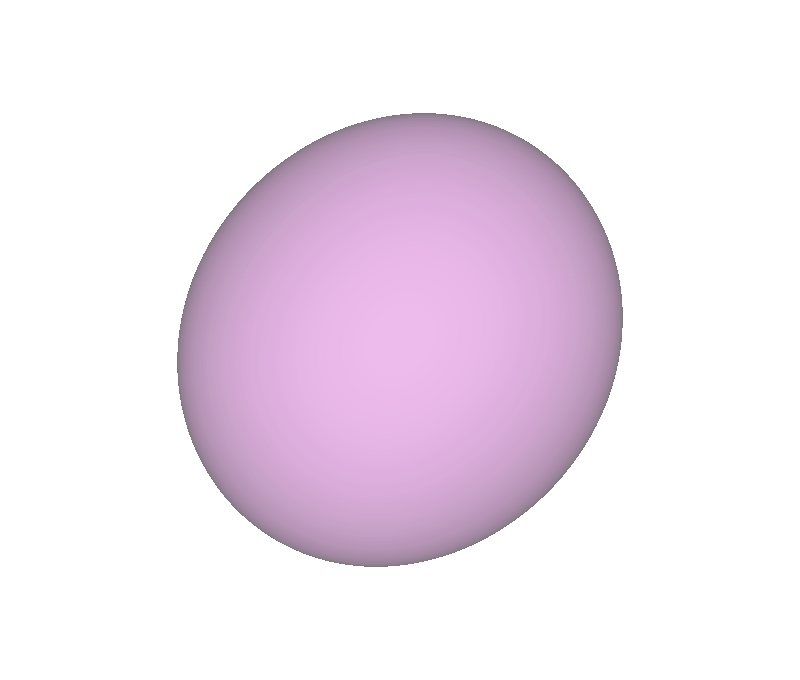
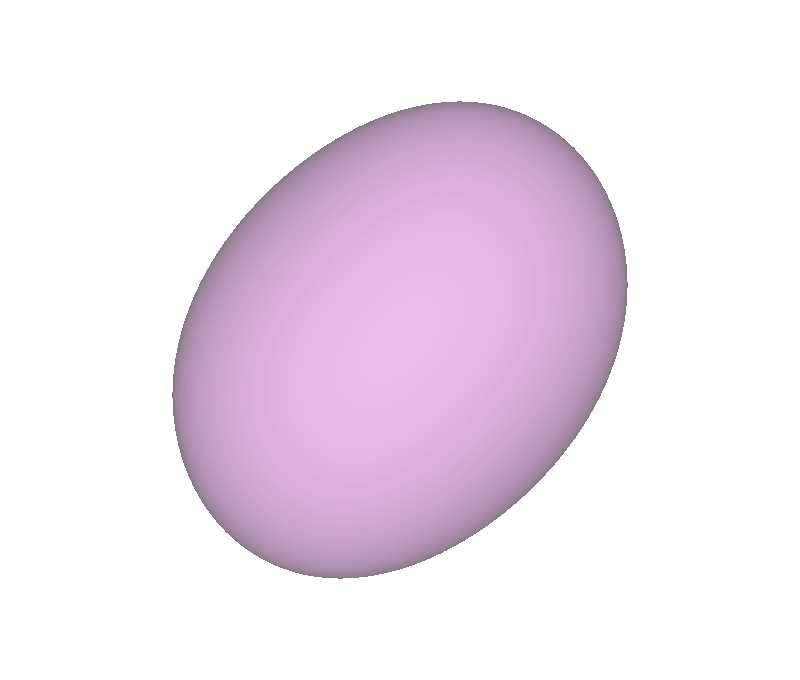
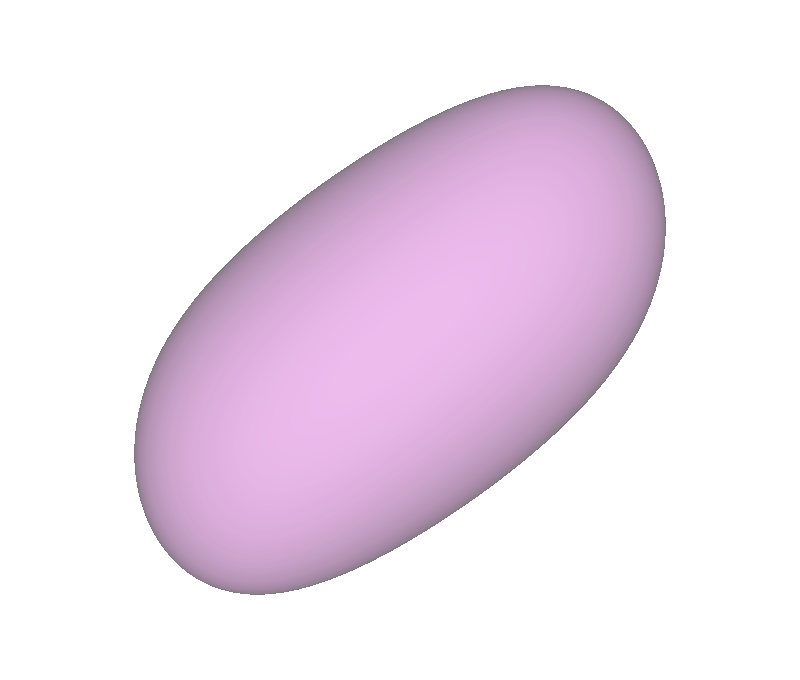
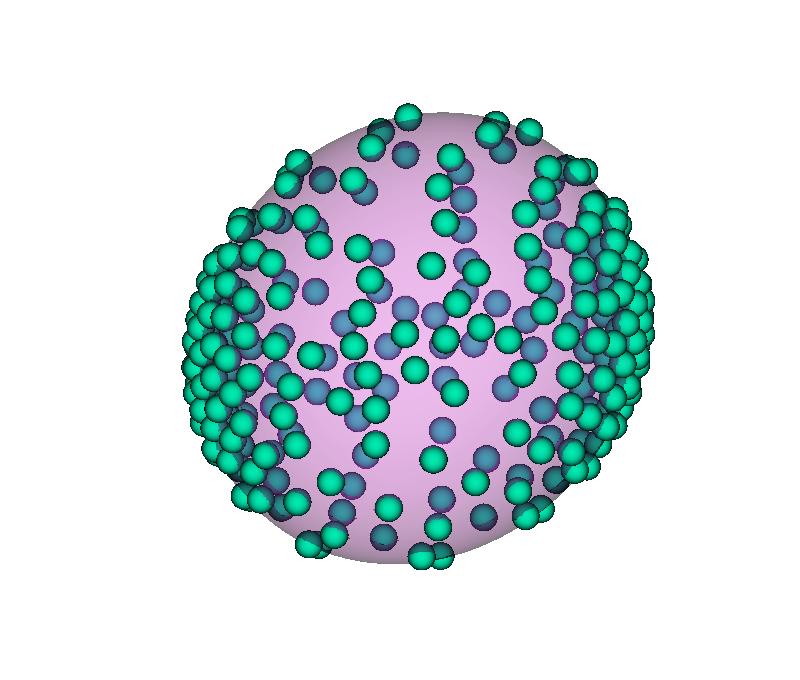
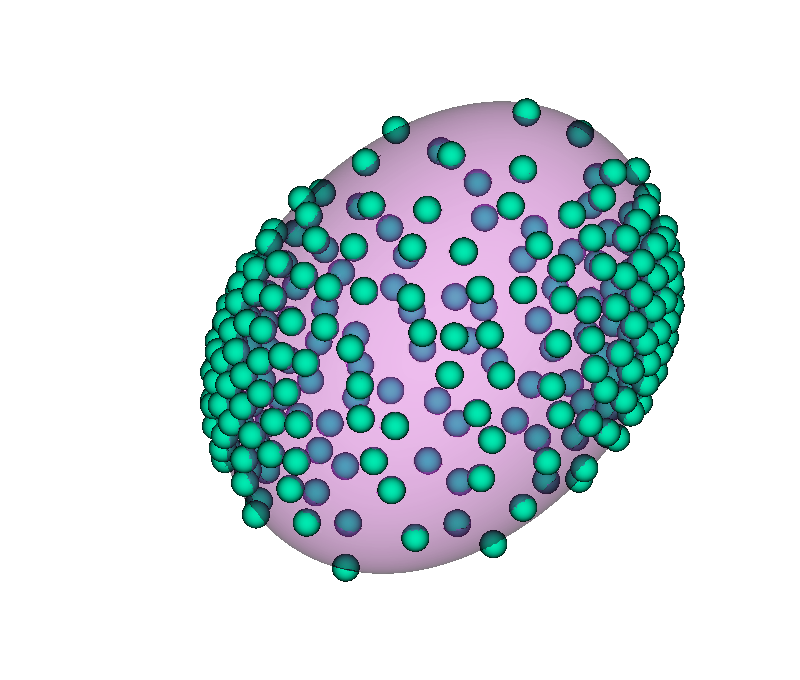
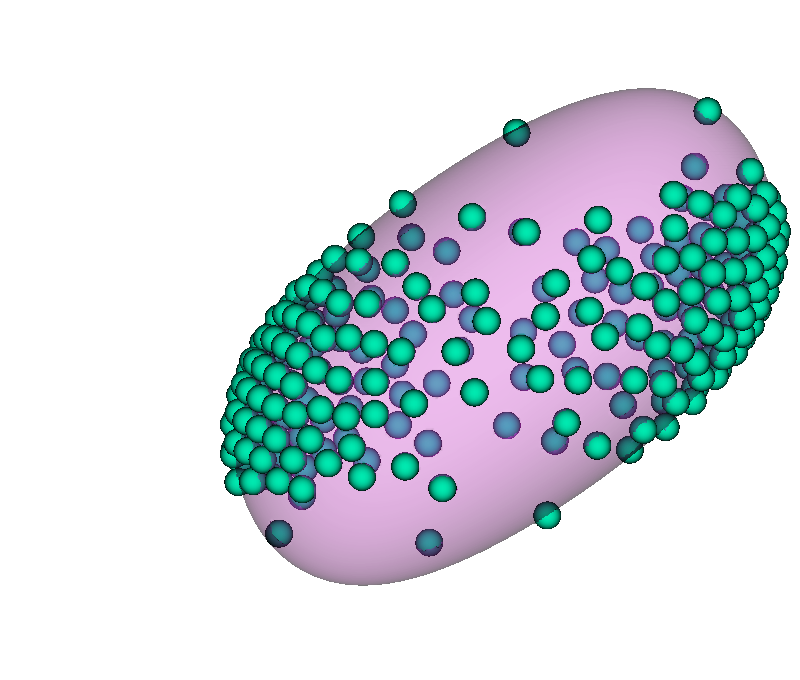
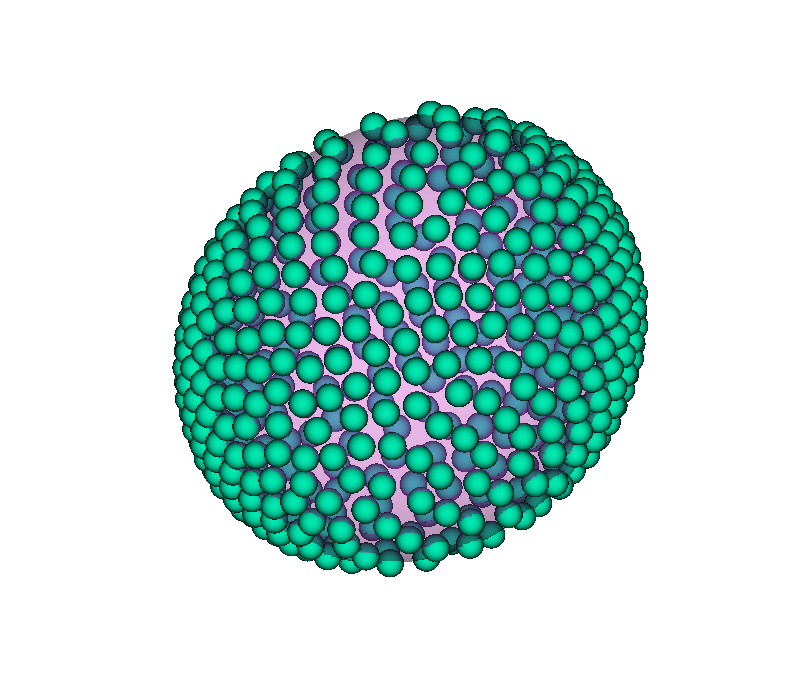
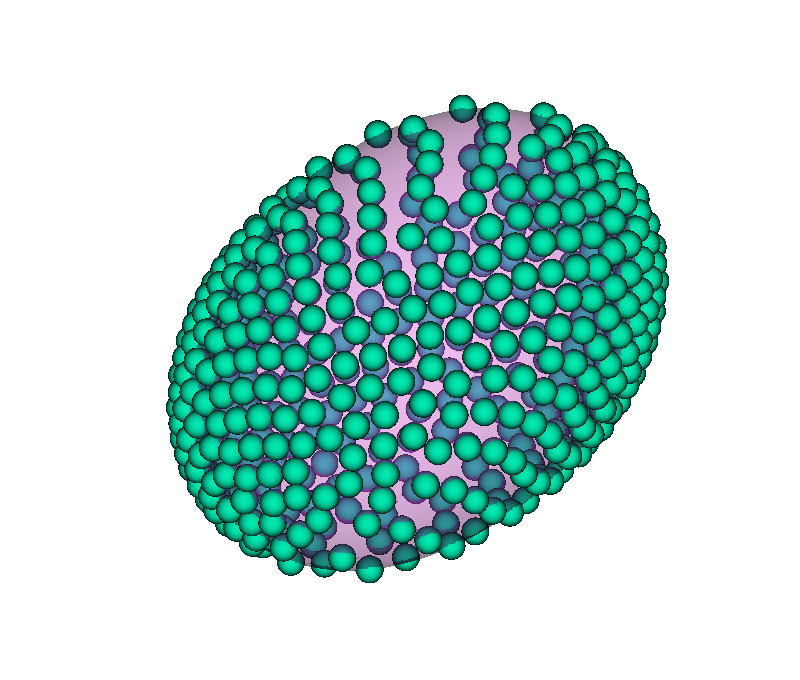
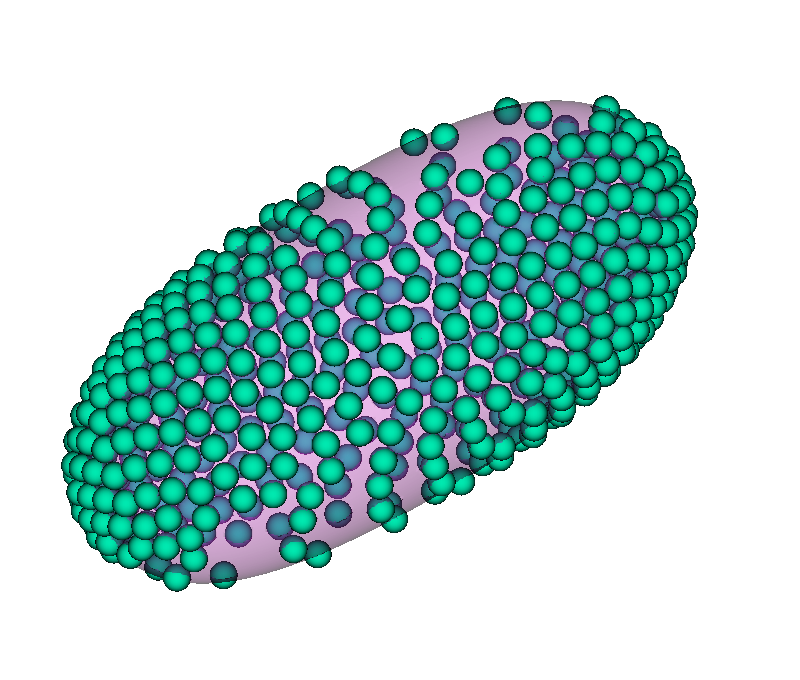
The fluid-fluid interaction strength is held fixed at . The particles have a radius of and are neutrally wetting (). We choose their mass to be , i.e. identical to the fluid mass density. The introduction of finite-sized particles introduces a lower bound on how small the simulation volume can be to accomodate enough particles on the interface and to avoid finite-size effects. For this reason, the simulation volume is chosen to be , , with an initial droplet radius of , still keeping it as small as possible to avoid excessive calculation time. The number of particles is varied as , , , , , and , which results in a surface coverage fraction of up to . The capillary number is changed by changing the shear rate. Some examples of the deformations thus realised are shown in Fig. 1, for , , and (a), (b) and (c).
When a droplet is sheared, its interfacial area increases due to the resulting deformation, and more space is available for the particles to move freely over the interface (cf. Fig. 1). However, even for high particle coverages and shear rates, detaching particles from the interface remains practically impossible. The particles are swept over the interface with increasing velocity as they move away from the center plane of the system and up the shear gradient. If the particles would not be affected by the shear flow, they would prefer to occupy interface with high local curvature as can be explained by a geometrical argument: the interface removed by a spherical particle at a curved interface is larger than the circular area removed from a flat interface, and this effect gets stronger as curvature increases. This explains why in this dynamic equilibrium, most particles can be found at the tips of the droplet. This can be observed in Fig. 1 b) at high capillary number.
Even though the overall structure of the particles on the droplet interface remains stable over time, individual particles move over the interface, performing a quasi-periodic motion. However, this effect is qualitatively different from the tank-treading behaviour observed in, for example, vesicles bib:kaoui-harting-misbah:2011 . While tank-treading vesicles are characterized by a constant frequency of rotation for all points on their membrane, this is not the case for the particle covered droplets: The rotational frequency is not constant for all particles, instead showing a dependence on the position of the particle, normal to the shear plane. The deformation is highest at the center of the droplet surface, giving particles greater options for mobility that are also better-aligned with the shear flow, leading to increased particle velocities.
2.4 Droplet deformation and inclination


The linear dependence of the deformation parameter on the effective capillary number introduced above is recovered in our simulations for low capillary number and low particle coverage (cf. Fig. 2, left). When the coverage fraction grows beyond the deformations in this regime increase with increasing and constant capillary number.
Combining Eqns. 4 gives a relation between the capillary and Reynolds number:
| (5) |
As we change the capillary number explicitly by changing the shear rate, the Reynolds number is proportional to the capillary number for a fixed value of the surface tension. Inertial effects increase the deformation, thus the deformations at high capillary number are higher than predicted by the linear relation of Taylor. Furthermore, since the nanoparticles do not affect the surface tension, all curves of the Reynolds number versus capillary number have the same slope (cf. inset of Fig. 2(left) and Eq. (5)). This implies that the increased deformation in the case of added nanoparticles is not caused by changes in inertia of the fluids. On the other hand, the inertia of the particles themselves plays a decisive role here. We have investigated the dependence of the droplet deformation on the size and mass of the particles. Particle radii have been varied between and at this has led to only a small change in . Yet, changing the mass of the particles directly has a substantial effect. We have varied the mass of the particles over two orders of magnitude, as shown in Fig. 2(right). and are kept constant and we have rescaled the mass scale with the reference mass: . The particles are accelerated as long as they are on the part of the droplet interface that experiences a shear flow at least partially parallel to the particle movement. Eventually, particles have to “round the corner” and are forced to move perpendicular to or even antiparallel to the shear flow. The increased inertia of heavier particles makes it more difficult to change the movement of these particles, leading to a situation where the droplet interface is in fact initially dragged farther away in the direction of the shear flow instead. This process is balanced by the surface tension as the surface area increases. This then explains the increase of deformation with increasing particle mass. As our deformation is increased substantially, the system size limits the deformation we can induce. Therefore, the values presented here are underpredictions of the actual effect of increased mass at high deformations, and might indeed hide a breakup event.
3 Meso-resolved Particle-Fluid Method
This section is based on Refs. robinson2013ijmf ; robinson2013sph ; robinson2013dispersion , where a meso-scale solver for particles dispersed in a fluid was presented. Both phases are tackled by particle-based methods —which facilitates their coupling—where the fluid has a resolution somewhat larger than the discrete phase.
The SPH-DEM formulation is applied to several test cases for verification and validation, before it is used to predict a dispersion experiment with free-surfaces involved, which shows the quality of this particle-based method. The agreement between model and simulation is very good, however, the feature of lift-off of the packed bed is not reproduced yet. This can have various reasons, since some features like the interstitial gas, the surface tension and the polydispersity of the grain-packing, are not implemented yet and are subject of ongoing research.
3.1 The Smoothed Particle Hydrodynamics – Discrete Element Method
We present a discrete particle method (DPM) based on the coupling of Smoothed Particle Hydrodynamics (SPH) for the fluid phase and the discrete element method (DEM) for the solid particles. This resuls in a purely particle-based simulation method and enjoys the intrinsic flexibility as a primary advantage over existing grid-based DPMs. The model described in this section is well suited for applications involving a free surface, including (but not limited to) debris flows, avalanches, landslides, sediment transport or erosion in rivers and beaches, slurry transport in industrial processes (e.g. SAG mills) and liquid-powder dispersion and mixing in the food processing industry robinson2013sph . Here we briefly describe the governing SPH equations for the fluid phase, based on the locally averaged Navier-Stokes equations (LANSEs) anderson67fluid ; for more details see Ref. robinson2013ijmf .
First, we define a smooth porosity field by smoothing out the DEM particle’s volumes according to the SPH interpolation kernel
| (6) |
where is the volume of DEM particle . For readability, sums over SPH particles use the subscript , while sums over surrounding DEM particles use the subscript . To calculate the continuity and momentum equations in the LANSEs, we first define a superficial fluid density equal to the intrinsic fluid density scaled by the local porosity . Substituting the superficial fluid density into the averaged continuity and momentum equations reduces them to the normal Navier-Stokes equations. Therefore, our approach is to use the weakly compressible SPH equations with variable (resolution/smoothing length) terms (monaghan05SPH, ; robinson11direct, ; price12smoothed, ) and adding fluid-particle drag terms (as specified below). The rate of change of the superficial density then becomes
| (7) |
where is the difference in velocity between SPH-particles and and is a correction factor due to the variable . Second, the acceleration of SPH-particle is given by
| (8) |
where is the coupling force on the SPH particle due to the DEM particles. The term models the effect of the viscous stress tensor and is calculated here using the term proposed in Ref. monaghan05SPH
| (9) |
where and are the average density and the distance between the centers of two SPH particles and , is the normal component of the relative velocity, and is a signal velocity at which information propagates between the particles. The (numerical) sound speed is given by and is a numerical pre-factor.
Third, the fluid pressure in Eq. (3.1) is calculated using the weakly compressible equation of state where the reference density is scaled by the local porosity to ensure that the pressure is slowly varying with porosity as
| (10) |
where is a scaling factor that is free a priori. It is set using a maximum velocity , in order to ensure that density fluctuations (due to the weakly compressible SPH formulation) are below 1%. The smoothing length varies according to the superficial density (and hence with the porosity) and is calculated by .
Finally, the suspended particles are introduced as follows: Given a DEM particle with position , the equation of motion is
| (11) |
where is the mass of particle , is the contact force between particles and (acting from to ) and is the fluid-particle coupling force on particle . For the simulations presented below, we have used the linear spring dashpot contact model
| (12) |
where is the overlap between the two particles and is the unit normal vector pointing from to . The force on each solid particle by the fluid is (anderson67fluid, )
| (13) |
where is the volume of particle . The first two terms model the effect of the resolved fluid forces (buoyancy and shear-stress) on the particle. The fluid pressure gradient and the divergence of the stress tensor are already calculated in Eq. (3.1) and are evaluated at each solid particle, using a Shepard corrected SPH interpolation (robinson2013ijmf, ).
The force models the drag effects of the unresolved fluctuations in the fluid variables and is calculated from the local porosity and the superficial velocity . These two values are calculated at each DEM particle position, again using a Shepard corrected SPH interpolation. For the results in this paper we use both the simple Stokes drag force and a more general drag law proposed by Di Felice (difelice94voidage, ).
The coupling force on SPH particle is determined by a weighted average of the fluid-particle coupling force on the surrounding DEM particles.
| (14) |
where is the coupling force calculated for each DEM particle using Eq. (13) and is a correction factor to guarantee equal and opposite forces between the two phases.
3.2 Verification case 1: Single Particle Sedimentation
The first test case models a single particle sedimenting (SPS) in a 3D fluid column under gravity robinson2013dispersion . The water column has a height of , and the bottom has a no-slip boundary, while the boundaries in the and directions are periodic with a width of . Gravity acts in the negative direction, so that the single DEM particle, initialised at , with diameter and density starts to fall at s. Note that before the SPS starts, for the initial conditions of the simulation, the position of the DEM particle is fixed and the SPH fluid particles are allowed to reach their hydrostatic equilibrium positions, which are not necessarily the same as their input positions.


In Figure 3(left) the evolution of a DEM particle’s vertical speed in water is shown for one-way and two-way coupling and for a reference fluid with parameters corresponding to water. The SPH-DEM results reproduce the analytical velocity curve within 0.3-1% error besides short-lived higher deviations at the initial onset of motion (approx 5%). One of the key assumptions of the SPH-DEM method (and any fluid-particle method that uses an unresolved fluid phase) is that the fluid resolution is sufficiently greater than the DEM particle diameter . This ensures a smooth porosity field calculated via Eq. (6). By varying the fluid resolution , we have found that accurate results are achieved as long as .
3.3 Validation case 2: Sedimentation of a Constant Porosity Block
The second test case (CPB) follows the sedimentation of a rigid porous block made up of a regular grid of DEM particles that cannot move relative to each other robinson2013dispersion . The porosity of the block determines the particle separation. As the block falls, the fluid is displaced and flows upward through the block, affecting the terminal velocity. All these simulations use the Di Felice drag law, which is one possibility to incorporate the effects of neighbouring particles on the drag force.
Varying the porosity of the CPB allows us to evaluate the accuracy of the SPH-DEM model at different porosities. Fig. 3(right) shows the scaled terminal velocity of the CPB over a range of porosities from to . The results for two different fluid resolutions are shown, and . The lower resolution leads to a systematically increased terminal velocity due to a reduced drag at the edges of the block, caused by an excessive smoothing of the porosity discontinuity by the large width of the smoothing kernel, a feature not restricted to SPH-DEM but common to any fluid-particle method that uses an unresolved fluid phase. However, reducing the fluid resolution to gives results better than 5% deviation (for the smallest ) over the range of porosities tested. More details and other fluids, as well as other resolutions are discussed in Ref. robinson2013ijmf , where also another test-case, the Rayleigh Taylor Instability (RTI) is introduced and used to study moving particles in the inverse settling set-up and the growth of the associated instability. Instead of continuing this, in the next subsection, we show one example with free boundaries, where the SPH-DEM method is at its best.
3.4 Dispersion example: Effect of Inlet Flow Rate
Ref. robinson2013sph compares experiments and SPH-DEM simulations of the dispersion of poppy seeds contained in a cylindrical cell, by liquid injected from a mm diameter inlet at the bottom of the cell. The cell diameter is mm and the cell height mm. The outlet occupies all the top surface of the cell and is permeable to the liquid, but not to the grains. The grain density is and their average diameter is mm. The total mass of grains in the cell is g, which corresponds to a bed height of about mm.
The cylindrical cell and the cylindrical inlet/outlet are modelled as no-slip boundaries in the SPH-DEM simulation, using a single layer of SPH repulsive force particles monaghan94simulating . The presence of the top filter is captured by including a top horizontal wall permeable to the fluid, but not to the grains. The DEM grains are allowed to settle into a packed arrangement before the inlet jet is turned on at . At this point SPH particles are added to the lower inlet with a constant velocity and rate that matches the experimental inlet flow rate . The air is assumed to have no influence on the results and is modelled implicitly by the absence of SPH fluid particles.
In Ref. robinson2013sph , a range of inlet flow rates ml/min was simulated. The behavior changes with increasing in-flow intensity. and the behavior predicted by simulations closely matches that of the experimental results, including the cut-off point at ml/min. Below this cut-off point the jet failed to fluidize the bed and the dispersion cell filled with fluid from the bottom up to the outlet height. The movement of DEM grains was minimal until the bed had been completely immersed, which qualitatively matches the experimental results. Figure 4 shows snapshots from the simulations. Grains are represented using white spheres and the water free-surface is colored in blue. For ml/min the grains do not move significantly and the fluid free-surface height linearly grows over time from the bottom to the top of the cell. The fluid free-surface is approximately constant over the horizontal width of the cell. For ml/min the jet quickly breaks through the center of the grain bed, dispersing a large number of grains throughout the cell. The jet is so strong that it impacts on the top of the cell, whereas for smaller the jet did not reach the top. Once the jet breaks through, the cell fills with fluid from top to bottom until the DEM grains are fully immersed.

4 Conclusion
We have summarized the advantages and disadvantages of a number of simulation algorithms for particle-laden flows. Two recent state of the art implementations based on a DEM algorithm for the particles coupled to a multicomponent LBM or an SPH implementation for the involved solvents were presented and and some specific applications were highlighted. To conclude, there is no perfect candidate on the market, but the method of choice has to be carefully selected depending on the physical problem. Of particular importance are the relevance of long-range hydrodynamic interactions, particle concentration and shape, the ratio of Brownian and advective forces, the role of inertia, or non-hydrodynamic particle-particle interactions such as electrostatic or van der Waals forces.
References
- (1) M. M. Dupin, I. Halliday, C. M. Care, L. Alboul, and L. L. Munn. Modeling the flow of dense suspensions of deformable particles in three dimensions. Phys. Rev. E, 75:066707, 2007.
- (2) C. Aidun and J. Clausen. Lattice-Boltzmann method for complex flows. Annu. Rev. Fluid Mech, 42:439, 2010.
- (3) T. Krüger, F. Varnik, and D. Raabe. Efficient and accurate simulations of deformable particles immersed in a fluid using a combined immersed boundary lattice Boltzmann finite element method. Comput. Math. Appl., 61:3485–3505, 2011.
- (4) F. Janoschek, F. Toschi, and J. Harting. Simplified particulate model for coarse-grained hemodynamics simulations. Phys. Rev. E, 82:056710, 2010.
- (5) H. L. Goldsmith and R. Skalak. Hemodynamics. Annu. Rev. Fluid Mech., 7:213, 1975.
- (6) A. Leonardi, F. Wittel, M. Mendoza, and H. Herrmann. Multiphase debris flow simulations with the discrete element method coupled with a lattice-Boltzmann fluid. In Proceedings of III International Conference on Particle-based Methods, PARTICLES 2013, 2013.
- (7) G. Sauermann, A. Poliakov, P. Rognon, and H. Herrmann. The shape of the Barchan dunes of southern Marocco. Geomorphology, 36:47, 2000.
- (8) A. Araújo, E. Partelli, T. Pöschel, J. Andrade jr., and H. Herrmann. Numerical modeling of the wind flow over a transverse dune: effect of the wind strength on the size of the zone of recirculating flow. Sci. Rep., 3:2858, 2013.
- (9) A. Lorke, M. Winterer, R. Schmechel, and C. Schulz. Nanoparticles from the Gas Phase - Formation, Structure, Properties. Springer, Berlin, 2012.
- (10) M. R. Robinson, S. Luding, and M. Ramioli. Grain sedimentation with SPH-DEM and its validation. In Powders and Grains 2013 – AIP Conf. Proc., volume 1542, p 1079, 2013.
- (11) Y. Tsuji, T. Oshima, and Y. Morikawa. Numerical simulation of pneumatic conveying in a horizontal pipe. KONA, 3:38, 1985.
- (12) T. Tanaka, T. Kawaguchi, and Y. Tsuji. Discrete particle simulation of flow patterns in two-dimensional gas fluidized beds. Int. J. Modern Physics B, 7:1889, 1993.
- (13) W. Kalthoff, S. Schwarzer, G. Ristow, and H. Herrmann. On the application of a novel algorithm to hydrodynamic diffusion and velocity fluctuations in sedimenting systems. Int. J. Mod. Phys. C, 7:543, 1996.
- (14) K. Chu and A. Yu. Numerical simulation of complex particle-fluid flows. Powder Technology, 179(3):104, 2008.
- (15) J. Link, L. Cuypers, N. Deen, and J. Kuipers. Flow regimes in a spout-fluid bed: a combined experimental and simulation study. Chem. Eng. Sci., 60(13):3425, 2005.
- (16) N. Deen, M. V. S. Annaland, M. V. D. Hoef, and J. Kuipers. Review of discrete particle modeling of fluidized beds. Chem. Eng. Sci., 62:28, 2007.
- (17) M. Van der Hoef, M. van Sint Annaland, N. Deen, and J. Kuipers. Numerical simulation of dense gas-solid fluidized beds: A multiscale modeling strategy. Annu. Rev. Fluid Mech., 40(1):47, 2008.
- (18) M. R. Robinson, M. Ramioli, and S. Luding. Fluid-particle flow modelling and validation using two-way coupled, mesoscale SPH-DEM. Int. J. Multiphase Flow, 59:121, 2013.
- (19) S. Srivastava, K. Yazdchi, and S. Luding. Meso-scale coupling of FEM/DEM for fluid-particle interactions. Phil. Trans. R. Soc. A, 372:20130386, 2014.
- (20) A. Leonardi, F. Wittel, M. Mendoza, and H. Herrmann. Coupled DEM-LBM method for the free-surface simulation of heterogeneous suspensions. Computational Particle Mechanics, 1:3, 2014.
- (21) W. Ge, L. Lu, J. Xu, Y. Yue, X. Liu, and L. Li. EMMS-based discrete particle method (EMMS-DPM) for simulation of gas-solid flows. 2014. under review.
- (22) N. Guo and J. Zhao. A coupled FEM/DEM approach for hierarchical multiscale modelling of granular media. Int. J. Numer. Meth. Engng., 2014. in press – DOI: 10.1002/nme.4702.
- (23) M. Hütter. Local structure evolution in particle network formation studied by Brownian dynamics simulation. J. Colloid Int. Sci., 231:337, 2000.
- (24) D. Petera and M. Muthukumar. Brownian dynamics simulation of bead–rod chains under shear with hydrodynamic interaction. J. Chem. Phys, 111:7614, 1999.
- (25) P. Ahlrichs, R. Everaers, and B. Dünweg. Screening of hydrodynamic interactions in semidilute polymer solutions: A computer simulation study. Phys. Rev. E, 64:040501, 2001.
- (26) L.E. Silbert, J.R. Melrose, and R.C. Ball. Colloidal microdynamics: Pair-drag simulations of model-concentrated aggregated systems. Phys. Rev. E, 56:7067, 1997.
- (27) G. Bossis and J.F. Brady. Dynamic simulation of sheared suspensions. I. General method. J. Chem. Phys., 80:5141, 1984.
- (28) A. Sierou and J.F. Brady. Accelerated Stokesian Dynamics simulations. J. Fluid Mech., 448:115, 2001.
- (29) T. Phung, J. Brady, and G. Bossis. Stokesian Dynamics simulation of Brownian suspensions. J. Fluid Mech., 313:181, 1996.
- (30) J.F. Brady and G. Bossis. Stokesian Dynamics. Ann. Rev. Fluid Mech., 20:111, 1988.
- (31) M. Loewenberg and E. Hinch. Numerical simulation of a concentrated emulsion in shear flow. J. Fluid. Mech., 321:395, 1996.
- (32) H. A. Knudsen, J. H. Werth, and D. E. Wolf. Failure and success of hydrodynamic interaction models. Eur. Phys. J. E, 27:161, 2008.
- (33) P. Espaol and P. Warren. Statistical mechanics of Dissipative Particle Dynamics. Europhys. Lett., 30:191, 1995.
- (34) A. Ladd and R. Verberg. Lattice-Boltzmann simulations of particle-fluid suspensions. J. Stat. Phys., 104:1191, 2001.
- (35) A. Komnik, J. Harting, and H. Herrmann. Transport phenomena and structuring in shear flow of suspensions near solid walls. J. Stat. Mech: Theor. Exp., P12003, 2004.
- (36) G. Gompper, T. Ihle, D. Kroll, and R. Winkler. Multi-Particle Collision dynamics: A Particle-Based Mesoscale Simulation Approach to the Hydrodynamics of Complex Fluids, p 1. Springer, 2009.
- (37) A. Malevanets and R. Kapral. Mesoscopic model for solvent dynamics. J. Chem. Phys., 110:8605, 1999.
- (38) A. Malevanets and R. Kapral. Solute dynamics in mesoscale solvent. J. Chem. Phys., 112:7260, 2000.
- (39) M. Hecht, J. Harting, T. Ihle, and H. Herrmann. Simulation of claylike colloids. Phys. Rev. E, 72:011408, 2005.
- (40) M. Hecht, J. Harting, M. Bier, J. Reinshagen, and H. Herrmann. Shear viscosity of clay-like colloids: Computer simulations and experimental verification. Phys. Rev. E, 74:021403, 2006.
- (41) M. R. Robinson, S. Luding, and M. Ramioli. SPH-DEM simulations of grain dispersion by liquid injection. In Powders and Grains 2013 – AIP Conf. Proc., volume 1542, p 1122, 2013.
- (42) A. Fogelson and C. Peskin. A fast numerical method for solving the three-dimensional Stokes equations in the presence of suspended particles. J. Comput. Phys., 79:50, 1988.
- (43) S. Schwarzer, K. Höfler, and B. Wachmann. Simulation of hindered settling in bidisperse suspensions of rigid spheres. Comp. Phys. Comm., 268:121, 1999.
- (44) K. Höfler and S. Schwarzer. Navier-Stokes simulation with constraint forces: Finite-difference method for particle-laden flows and complex geometries. Phys. Rev. E, 61:7146, 2000.
- (45) F. Fonseca and H. Herrmann. Sedimentation of oblate ellipsoids at low and moderate Reynolds numbers. Physica A, 342:447, 2004.
- (46) F. Fonseca and H. Herrmann. Simulation of the sedimentation of a falling oblate ellipsoid. Physica A, 345:341, 2005.
- (47) S. McNamara, E. Flekkøy, and K. Måløy. Grains and gas flow: Molecular dynamics with hydrodynamic interaction. Phys. Rev. E, 61:658, 2000.
- (48) M. Strauß, H. Herrmann, S. McNamara, G. Niederreiter, and K. Sommer. Plug conveying in a vertical tube. Particle Technology, 162:16, 2006.
- (49) M. Strauß, S. McNamara, and H. Herrmann. Plug conveying in a horizontal tube. Granular Matter, 9:35, 2007.
- (50) W. Ramsden. Separation of solids in the surface-layers of solutions and ‘suspensions’. Proc. R. Soc. London, 72:156, 1903.
- (51) S. Pickering. Emulsions. J. Chem. Soc., Trans., 91:2001, 1907.
- (52) S. Succi. The Lattice Boltzmann Equation for Fluid Dynamics and Beyond. Oxford University Press, Oxford, 2001.
- (53) X. Shan and H. Chen. Lattice Boltzmann model for simulating flows with multiple phases and components. Phys. Rev. E, 47:1815, 1993.
- (54) X. Shan and H. Chen. Simulation of nonideal gases and liquid-gas phase transitions by the lattice Boltzmann equation. Phys. Rev. E, 49:2941, 1994.
- (55) M. R. Swift, E. Orlandini, W. R. Osborn, and J. M. Yeomans. Lattice-Boltzmann simulations of liquid-gas and binary fluid systems. Phys. Rev. E, 54:5041, 1996.
- (56) S. Lishchuk, C. Care, and I. Halliday. Lattice Boltzmann algorithm for surface tension with greatly reduced microcurrents. Phys. Rev. E, 67:036701, 2003.
- (57) J. Harting, H. Herrmann, and E. Ben-Naim. Anomalous distribution functions in sheared suspensions. Europhys. Lett., 83:30001, 2008.
- (58) K. Stratford, R. Adhikari, I. Pagonabarraga, J.-C. Desplat, and M. Cates. Colloidal jamming at interfaces: A route to fluid-bicontinuous gels. Science, 309:2198, 2005.
- (59) A. Joshi and Y. Sun. Multiphase lattice Boltzmann method for particle suspensions. Phys. Rev. E, 79:066703, 2009.
- (60) F. Jansen and J. Harting. From Bijels to Pickering emulsions: a lattice Boltzmann study. Phys. Rev. E, 83:046707, 2011.
- (61) S. Frijters, F. Günther, and J. Harting. Effects of nanoparticles and surfactant on droplets in shear flow. Soft Matter, 8:6542, 2012.
- (62) F. Günther, F. Janoschek, S. Frijters, and J. Harting. Lattice Boltzmann simulations of anisotropic particles at liquid interfaces. Computers and Fluids, 80:184, 2013.
- (63) B. Binks and T. Horozov. Colloidal Particles at Liquid Interfaces. Cambridge University Press, 2006.
- (64) B. Binks. Particles as surfactants – similarities and differences. Cur. Opin. Colloid Interface Sci., 7:21, 2002.
- (65) E. Kim, K. Stratford, R. Adhikari, and M. Cates. Arrest of fluid demixing by nanoparticles: A computer simulation study. Langmuir, 24:6549, 2008.
- (66) A. Joshi and Y. Sun. Wetting dynamics and particle deposition for an evaporating colloidal drop: A lattice Boltzmann study. Phys. Rev. E, 82:041401, 2010.
- (67) N.-Q. Nguyen and A. Ladd. Lubrication correction for lattice-Boltzmann simulation of particle suspensions. Phys. Rev. E, 66:046708, 2002.
- (68) F. Janoschek, J. Harting, and F. Toschi. Accurate lubrication corrections for spherical and non-spherical particles in discretized fluid simulations. Submitted for publication, 2014.
- (69) G. Taylor. The viscosity of a fluid containing small drops of another fluid. Proc. R. Soc. Lond. Ser. A, 138:41, 1932.
- (70) G. Taylor. The formation of emulsions in definable fields of flow. Proc. R. Soc. Lond. Ser. A, 146:501, 1934.
- (71) B. Kaoui, J. Harting, and C. Misbah. Two-dimensional vesicle dynamics under shear flow: effect of confinement. Phys. Rev. E, 83:066319, 2011.
- (72) T. Anderson and R. Jackson. Fluid mechanical description of fluidized beds. equations of motion. Industrial & Engineering Chemistry Fundamentals, 6:527, 1967.
- (73) J. J. Monaghan. Smoothed particle hydrodynamics. Rep. Prog. Phys., 68:1703, 2005.
- (74) M. Robinson and J. Monaghan. Direct numerical simulation of decaying two-dimensional turbulence in a no-slip square box using smoothed particle hydrodynamics. Int. J. Num. Meth. Fluids, 70:37, 2012.
- (75) D. Price. Smoothed particle hydrodynamics and magnetohydrodynamics. J. Comp. Phys., 231:759, 2012.
- (76) R. Di Felice. The voidage function for fluid-particle interaction systems. Int. J. Multiphase Flow, 20:153, 1994.
- (77) J. J. Monaghan. Simulating free surface flows with SPH. J. Comp. Phys., 110:399, 1994.