Ultrafast terahertz probes of interacting dark excitons in chirality-specific semiconducting single-walled carbon nanotubes
Abstract
Ultrafast terahertz spectroscopy accesses the dark excitonic ground state in resonantly-excited (6,5) SWNTs via internal, direct dipole-allowed transitions between lowest lying dark-bright pair state 6 meV. An analytical model reproduces the response which enables quantitative analysis of transient densities of dark excitons and e-h plasma, oscillator strength, transition energy renormalization and dynamics. Non-equilibrium, yet stable, quasi-1D quantum states with dark excitonic correlations rapidly emerge even with increasing off-resonance photoexcitation and experience a unique crossover to complex phase-space filling of both dark and bright pair states, different from dense 2D/3D excitons influenced by the thermalization, cooling and ionization to free carriers.
Quasi-one-dimension (quasi-1D) excitons in single-walled carbon nanotubes (SWNTs), with large binding energies of 100s of meV, naturally arise from strong quantum confinement and reduced screening of electron-hole (e-h) pairs Feng ; Maultzsch . Their internal structure is characterized, in a 1D hydrogen atom-like description, by a center-of-mass momentum K and by internal quantum numbers (designated here as 1s, 2s, 2p…). These strong excitonic behaviors manifest themselves in extensive static/ultrafast optical interband absorption/emission spectra in individually separated SWNTs, which are stable even in the presence of unbound e-h carriers from residual tube aggregation and/or metallic tubes YMa ; JWang ; Ostojic ; Crochet . However, unlike the hydrogen atom, the correlated e-h pairs in SWNTs evolve in a “modified vacuum” with exotic, chiral symmetry arising from the underlying graphene lattice that gives two-fold degeneracy at and points. Coulomb interaction splits such “doubling” into odd (u) and even (g) symmetry states entailing a series of bright and optically-forbidden, dark exciton pairs, including the lowest 1s(u) and 1s(g) Zhao ; perebeinos (Fig. 1(a)). Thus far, the dark ground state 1s(g), hidden from both single- and two-photon optical interband transitions, is still largely unexplored.
While magneto-optics and light scattering measurements established the existence of dark excitons in SWNTs Srivastava ; Matsunaga ; Torrens , the search for possible dipole-allowed, lowest transitions 1s(g)1s(u) remains open. Particularly, as these linear probes do not depend critically on quasi-particle/exciton interaction and the associated fast dynamics, they provide little insight into interacting states that are characterized by the co-existence of both the dark bright excitons and their complex interplay with e-h plasma. Exactly these aspects govern the radiative lifetime and photoluminesce (PL) efficiency, key for SWNT-based optoelectronic applications Xia ; Zhao . The lack of quantitative probes and scarce ultrafast measurements for dark states seriously limit their thorough understandings and perspectives of exploring related novel quantum phenomena, e.g., the excitonic Bose condensate Butov and other exotic ground states.
Selective optical pump and THz probe technique represents a versatile spectroscopy tool that is extremely relevant for quantitative study of dark excitons. THz pulses directly couple the 1s(g)1s(u) transitions [arrows, Fig. 1(a)], which represents a direct consequence and measure of excitonic pair correlations and resulting dark states in SWNTs. Being independent of momentum , THz pulses measure genuine dark exciton population across entire space, while the available interband optical probes (PL, absorption), due to symmetry and momentum conservation, only detect a subset of excitons near =0. Additionally, the capability of resonant and off-resonant excitations by tuning the pump photon energy enables, among others, the study of excitons in single chirality tube and of exciton-plasma interaction. These critical aspects for dark exciton studies are absent in prior THz experiments of SWNTs. They reveal some other interesting low-energy electrodynamics, e.g., the absorption band centered 4 THz Kampfrath2 , and evidence for the internal transitions and non-Drude conductivity Xu2009 .
In this Letter, we reveal lowest lying dark excitons and their interacting states in semiconducting SWNTs. With resonant excitation to the (6,5) interband transition at low temperature, transient THz spectra evidence strong photoinduced absorption centered 6 meV, whose transition energy, pump photon and temperature dependence, and dynamics manifest the observation of the 1s(g)1s(u) transition. Most intriguingly, the 1s(g)1s(u) oscillator signals emerge quasi-instantaneously even with increasing off-resonance photoexcitation and drop significantly above 130 J cm-2, at which the intra-excitonic resonances are still stable with little shift or broadening. This appears to be distinctly different from dense 2D and 3D excitons that are influenced by the thermalization, cooling and ionization to free carriers Kaindl . The robust non-equilibrium quasi-1D many-exciton states, instead, uniquely evolve from a predominant dark exciton population to complex phase-space filling of both dark and bright pair states.
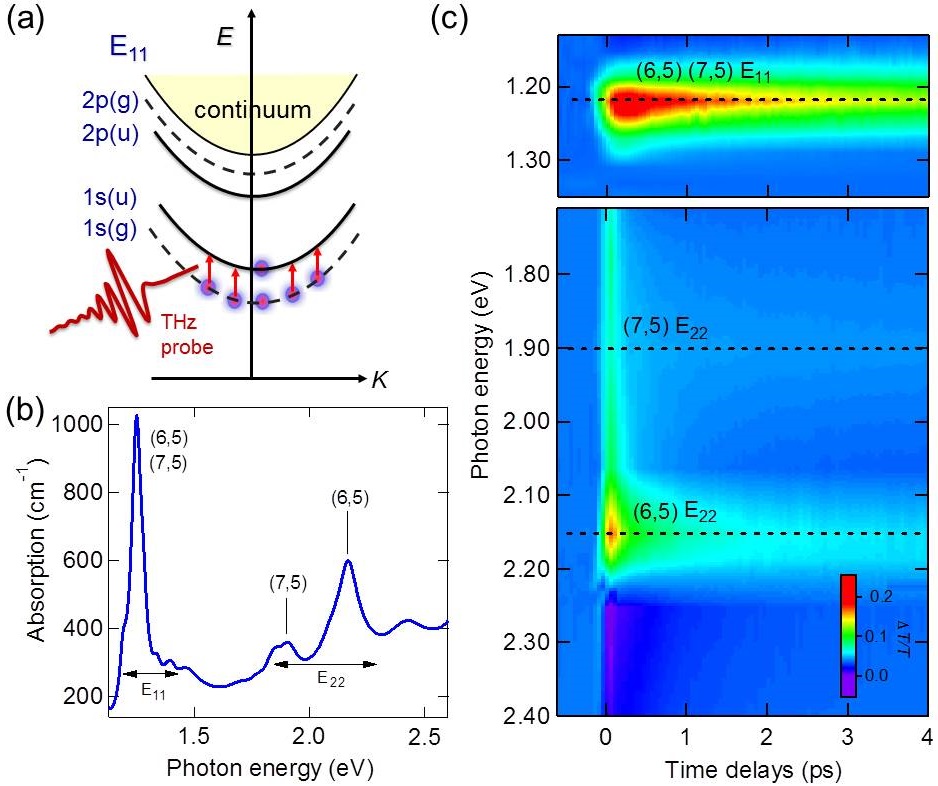
We study Co-Mo-catalyst grown SWNTs of mainly (6,5) and (7,5) chiralities embedded in a freestanding 50 m Sodium Dodecylbenzenesulfonate (SDBS) film through drying a D2O solution of SDBS-dispersed SWNTs (supplementary) Ogawa . The absorption spectrum in Fig. 1(b) exhibits the distinct and quantized interband absorption peaks of dominant (6,5) and (7,5) chiralities, each associated with substantially prolonged relaxation times and significantly enhanced photobleaching, as shown in the differential transmission spectra (Fig. 1(c)). These observations are consistent with the extensive interband studies of high-quality chirality-enriched SWNT samples at visible and near-infrared spectral regions, which are explained by the joint effects of resonantly-enhanced radiative lifetime and exciton-exciton annihilation (EEA) Ostojic ; YMa .
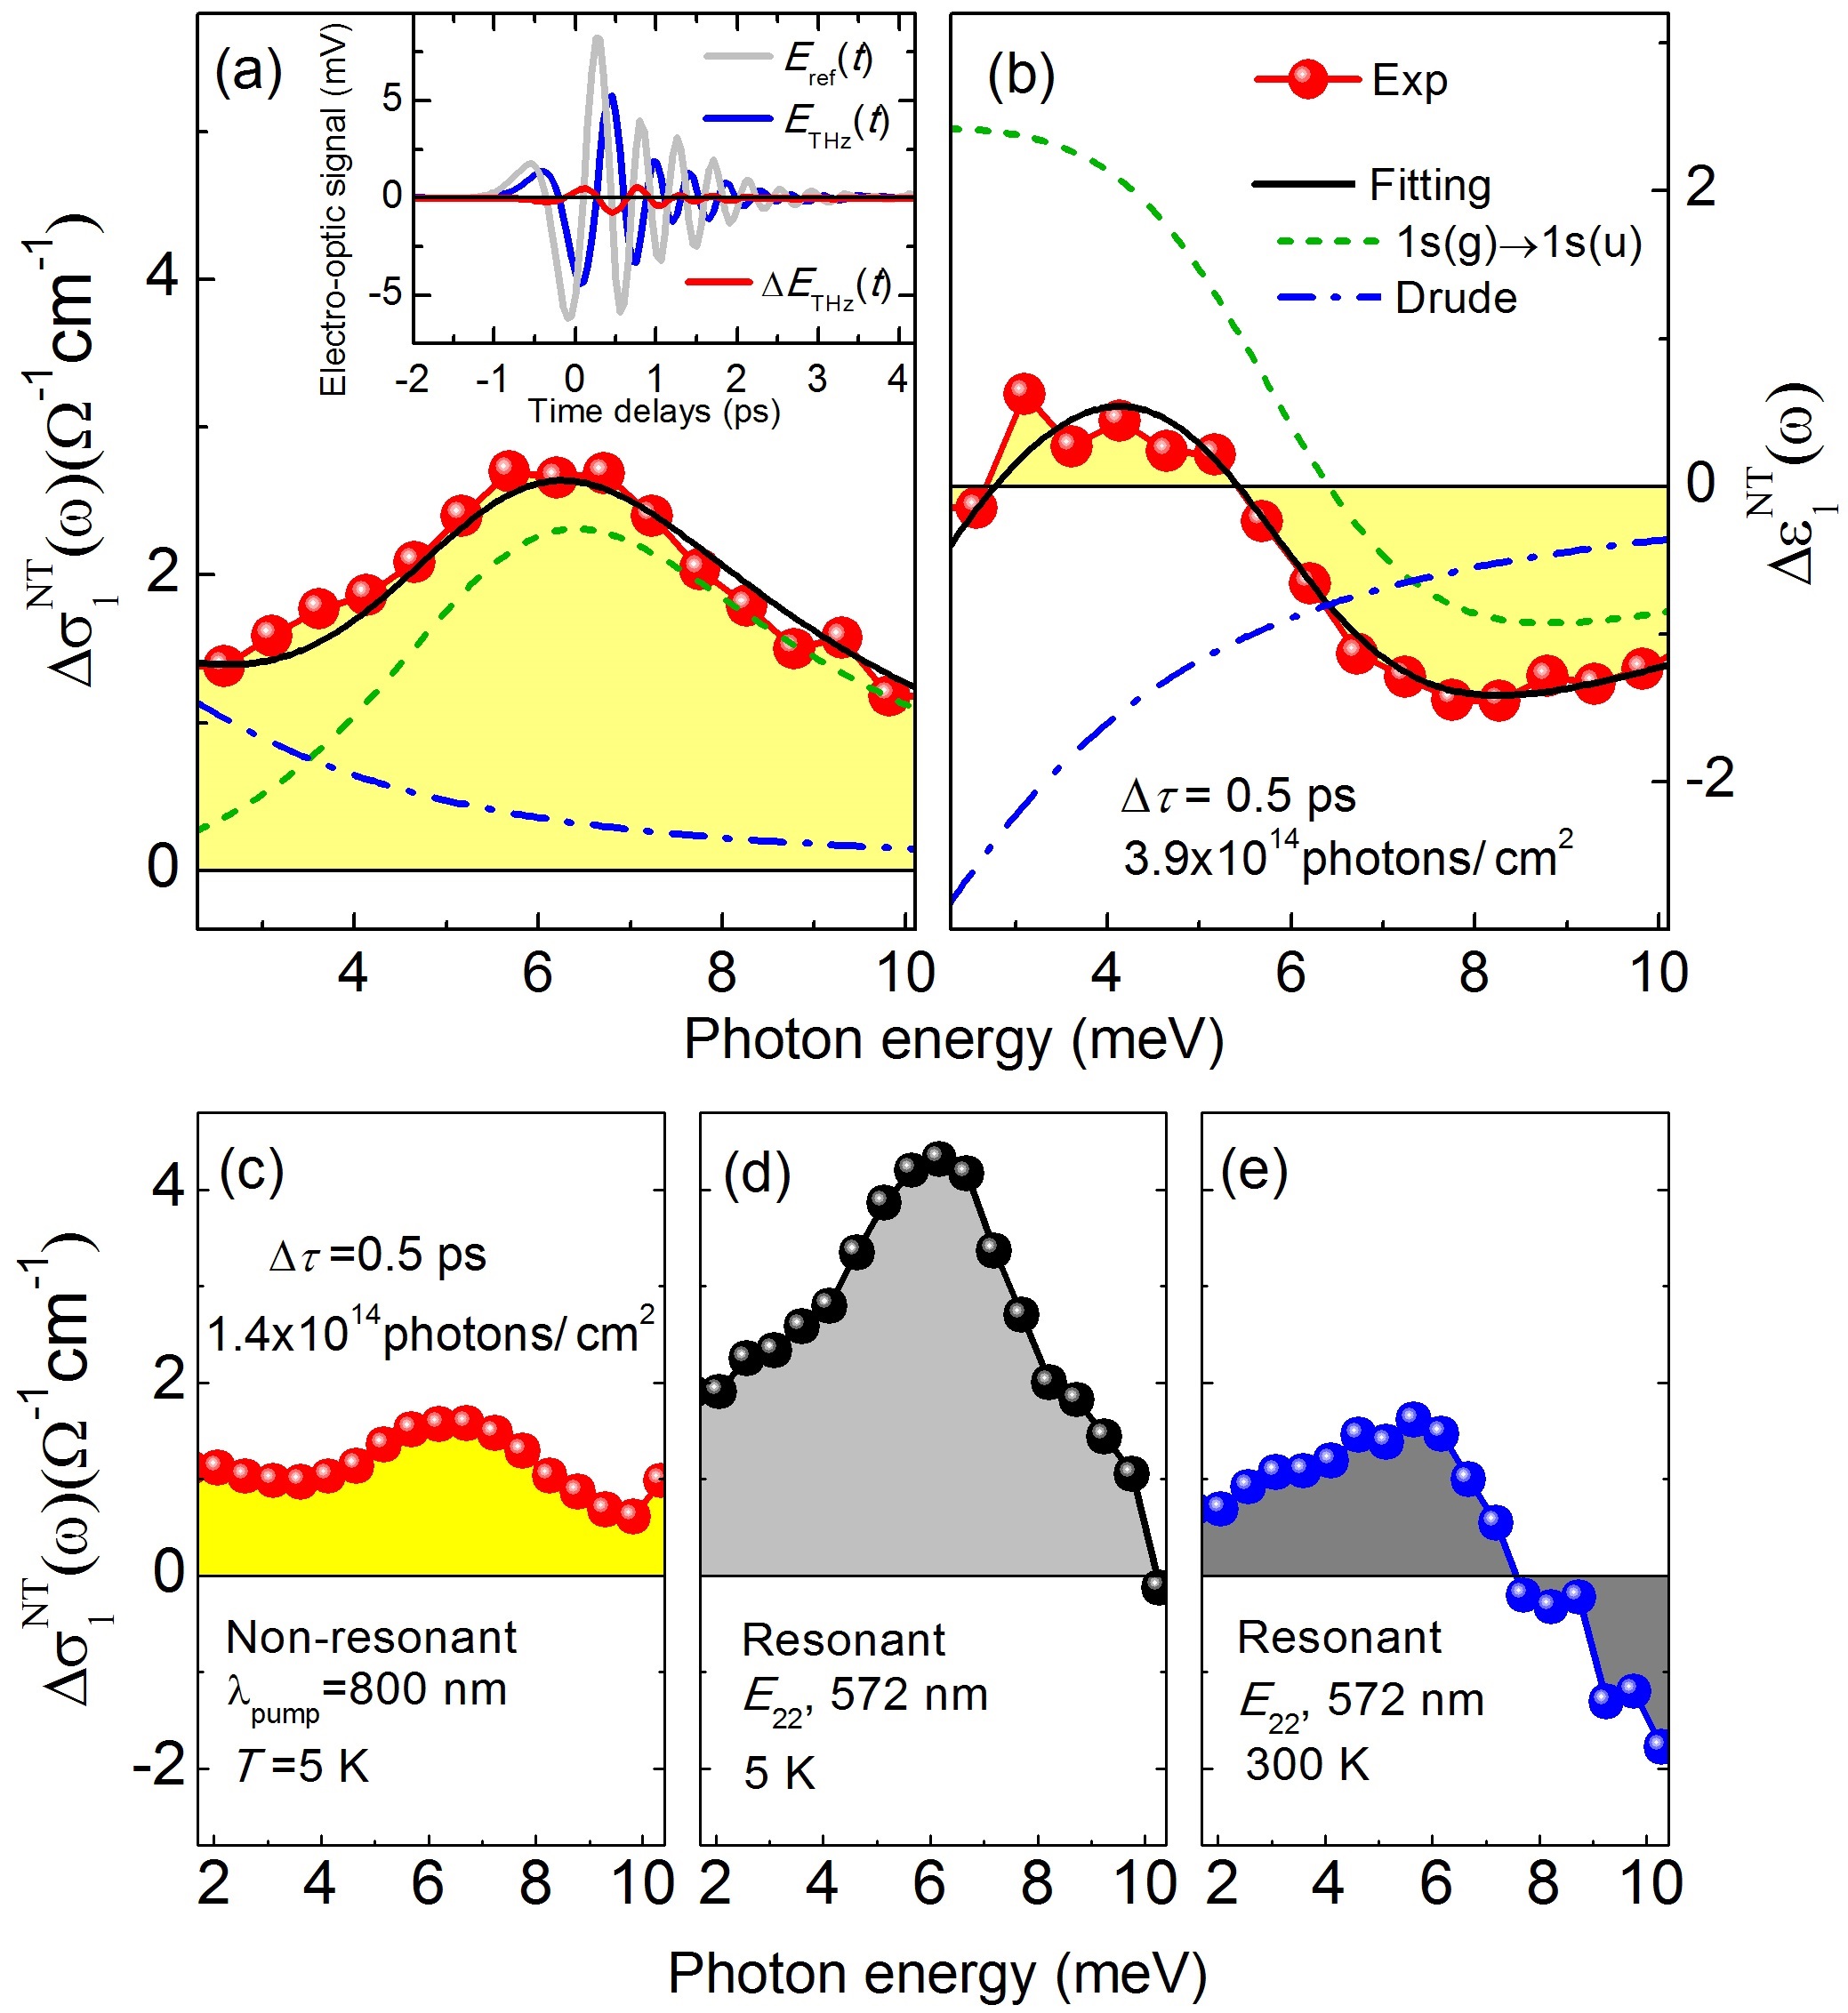
Our optical pump, THz probe spectroscopy setup is driven by a 1 kHz Ti:Sapphire regenerative amplifier (40 fs, 800 nm center wavelength), which pumps an optical parametric amplifier and 1 mm thick ZnTe crystals (supplementary). The THz fields in time domain are measured, shown in the inset of Fig. 2(a), for transmission through reference (a clear aperture in our case) (gray), unexcited sample (blue), and its pump induced change after a pump-probe delay =0.5 ps (red). Through the fast Fourier transformation and Fresnel equation, the full THz dielectric response is obtained and expressed as the real part of the conductivity, , and of the dielectric function, , which measures the absorbed power and the out-of-phase, inductive response, respectively Ioannis . Effective medium theory is applied to obtain the SWNT dielectric function from the experimental data (supplementary).
Representative ultrafast THz responses and are shown in Figs. 2(a)-2(b) (red dots) at =0.5 ps and =5 K, after 1.55 eV pumping with photon density 3.9 cm-2. A strong photo-induced absorption appears in within the time resolution with a broad, resonant spectral shape centered at 6 meV and a dispersive zero crossing occurs in at slightly lower photon energy. These two features are characteristic of a well-defined driven THz oscillator while the shift between their spectral positions and the non-vanishing conductivity, albeit small, at the lowest probe energy 2 meV indicate additional low-frequency spectral weight, in the form of a coexisting unbound e-h plasma as discussed later. We emphasize three key facts to assign this resonance mainly from the 1s(g)1s(u) transition of (6,5) tubes note2 . First, resonant photoexcitation of the (6,5) interband excitonic transitions at 2.17 eV, shown in Fig. 2(d), leads to significant enhancement of the transient THz resonance 6 meV, e.g., roughly three times as large as the 1.55 eV off-resonant excitation (Fig. 2(c)), for the same excitation photon density =1.4 cm-2 per pulse. This clearly shows the excitonic origins of the THz resonance in (6,5) tubes. Second, raising the initial lattice temperature to =300 K (Fig. 2(e)) diminishes the resonance as compared to =5 K (Fig. 2(d)), for the same resonant excitation. Third, the resonance occurs in the transparent region of the unexcited sample and is close to the 1s(g)1s(u) transition energy of (6,5) tubes indirectly extrapolated in high field magneto-optical studies Srivastava ; Matsunaga .
For a quantitative analysis, a theoretical model is used to reproduce the experimentally determined complex THz dielectric functions. The model consists of two components: the THz dielectric function of the intra-excitonic transitions plus a Drude term of e-h plasma
| (1) |
For the first component (dashed green), denotes effective transition strength of the intra-excitonic resonance as , where is the oscillator strength and . The term, thereby, measures the population difference between the lowest dark and bright pair states (Fig. 1(a)), i.e., . The second, Drude component (dash-dotted blue) is added with proportional to the density of unbound e-h density . and are the vacuum and background permittivity, and and are the electron charge and the effective exciton (or electron) mass obtained from Jorio . Such composite THz response model (solid black lines) provides an excellent agreement with the low temperature data (red dots) in Figs. 2(a)-2(b) by varying the and , carrier density , and the exciton (carrier) broadening (). The best fit are strongly restrained by the requirement of simultaneously satisfying both dielectric responses and , over a broad spectral range, and by the distinctly different spectral shapes of the excitonic oscillator and Drude carriers.
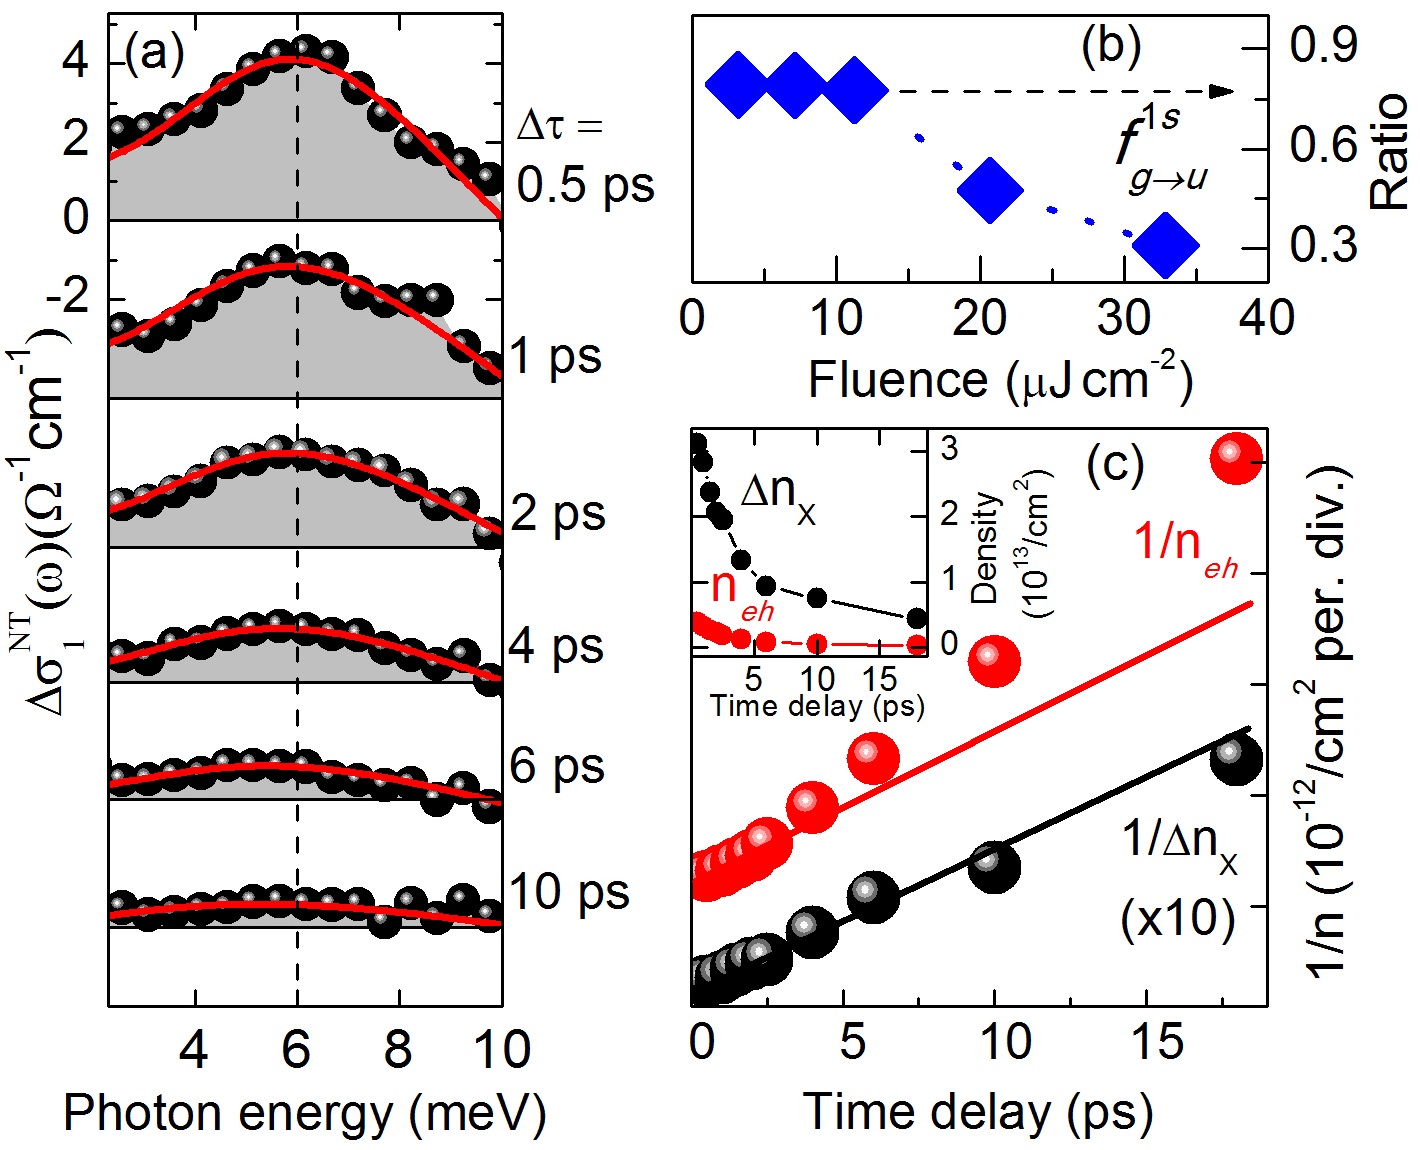
Fig. 3(a) presents in detail of ultrafast THz conductivity spectra for various time delays after the resonant photoexcitation at 2.17 eV. Pump fluence is 48 J cm-2 and =5 K. The transient spectra are characterized by the resonance that retains its shape as the amplitude decays with time. The resonance peaks (dash line) exhibit no noticeable shift. The results can be fitted very well by the model described above (red lines). To further determine the exciton density )), the oscillator strength is needed for the 1s(g)1s(u) transition which has never been determined before. This can be directly obtained here via fluence dependence of the ratio down to 3J cm-2 in Fig. 3(b), where is the actual absorbed photon density after taking into account the reflection and transmission of the pump beam in the optical path. This ratio, with sufficiently weak photoexcitation, follows with , considering strongly limited EEA in dilute exciton gas and fast inter-subband -to- relaxation 40 fs Manzoni ; Murakami . The measurement clearly shows becomes mostly pump-power-independent below 10J cm-2 which indicates note4 and the ratio converges to a constant 0.79. This is consistent with the fact that the optically generated exciton density is 1 per tube at 10J cm-2 estimated from the tube density and linear absorption. Increasing pump fluence to 10s of J cm-2 leads to a significant drop of the ratio (Fig. 3(b)), which can be attributed to efficient EEA that lowers the photon-exciton conversion efficiency.
The obtained density and its relaxation dynamics (black dots) are well described by a bimolecular decay shown in Fig. 3(c). Although it exhibits a highly non-exponential profile over ps time scales (the inset), a reciprocal plot of 1/, instead, yields a simple straight line, i.e., 1/ (black dots), which is the hallmark of the bimolecular decay given by with decay rate of sheet density =2.310-14 cm2 ps-1 YMa . The (t) decay (red dots), on the contrary, show large variation from the bimolecular behavior, which further underscores the excitonic origin of the response. Furthermore, the strong similarity between the (t) decay and firmly established exciton bimolecular kinetics in SWNTs also indicates (t), i.e., it quantitatively follows the 1s(g) exciton density. This shows that, under current pumping conditions, most excitons populate in the 1s(g) ground state and . Therefore, the resonant photoexcitation generates dark excitons 90% of the total density, much larger than (inset, Fig. 3(c)).
Increasing off-resonant excitation reveals the complex many-particle interacting state.
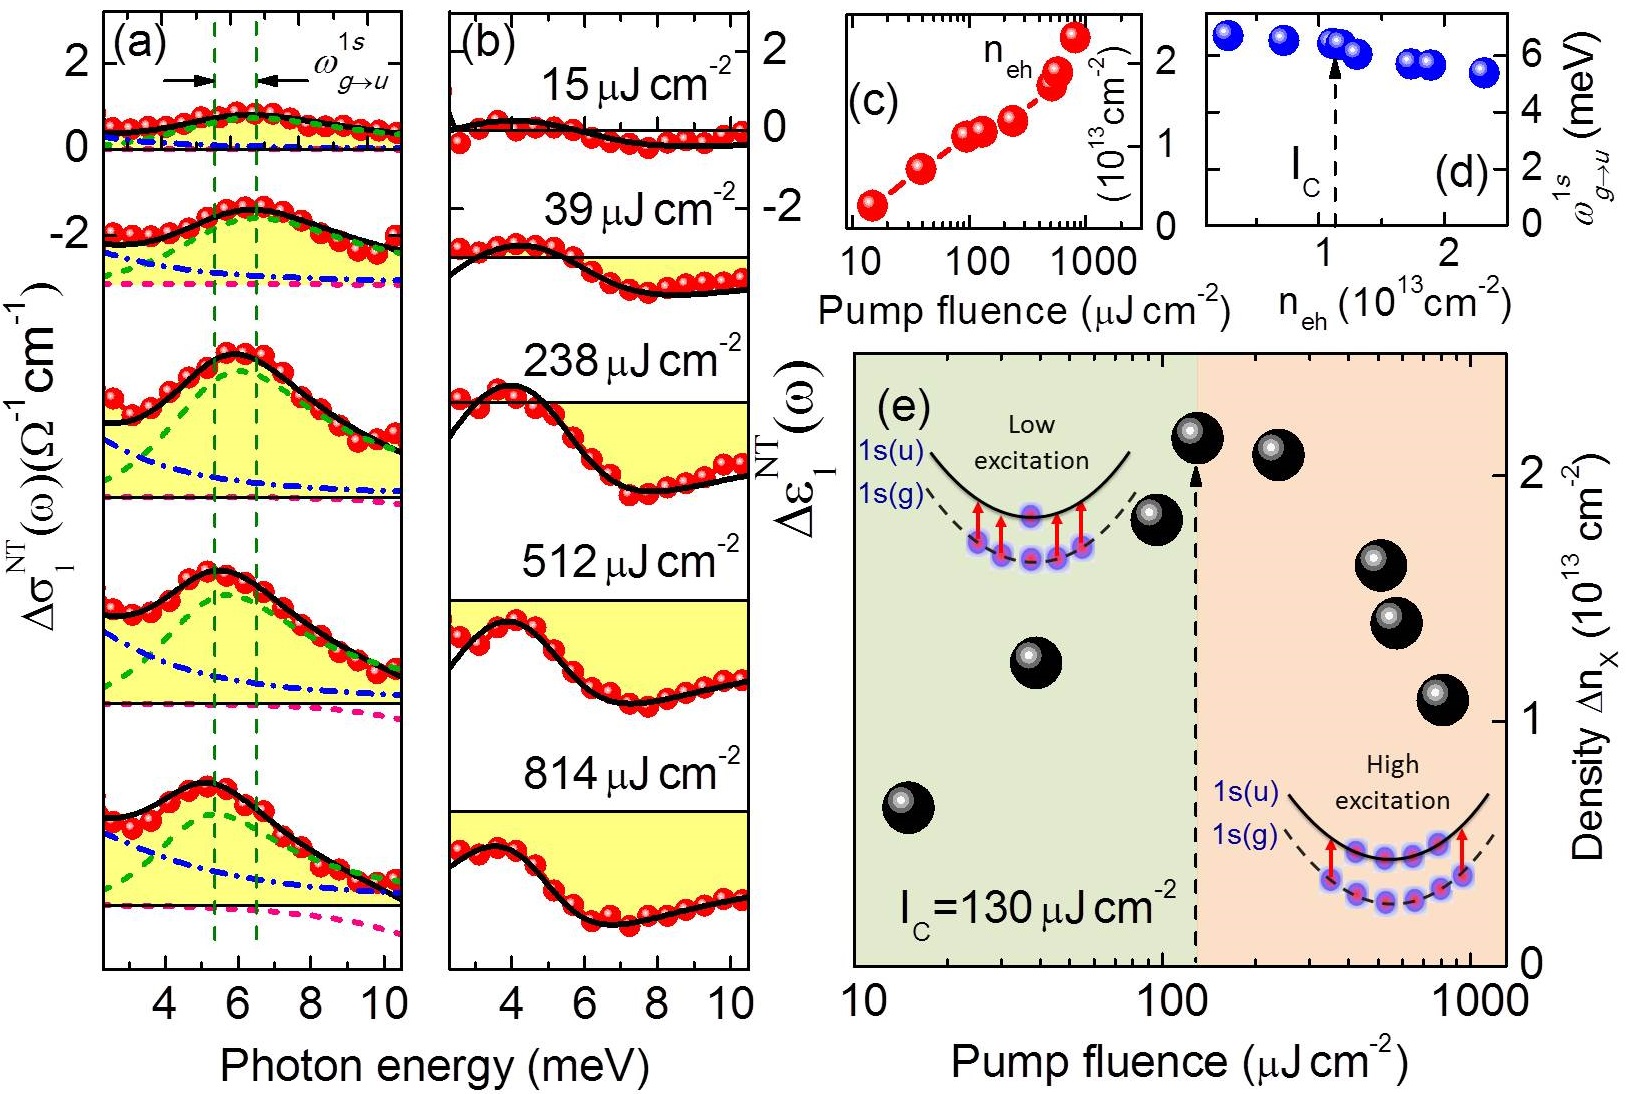
Figs. 4(a)-(b) shows and for various pump fluences after 1.55 eV photoexcitation at =5 K. The spectra at =0.5 ps clearly exhibit the resonance, despite 100s of meV detuning away from the excitonic resonances, which dominates e-h plasma especially at low pumping. This reveals an ultrafast sub-ps formation of non-equilibrium 1D dark excitonic correlations, much faster than the 100s of ps thermalization of bright excitons to the dark ground states seen in time-resolved PL Matsunaga2 . The difference occurs since the initial electronically correlated states are mostly hidden from those interband probes. The formation also appears to be much more robust than 2D/3D excitons that are strongly influenced by the co-existing e-h plasma with 100s of ps cooling time under the off-resonant pumping Kaindl . The composite THz model (black lines) again consistently reproduces very well the experimental results, which are divided into individual components in the same manner as Fig. 2(a): the intraexcitonic 1s(g)1s(u) (green lines) and unbound e-h carriers (blue lines). Note the bleaching component of the 4 THz band (pink lines) Kampfrath2 ; note3 is added and only contributes at high pumping above 512 J cm-2 (supplementary). Two salient features are visible with increasing pump fluence:
(1) The first feature is that the resonance in shifts to lower frequency (Fig. 4(d)), illustrated by two dash lines in Fig. 4(a), 20 % change from 15 to 814 J cm-2. We attribute this to the critical role of plasma-exciton interaction in the renormalization of the excitonic levels, considering the unbound e-h density significantly increases in the off-resonance pumping, e.g., can reach 2.5cm-2, comparable to exciton density, shown in Figs. 4(c) and 4(e). Note that the shift is not seen in the system of a predominant exciton population, shown in Fig. 3 for the resonant pumping, which has larger exciton density but one order of magnitude smaller .
This reconciles some contradictory results regarding the exciton stability in the literature, e.g., photoluminescence spectra of dense excitons have shown no excitonic shift up to complete absorption saturation Ostojic ; Murakami , while ultra-violet pumping results in some effects Crochet . This can be underpinned unambiguously here to the e-h plasma-exciton interaction.
(2) The second feature is that the exciton density exhibits a distinct non-monotonic variation with increasing photoexcitation (Fig. 4(e)), which peaks at 130 J cm-2 followed by a significant decrease with further increasing pump fluence. However, most interestingly, the intra-excitonic resonance exhibits little shift or broadening at (<5, dash arrow in Fig. 4(d)), indicating that there is no obvious exciton ionization to unbound e-h plasma.
This appears to be fundamentally different from dense 2D and 3D excitons where the strong decrease of excitonic signals occurs only upon the ionization of excitons manifested by a significant shift, broadening, and ultimately the disappearance of the THz resonances. The quasi-1D many-body state in SWNTs reveal, instead, the evolution from a predominant dark exciton population in the 1s(g) to phase space filling of both the lowest dark and bright exciton pair states note .
Such crossover at is illustrated by two shaded colors in Fig. 4(e): below , photoexcited excitons primarily populate in the lowest lying dark state 1s(g) that leads to a rapid rise of with increasing pump fluence; above , photoexcited excitons have larger probability to populate the 1s(u) state rather than the 1s(g) ground state, due to electronic heating of the many-body systems, which is responsible for the reduction of the resonance via Pauli blocking of the transition. The 1s(g)/1s(u) exciton pairs, being well-isolated from higher lying exciton levels and continuum (200 meV) JWang ; Feng ; Maultzsch , is stable against high density ionization.
In conclusion, we provide the first insights into the chirality-specific THz response of non-equilibrium excitonic correlations and dynamics from the dark ground states in SWNTs. The THz 1s(g)1s(u) resonant probes revealed, being independent of ground state symmetry and momentum conservation restrictions, identify that strong electronic correlation regulates the sub-ps formation of 1D dark excitons beyond the previously-held slow thermalization/cooling scenario. This may also evolve into a benchmark approach for quantitative exciton management in SWNT-based device development, and motivates for fundamental quantum phase discovery of excitons Butov and other strongly correlated excitations li-2013 .
This work was supported by the US Department of Energy, Office of Basic Energy Science, Division of Materials Sciences and Engineering (Ames Laboratory is operated for the US Department of Energy by Iowa State University under Contract No. DE-AC02-07CH11358).
∗Corresponding author.
jgwang@iastate.edu; jwang@ameslab.gov
†Present address: Ming Hsieh Department of Electrical Engineering, University of Southern California, 3737 Watt Way, Los Angeles, CA 90089-0271
References
- (1) F. Wang, G. Dukovic, L. E. Brus, and T. F. Heinz, Science 308, 838 (2005).
- (2) J. Maultzsch, Phys. Rev. B 72, 241402(R) (2005).
- (3) Y. Z. Ma, L. Valkunas, S. L. Dexheimer, S. M. Bachilo, and G. R. Fleming, Phys. Rev. Lett. 94, 157402 (2005).
- (4) G. N. Ostojic Phys. Rev. Lett. 94, 097401 (2005).
- (5) J. Wang, M. W. Graham, Y. Ma, G. R. Fleming, and R. A. Kaindl, Phys. Rev. Lett. 104, 177401 (2010).
- (6) J. J. Crochet Phy. Rev. Lett. 107, 257402 (2011).
- (7) H. Zhao, and S. Mazumdar, Phys. Rev. Lett. 93, 157402 (2004).
- (8) V. Perebeinos, J. Tersoff, and P. Avouris, Nano Lett. 5, 2495 (2005).
- (9) See, for example, J. Kono, R. J. Nicholas and S. Roche, Topics in Applied Physics 111, 393 (2008).
- (10) R. Matsunaga, K. Matsuda, and Y. Kanemitsu, Phys. Rev. Lett. 101, 147404 (2008).
- (11) O. N. Torrens, M. Zheng, and J. M. Kikkawa, Phys. Rev. Lett. 101, 157401 (2008).
- (12) F. Xia, M. Steiner, Y. Lin, and P. Avouris, Nat. Nanotech. 3, 609 (2008).
- (13) L. V. Butov, A. C. Gossard, and D. S. Chemla, Nature 418, 751 (2002).
- (14) T. Kampfrath Phys. Rev. Lett. 101, 267403 (2008).
- (15) X. Xu, J. Phys. Chem. C 113, 18106 (2009).
- (16) R. Huber, R. A. Kaindl, B. A. Schmid, and D. S. Chemla, Phys. Rev. B 72, 161314(R) (2005); R. A. Kaindl, D. Hgele, M. A. Carnahan, R. Lvenich, and D. S. Chemla, Nature 423, 734 (2003).
- (17) T. Ogawa, S. Watanabe, N. Minami, and R. Shimano, Appl. Phys. Lett. 97, 041111 (2010).
- (18) I. Chatzakis, Phys. Rev. B 86, 125110 (2012); I. Chatzakis, Appl. Phys. Lett. 103, 043101 (2013); L. Luo, Nat. Commun. 5, 3055 (2014).
- (19) A phonon resonance scenario can be excluded since the resonances (or periodical oscillations) are absent in static THz conductivity spectra (or the photoinduced temporal traces).
- (20) A. Jorio Phys. Rev. B 71, 075401 (2005).
- (21) C. Manzoni Phys. Rev. Lett. 94, 207401 (2005).
- (22) Y. Murakami, and J. Kono, Phys. Rev. Lett. 102, 037401 (2009).
- (23) The small is consistent with the estimation from time-averaged photoluminance 0.060.08 below 10K Matsunaga2 .
- (24) R. Matsunaga, Y. Miyauchi, K. Matsuda and Y. Kanemitsu, Phys. Rev. B. 80, 115436 (2008).
- (25) The same 4 THz bleaching component also contributes at the high lattice temperature, e.g., the 300K spectral shape in Fig. 2(e).
- (26) Note that the photoexcited exciton density is still below the expected Mott density in SWNTs Murakami .
- (27) T. Li, et. al., Nature 496, 69 (2013); A. Patz, et. al., Nat. Commun. 5, 3229 (2014); T. Li, et. al., Phys. Rev. Lett. 108, 167401 (2012)